Are We Topping?
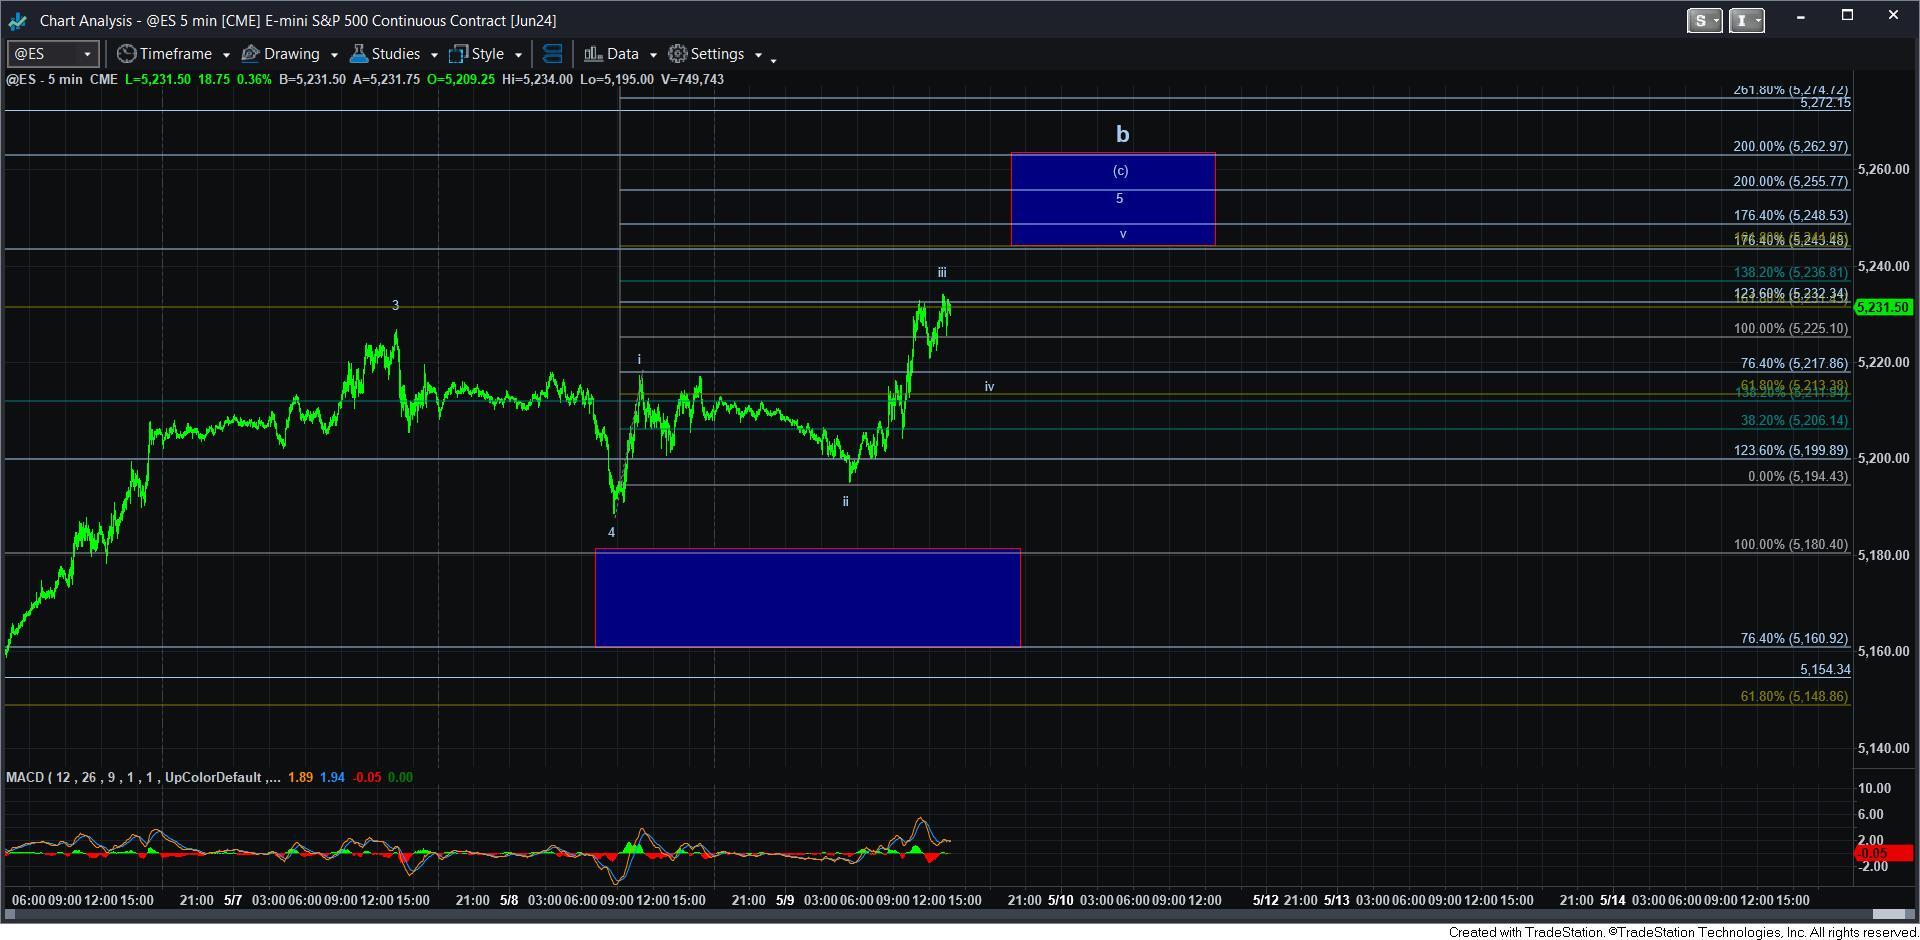
As we came into this week, the expectation for the SPX was for higher before this [c] wave of what we are counting as a b-wave corrective rally completed. And, as I write this update, I am seeing us in the final squiggles of the 5th wave of that [c] wave.
I have included the 5-minute ES chart in this update so you can see that I think we still may be seeing one more iv-v before this 5th wave of the [c] wave completes. And, more often than not, we see wave iv overlap wave i in this structure, as this 5th wave seems to be taking shape as an ending diagonal.
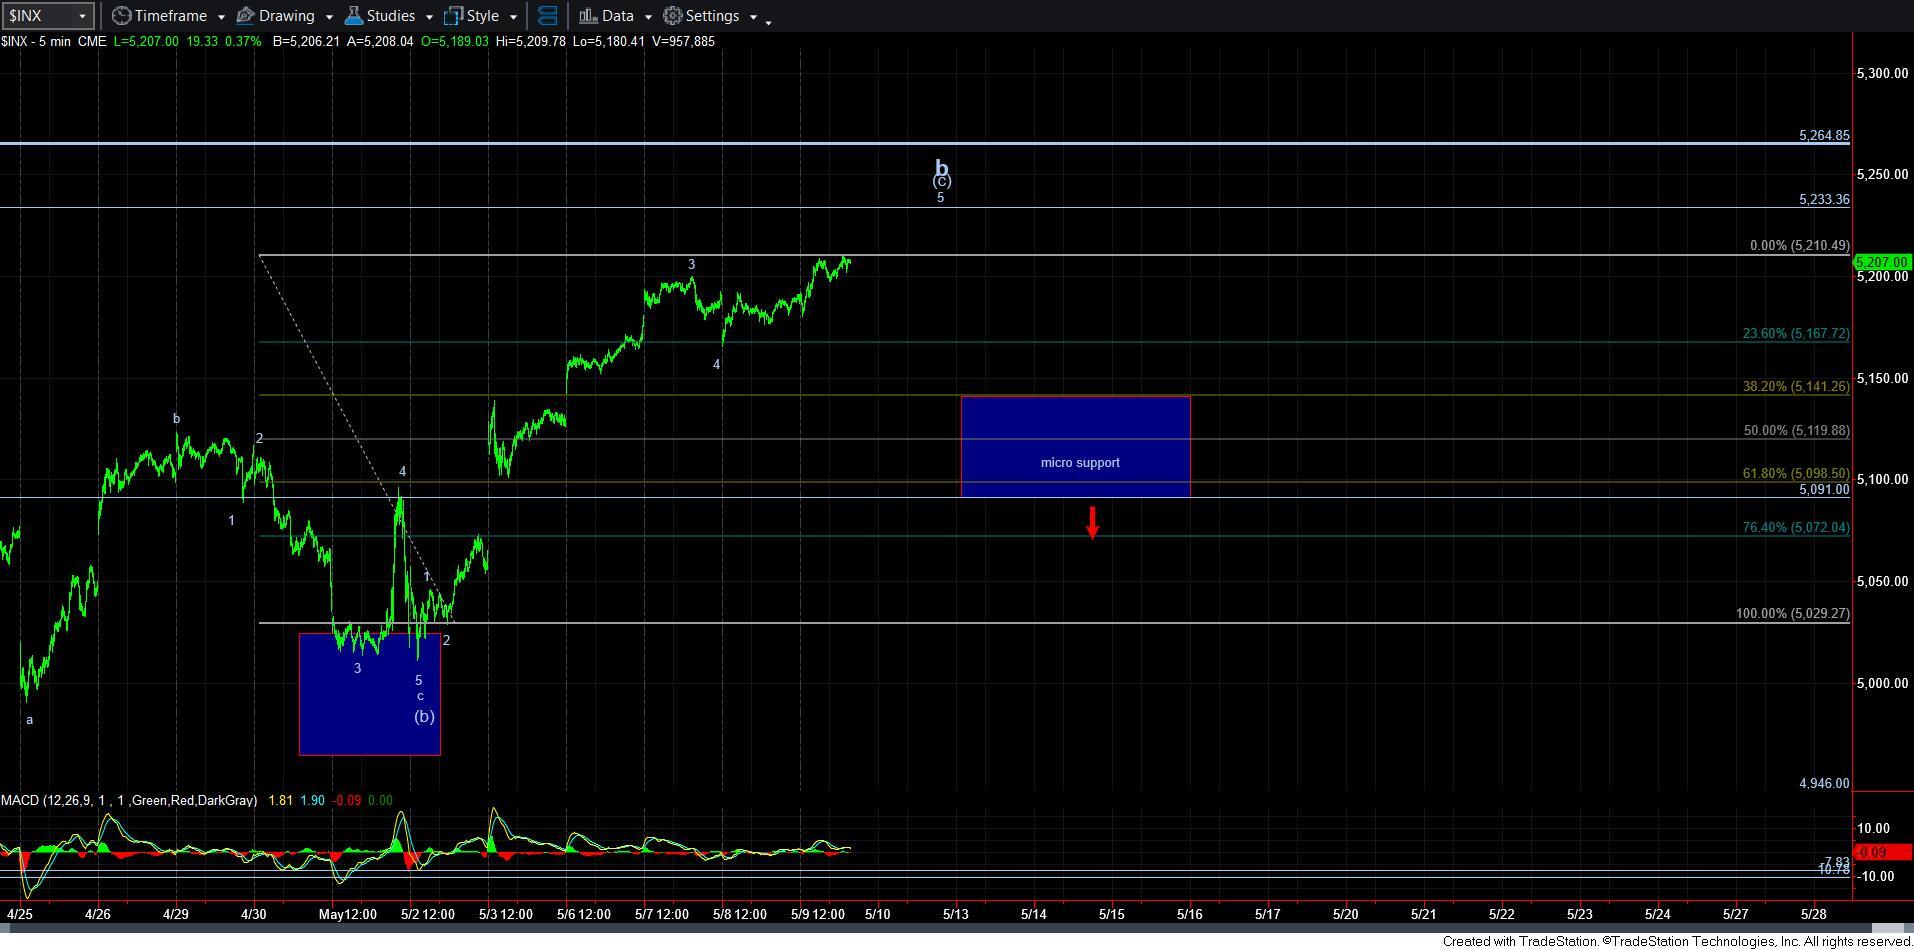
So, in the bigger picture, it does look like we are approaching the completion of a b-wave rally off the 4950SPX bottom region we struck a few weeks ago. Thus far, this has followed along the path we have outlined.
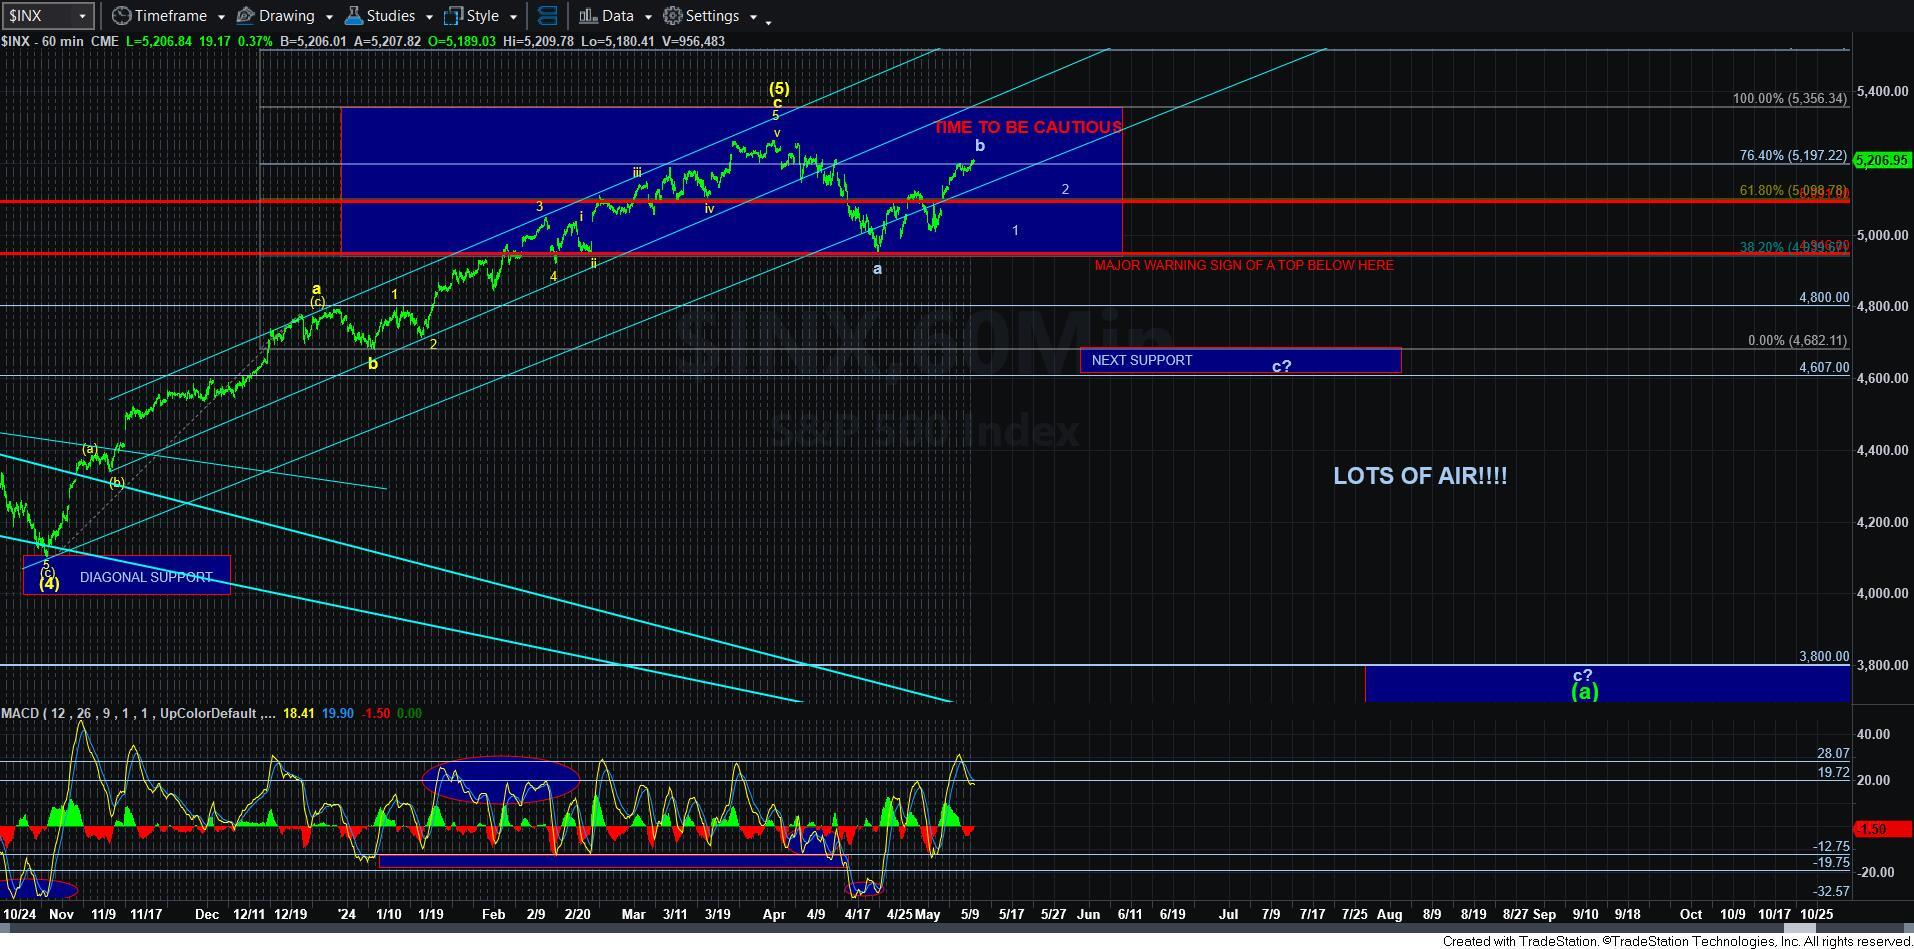
Yet, even though it seems to be following the path, I will still need to see evidence that a top has indeed been struck. Such evidence will come in a 5-wave decline off a top, and then breaking back down below 5091SPX to provide us with a higher degree 5-wave decline which we would count as wave 1, as outlined on the 60-minute chart. Should we see a 5-wave decline of that degree, then we would have a very strong indication that a top has been struck, and we can begin setting up short trades on the ensuing wave 2 bounce.
So, for now, nothing much has changed in my overall perspective. I still think we have a few squiggles left before a top may be struck. And, I still want to see the downside structure and a break of support to provide us with strong evidence a top has been struck.