Are We There Yet?
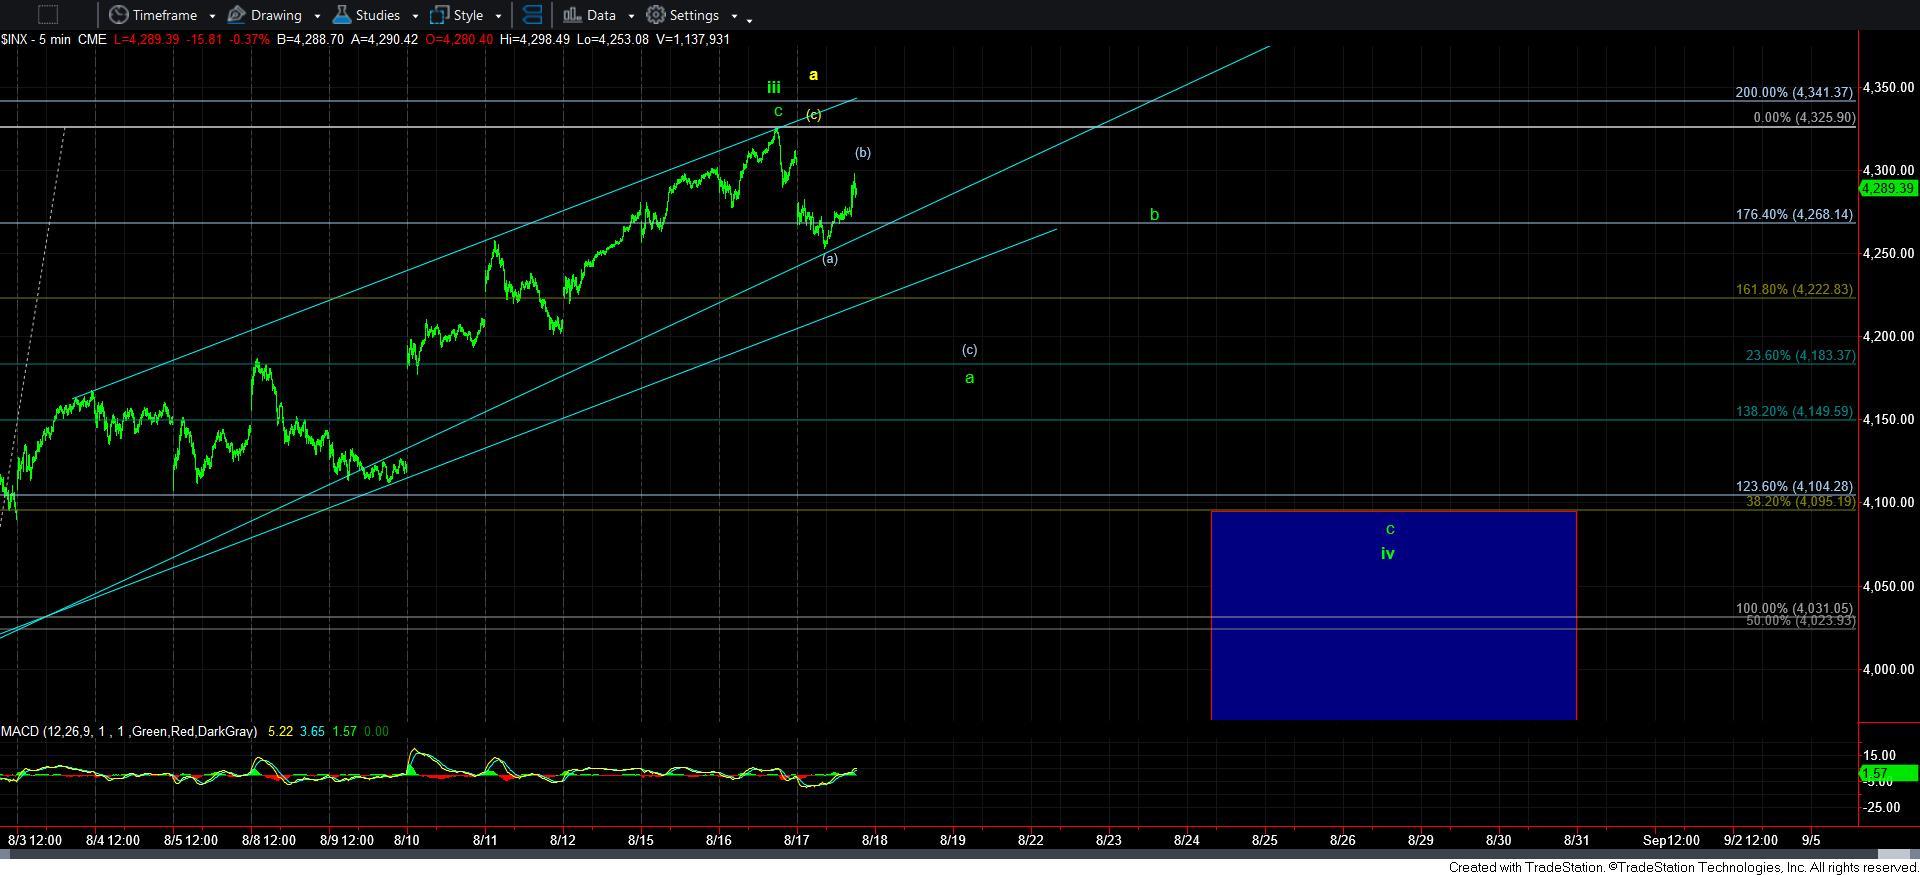
With the market still not yet breaking down even below the initial trend channels outlined on my 5-minute chart, we have no clear indication from price action that wave iv is actually in progress.
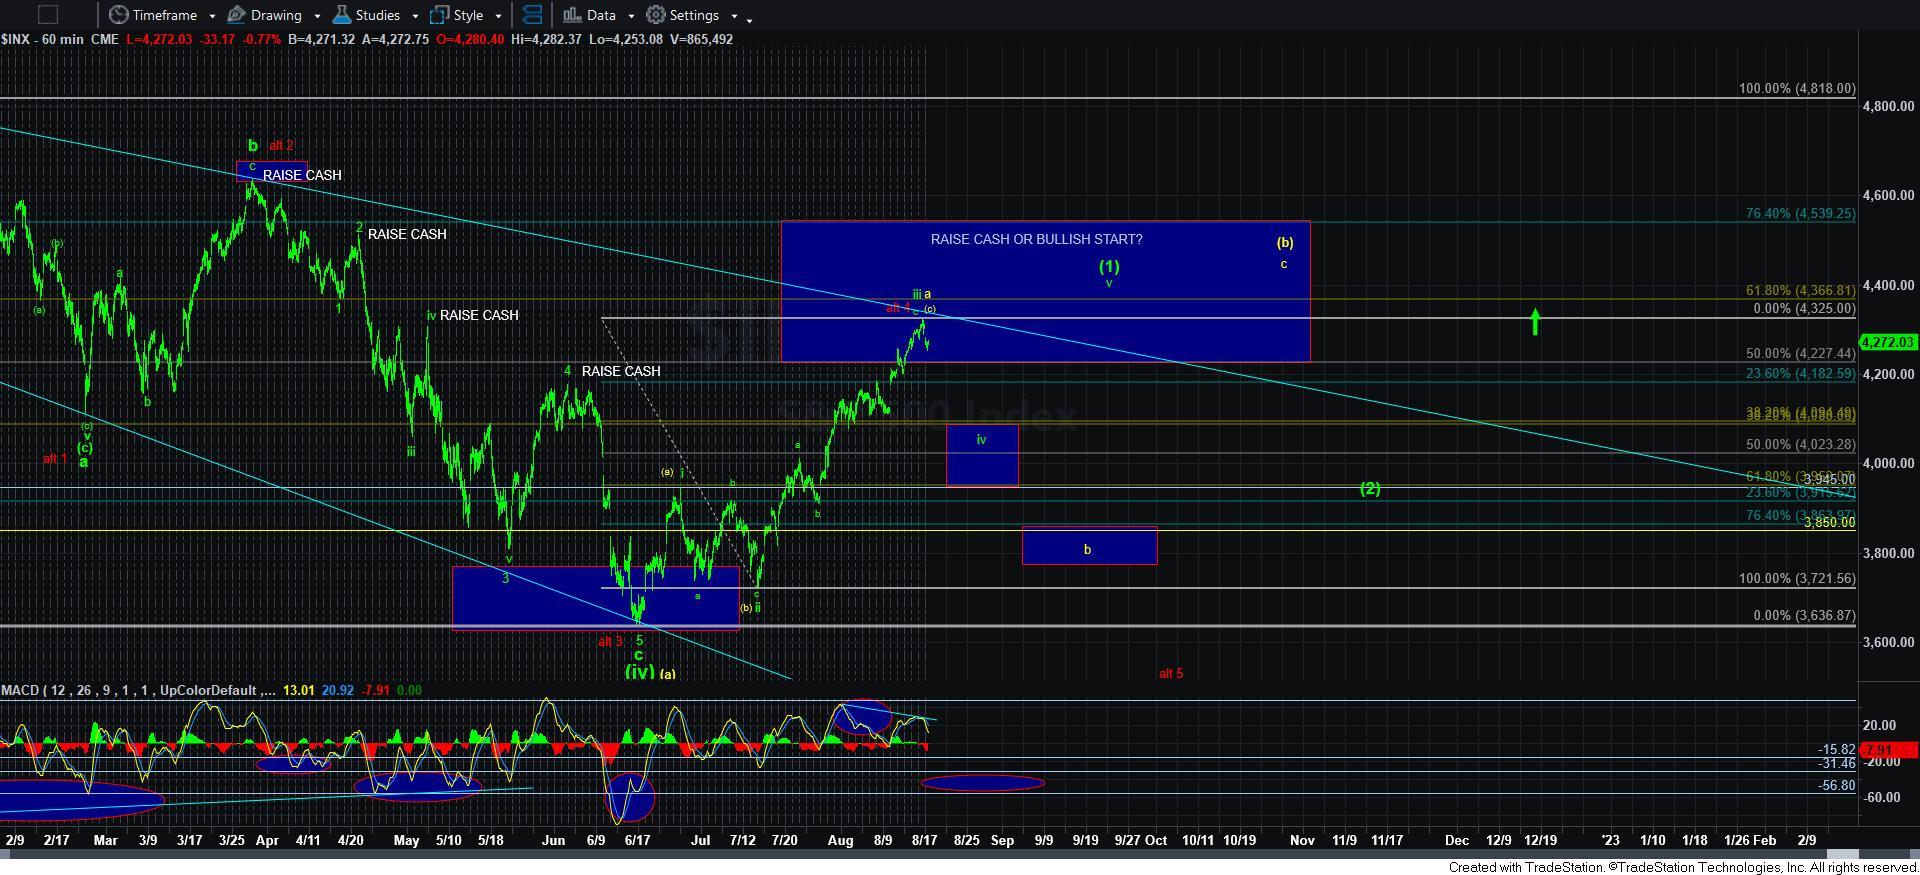
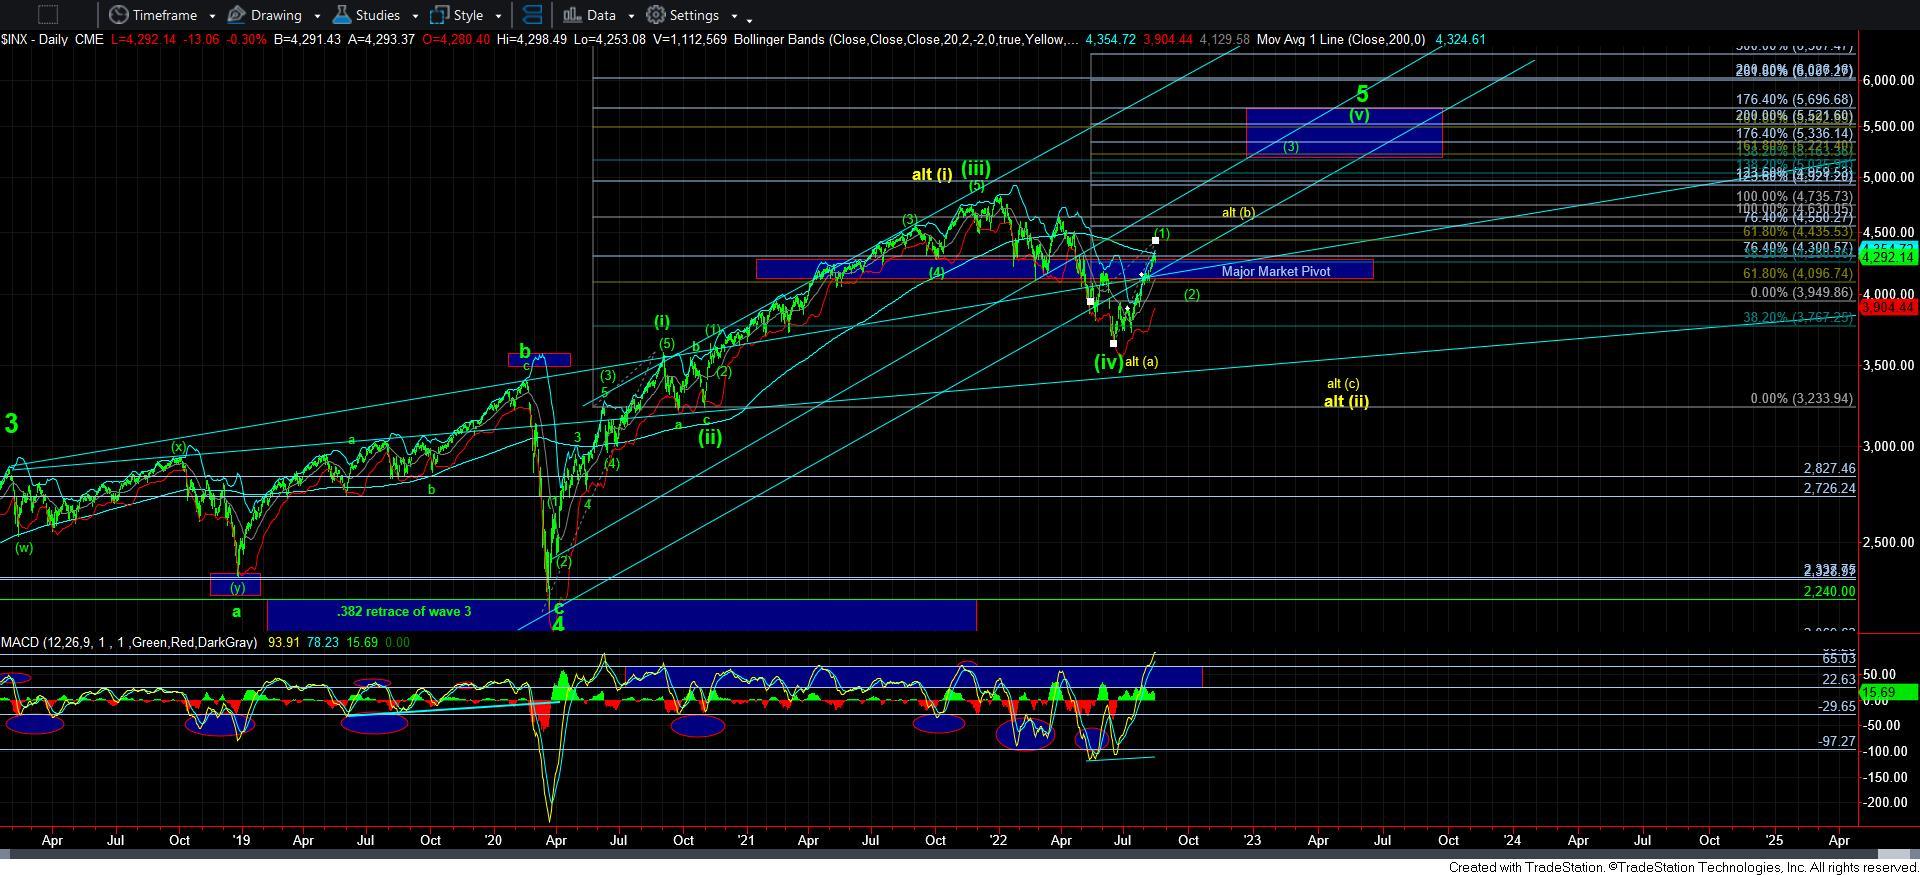
However, I want to highlight again the extended nature of the daily MACD, which is at the nosebleed levels last seen when wave [3] topped of wave [i], back in June of 2020. Moreover, the 60-mintue MACD has displayed negative divergences, and has turned down. But, keep in mind that extended can get even more extended, and the 60-minute MACD can display yet another divergence on a higher high.
While the posture of the MACD would have me clearly expecting wave iv to have potentially begun already, I would like to see us break down out of the uptrend channel for a bit more confirmation.
As far as a path for wave iv, the standard path suggests that the a-wave of iv targets the .236 retracement of wave iii, which is in the 4180SPX region, followed by a b-wave rally to the underside of the broken trend channel, followed by a c-wave down to the .382 retracement region and the top of our wave iv box.
So, we are left waiting for a more clear indication that wave iv is in progress, as this market has been incredibly strong to the upside and has been bought on every pullback.