Are We Really Doing This Again?
 By
Avi Gilburt
By
Avi Gilburt
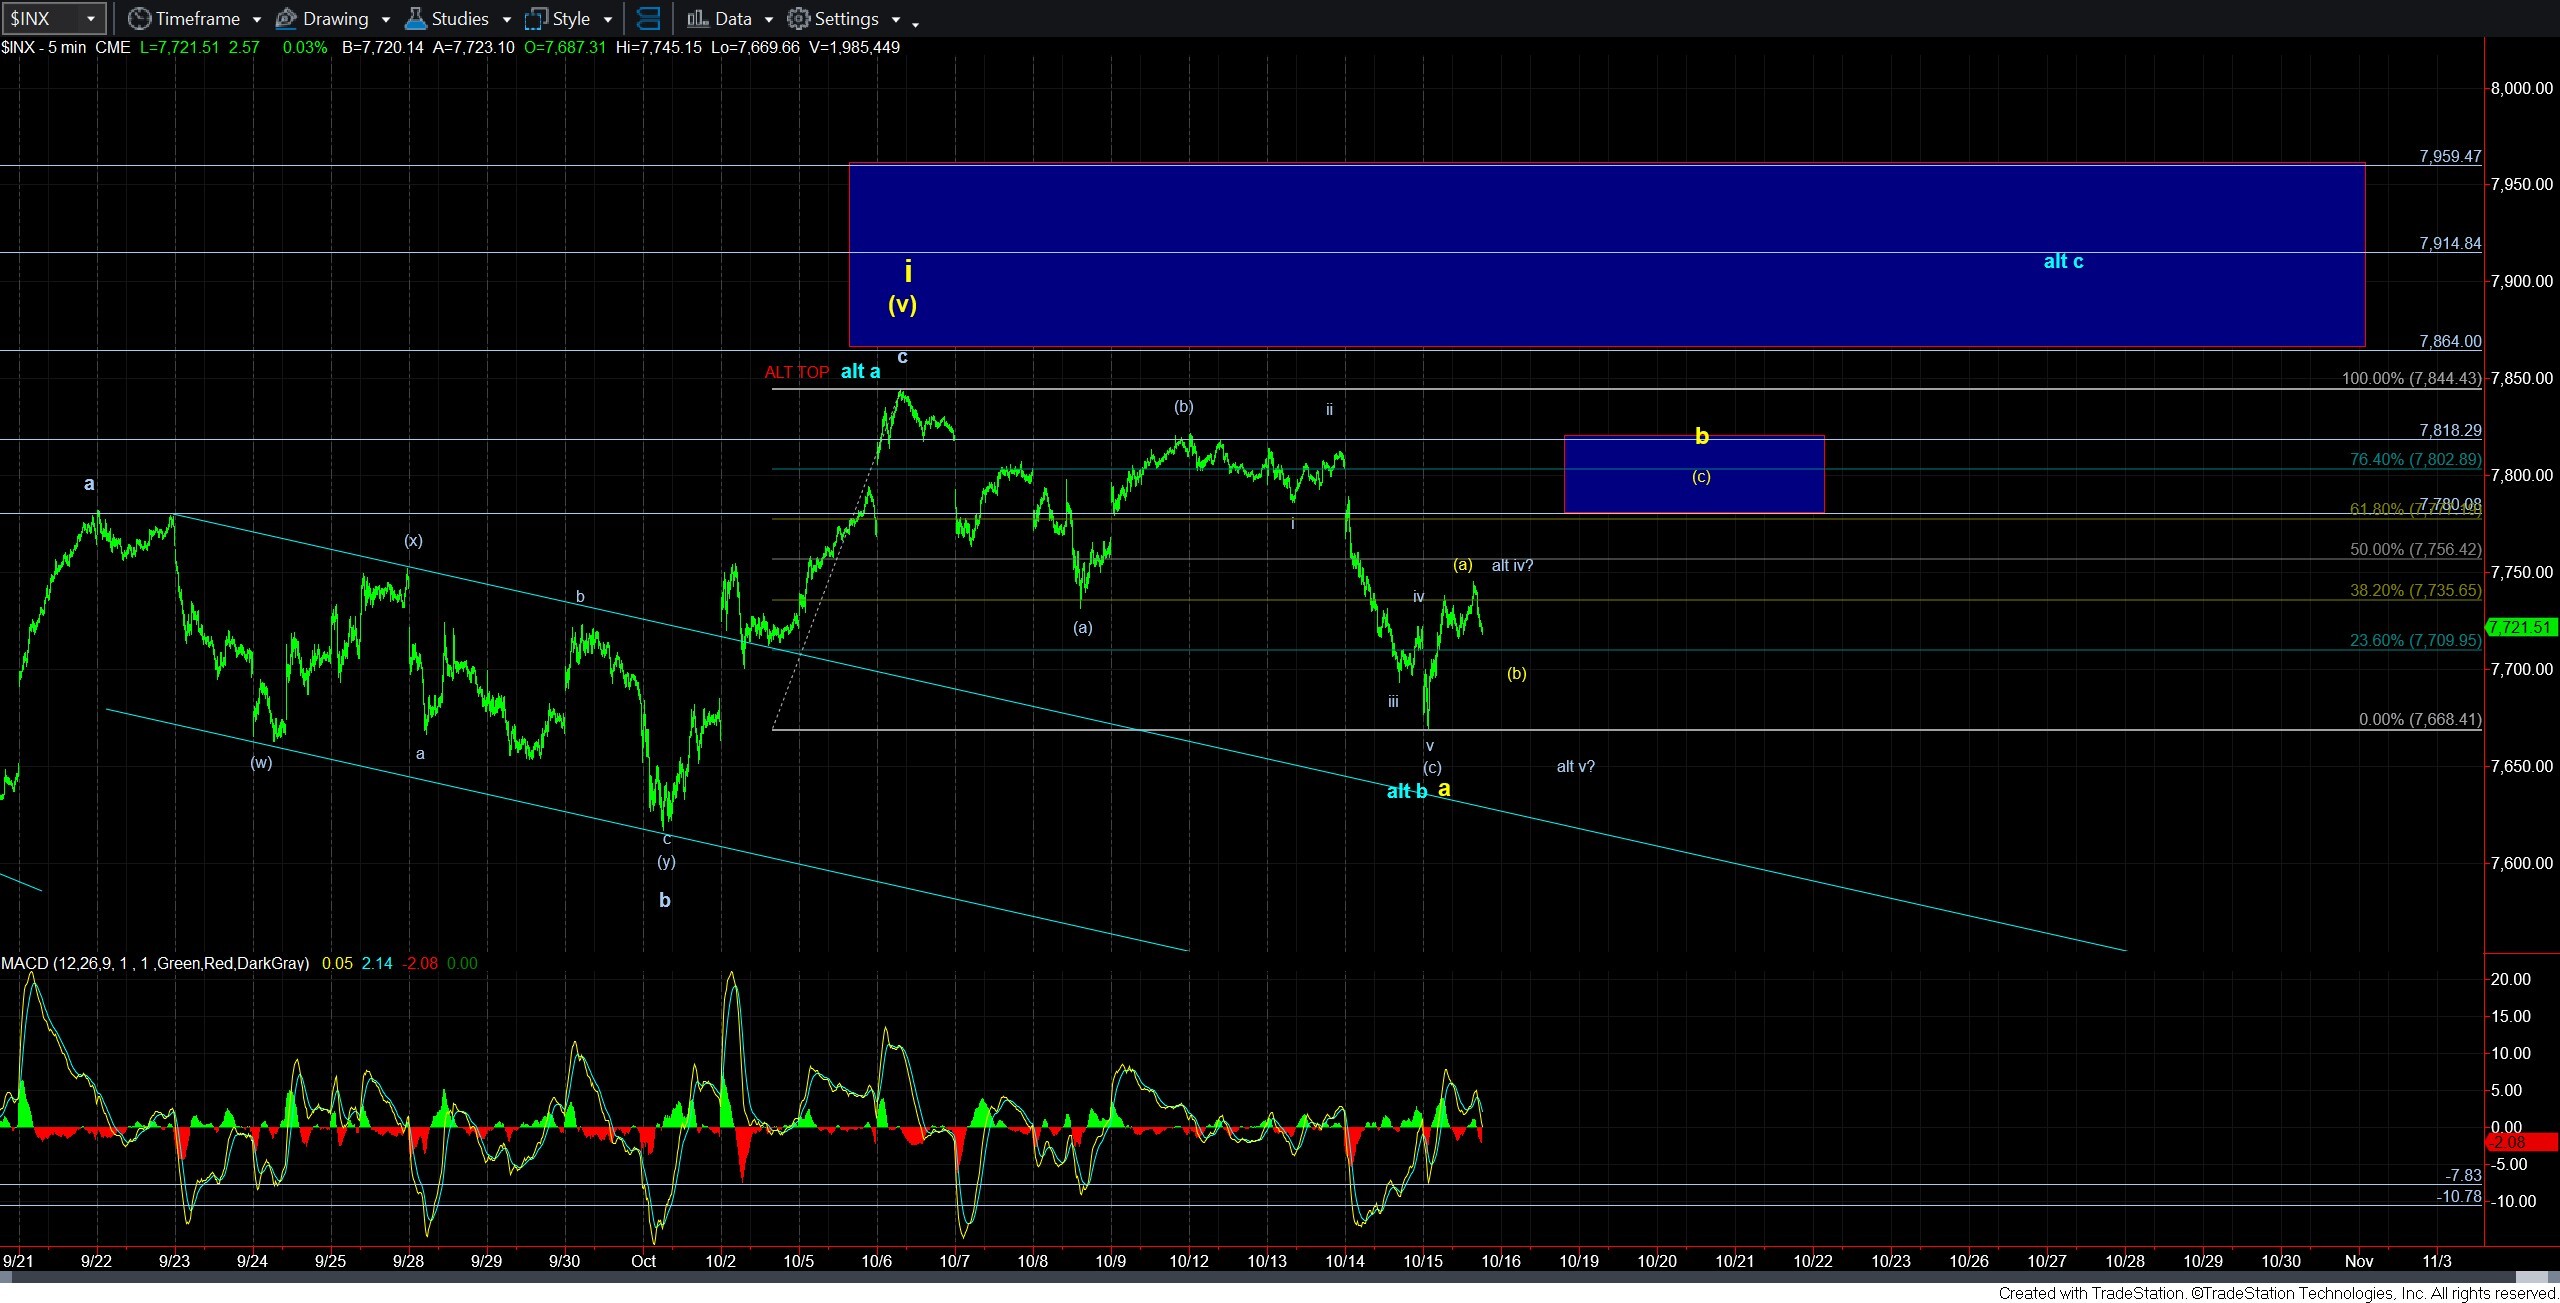
With the depth of the pullback that ended this morning, it has made it VERY hard for me to accept that the market is going to attempt one more push higher in the c-wave outlined in the blue count on the 5-minute SPX chart. In fact, Mike and I had a conversation about this, and it really is a bit of a push.
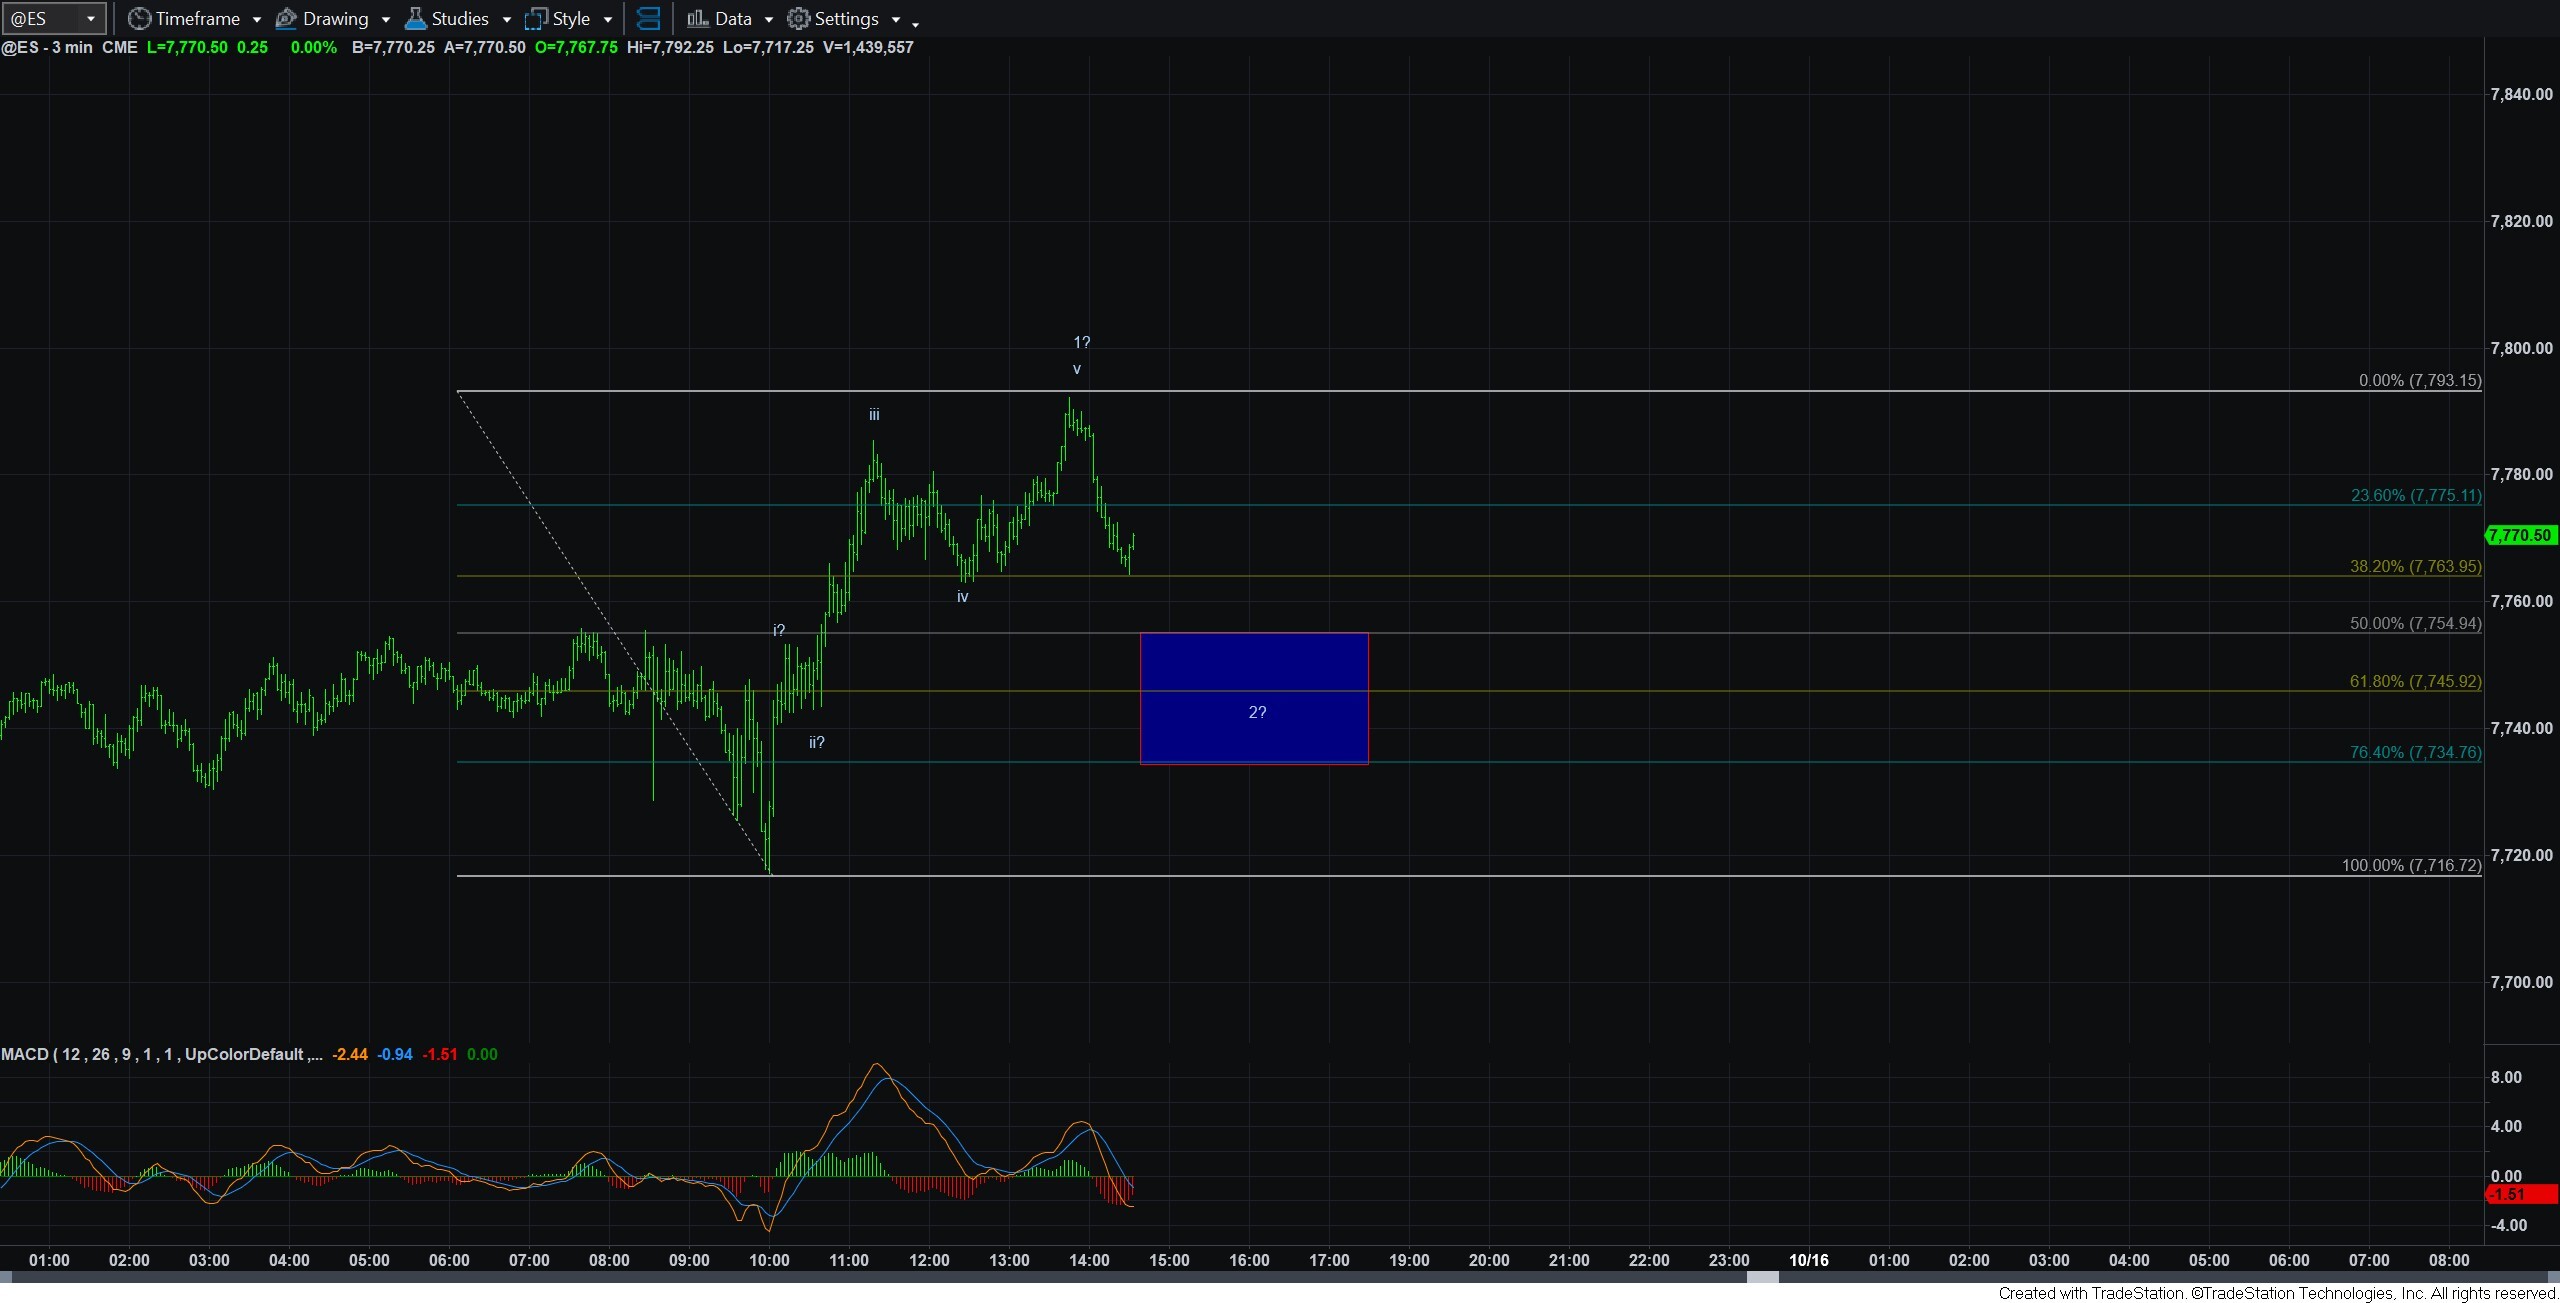
However, I was willing to adopt that count IF, and only IF, we saw a CLEAR 5-wave Fibonacci Pinball structure off the low for wave 1 of that c-wave. But, what we got today barely even qualifies as a leading diagonal, and I already do not view them as reliable trading cues. While the 3rd wave of the potential leading diagonal did strike its standard target at the 1.236 extension of waves i-ii, the 5th wave came up woefully short of the minimum target we usually see at the 1.618 extension of waves i-ii.
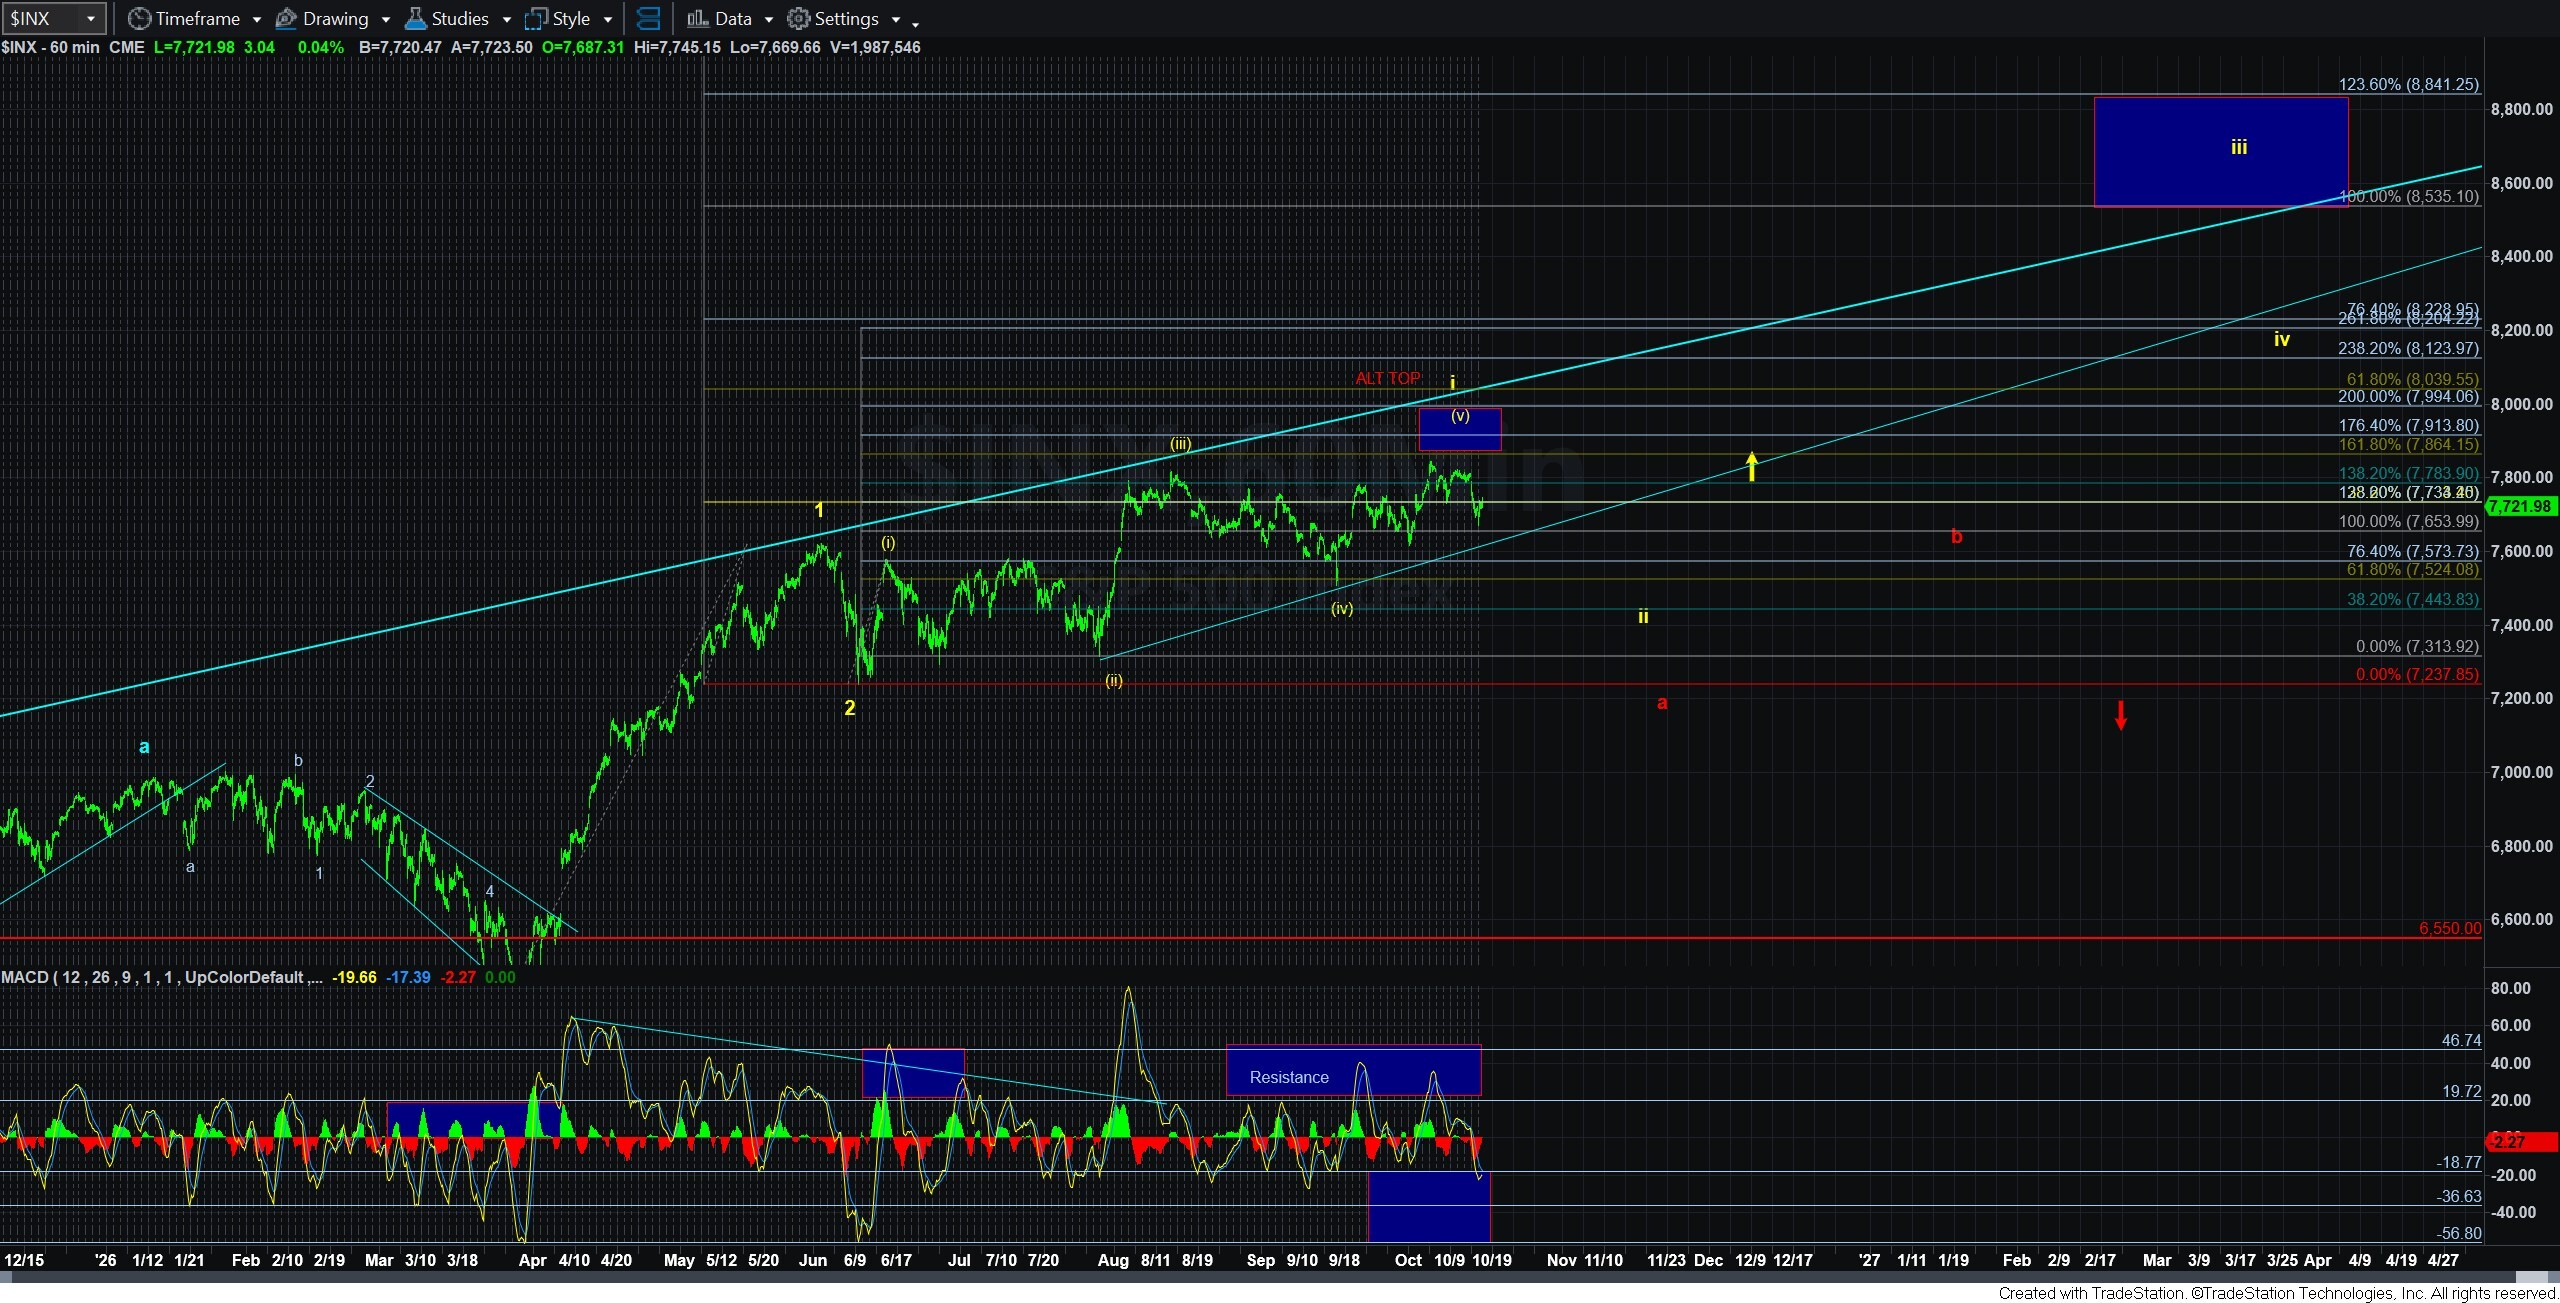
So, of course, it leaves us all with a question as to how much reliance do you want to place into this structure? Personally, I am going to lean towards the yellow count having wave i already topped, and us starting the wave ii corrective pullback. I will still keep an open mind regarding the blue wave count, and will track it in the background on the 3-minute ES chart that I have attached here. But, there are just too many issues with this rally off the low to make that a reliable count in my eyes.
Of course, if this was only a corrective rally for a wave iv in the (c) wave, as shown on the 5-minute SPX chart as an alt-count, then we can make a lower low and start this process all over.
But, for now, I think I have to lean towards the yellow count, unless I see something that begins to sway me towards the blue count. Either way, I think they both point us higher, so I will keep an open mind to the potential and track it along with our next pivot (once the 1-2 is in place) to provide early warnings signs if it begins to fail in the blue count, and make the yellow count much more solid.