Are We Ready To Run To 4900?
To answer simply, I am not yet convinced. But, today’s action has certainly opened the door for the bulls. Allow me to explain.
Oftentimes, corrective action develops with a-b-c structures, with a common ratio being an a=c relationship. Today, the SPX/ES broke out over what may be an a=c relationship off the lows. This opens the door for the bulls to take the ball and begin the run to 4900.
But, just because the door has opened does not necessarily mean that we will be able to walk through it. As I said earlier, because we came up a bit short of our ideal target zone for wave 4, I have to still view the potential for a c-wave decline taking us into that region as a higher probability than I would currently prefer.
Now, being a purist, I always allow the Fibonacci Pinball structure to guide me in my determination regarding impulsive vs. corrective structure. And, the major determination factor is the .618 extension off the structure off the lows.
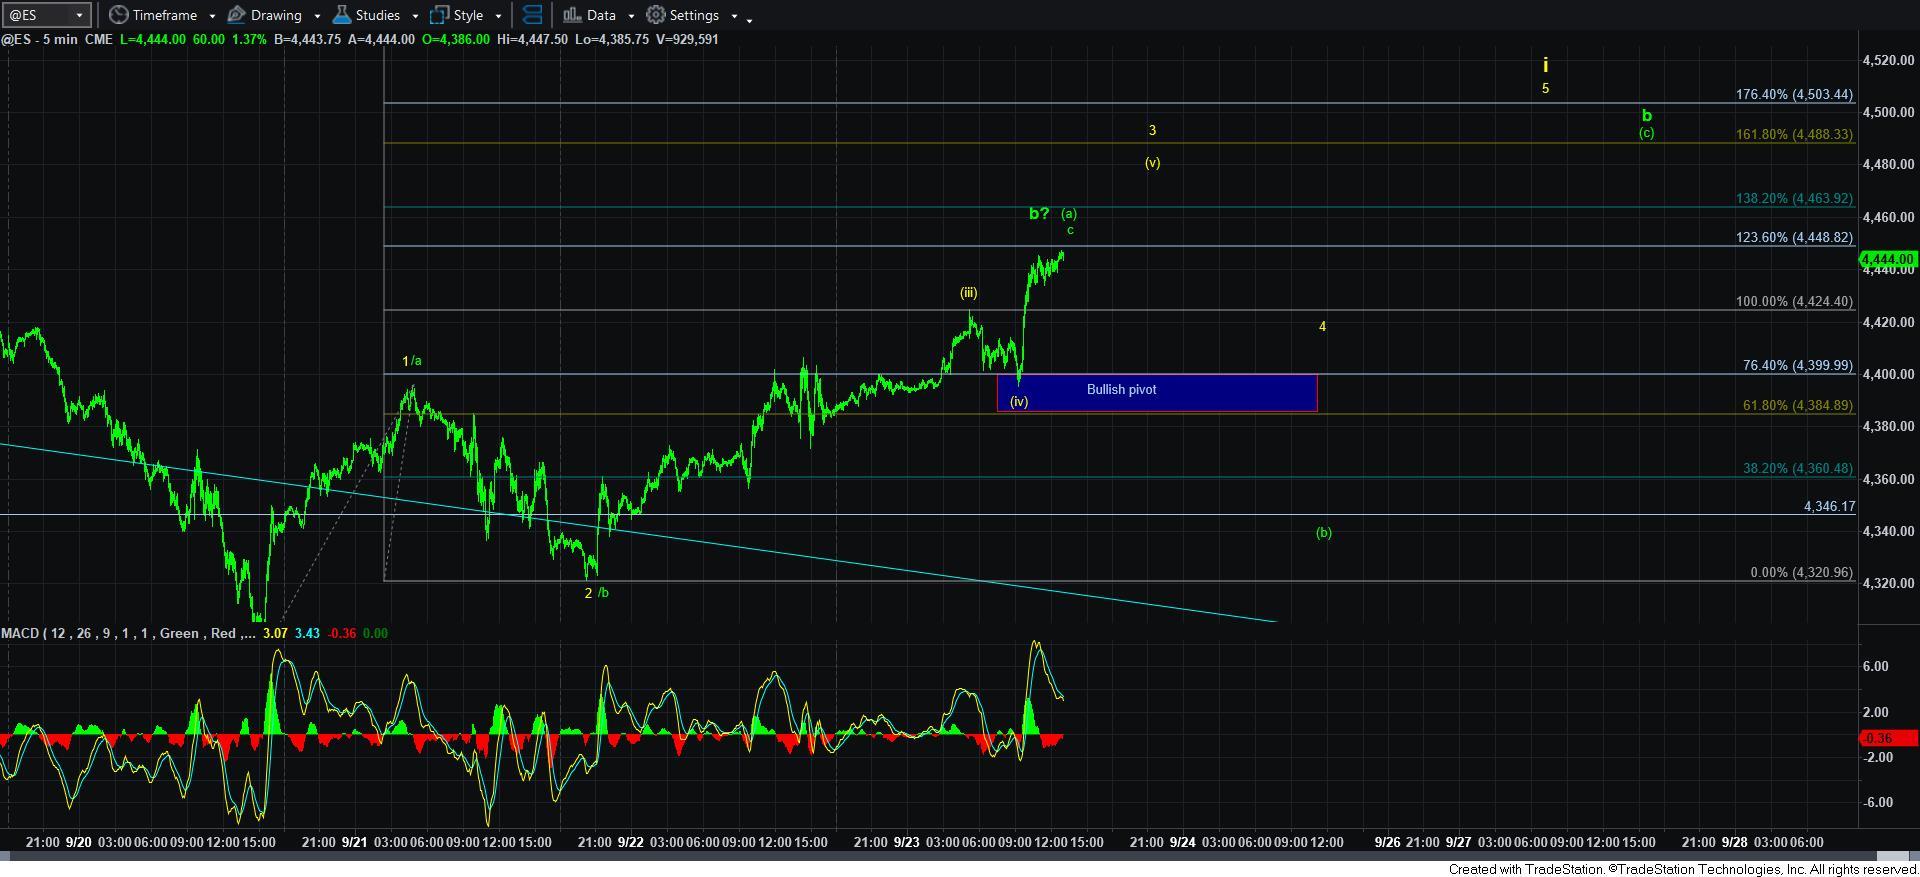
Let’s look at the attached 5-minute ES chart as our current example. Assuming that the wave 4 has indeed bottomed – which is the scenario presented as an alternative in yellow right now – you can see that the market has broken out over the 1.00 extension off the lows. That is often a bullish indication. Before it did so, it ran up to the 1.00 extension, and pulled back and held the bullish pivot between the .618-.764 extension. That would mean the next hurdle is the 1.236 extension which is where we are currently finding resistance as I write this update.
Should the market be able to blow through that region, then we could very well be completing a bullish wave [v] of 3, which has an ideal target in the 4488ES region. From there, if we are able to pullback correctively to the 1.00 extension in the 4424ES region, followed by a 5th wave higher, then we have a Fibonacci Pinball standard 5 wave structure completing off the recent pullback low, which suggests the bulls are setting up to rally to 4900SPX sooner rather than later.
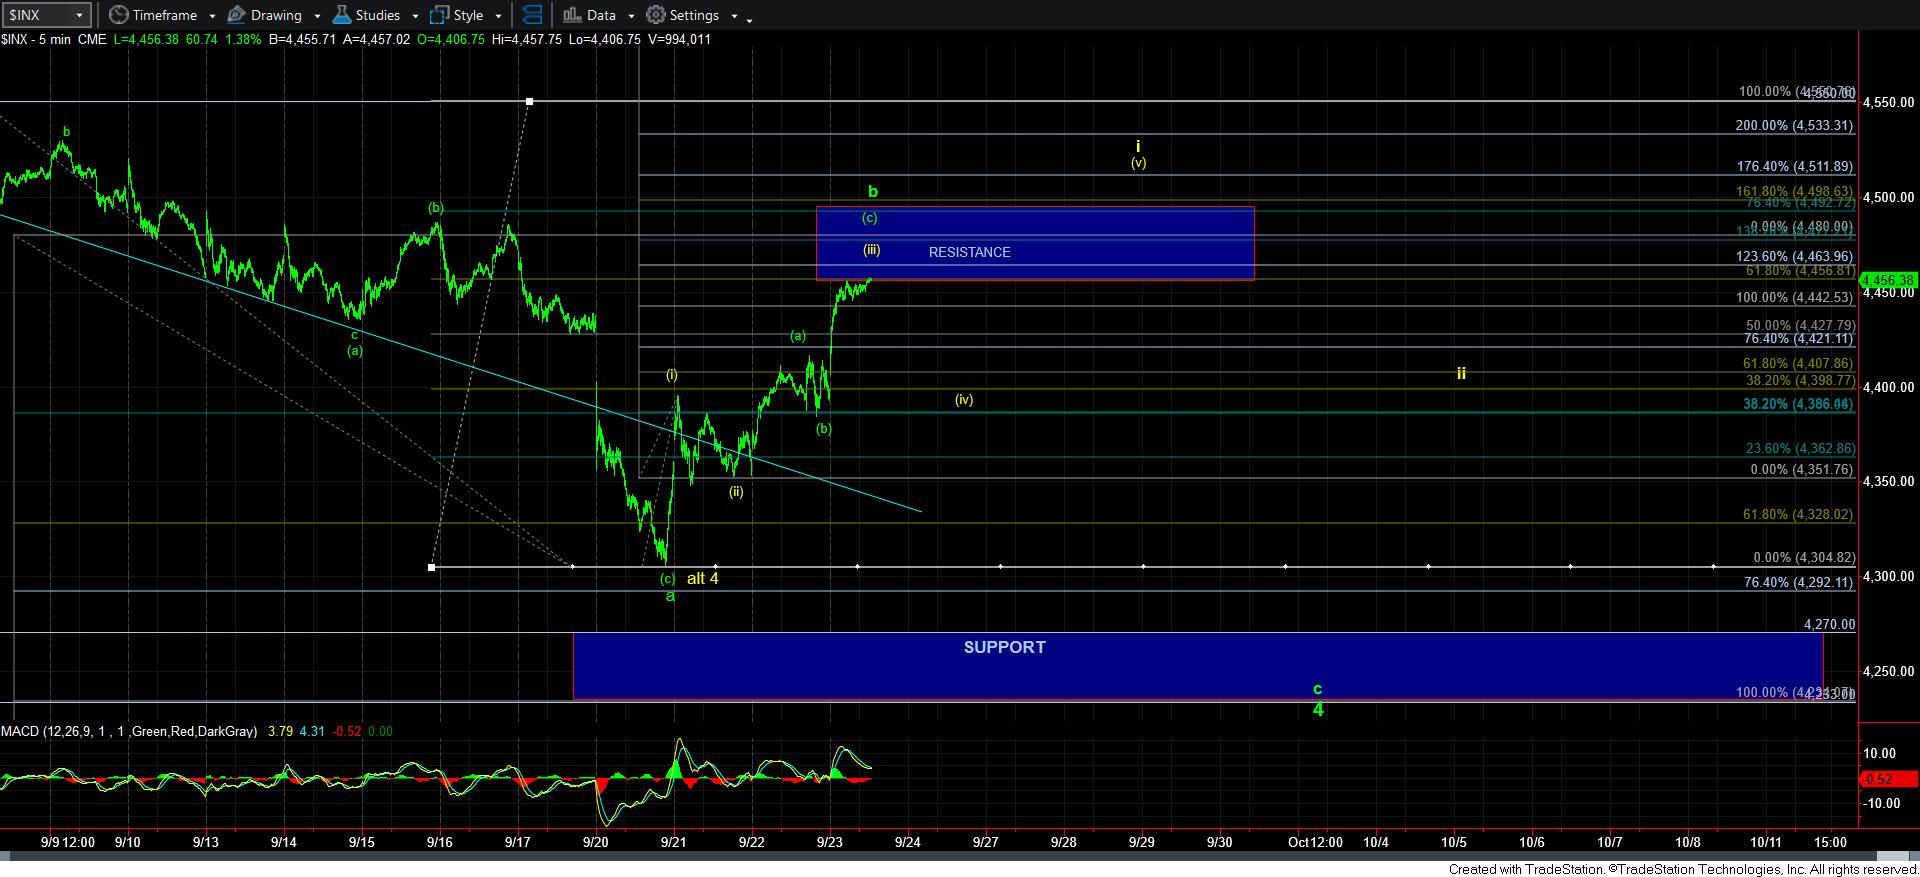
Another path with which the bulls can complete 5-waves up is through a leading diagonal path, which would top a wave [iii] at the 1.236 extension of waves [i] and [ii], which is presented on the 5-minute SPX chart as an example. We would then see a deep wave [iv] corrective pullback, followed by a higher rally towards the 4510SPX region. This would also complete a 5-wave structure and suggest the market is getting ready to rally to 4900 sooner rather than later.
So, with today’s break out through that 1.00 extension, the bulls have certainly opened the door.
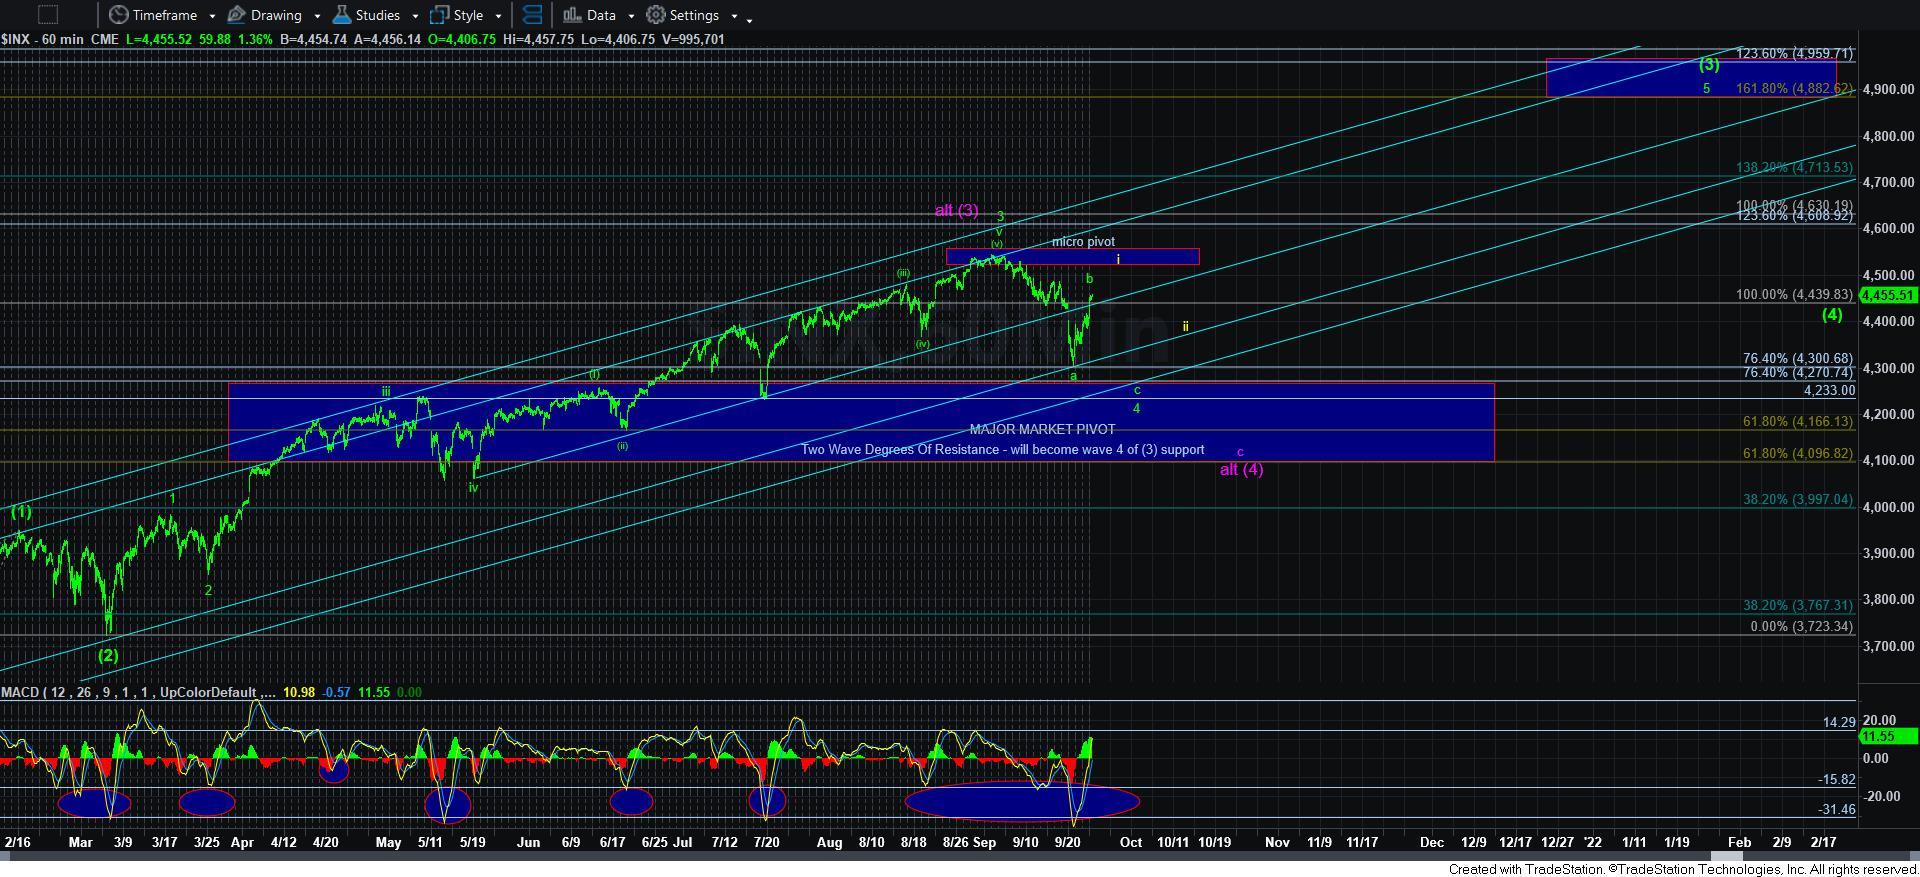
But, with the market not reaching its ideal target on the downside for its wave 4 pullback, the bears are not out of the game just yet. But, there are also several paths the bears can take before we are ready to drop towards the low 4200’s to complete a c-wave of wave 4.
The main reason we have this many potential counts on the chart is due to the whipsaw action we saw during the day yesterday, which can be interpreted in several ways, as it was not at all a clean structure that is clearly leaning one way or the other. And, the fact that we have moved through the 1.00 extension today has opened the door for the bulls.
I know many of you are scratching your heads right now. So, let me distill this quite simply.
Please see the bullish pivot I have noted on the ES chart. It resides between 4384-4400ES. ANY clear 5-wave break down below that bullish pivot tells me that the market has begun a c-wave down towards the low 4200 region to complete wave 4. Anything less than that – in other words, a corrective decline below that bullish pivot, or a corrective pullback that holds over that pivot – suggests the bulls are still trying to complete a 5-wave structure for wave i of 5 of [3], and we may have begun our rally to 4900+ sooner rather than later. It is that simple right now.
So, while I still give the advantage in the near term to the bears, I am not so eager to join their party until I see a CLEAR 5-wave decline below that bullish pivot.


