Are We Ready To Run To 2900+?
With today’s gap up through 2820SPX, the market continued to run back up towards the highs we struck earlier this week. And, we are getting close to getting the bullish trigger for the run to 2935, and potentially much higher in the coming months.
As I have been warning over and over, we must remember that this is still a bull market. That means that surprises come to the upside. So while I always want to tick and tie patterns to exact targets, the markets often have other ideas. While we caught a very nice pullback off the highs of last week, we came up just a bit short of our ideal targets below.
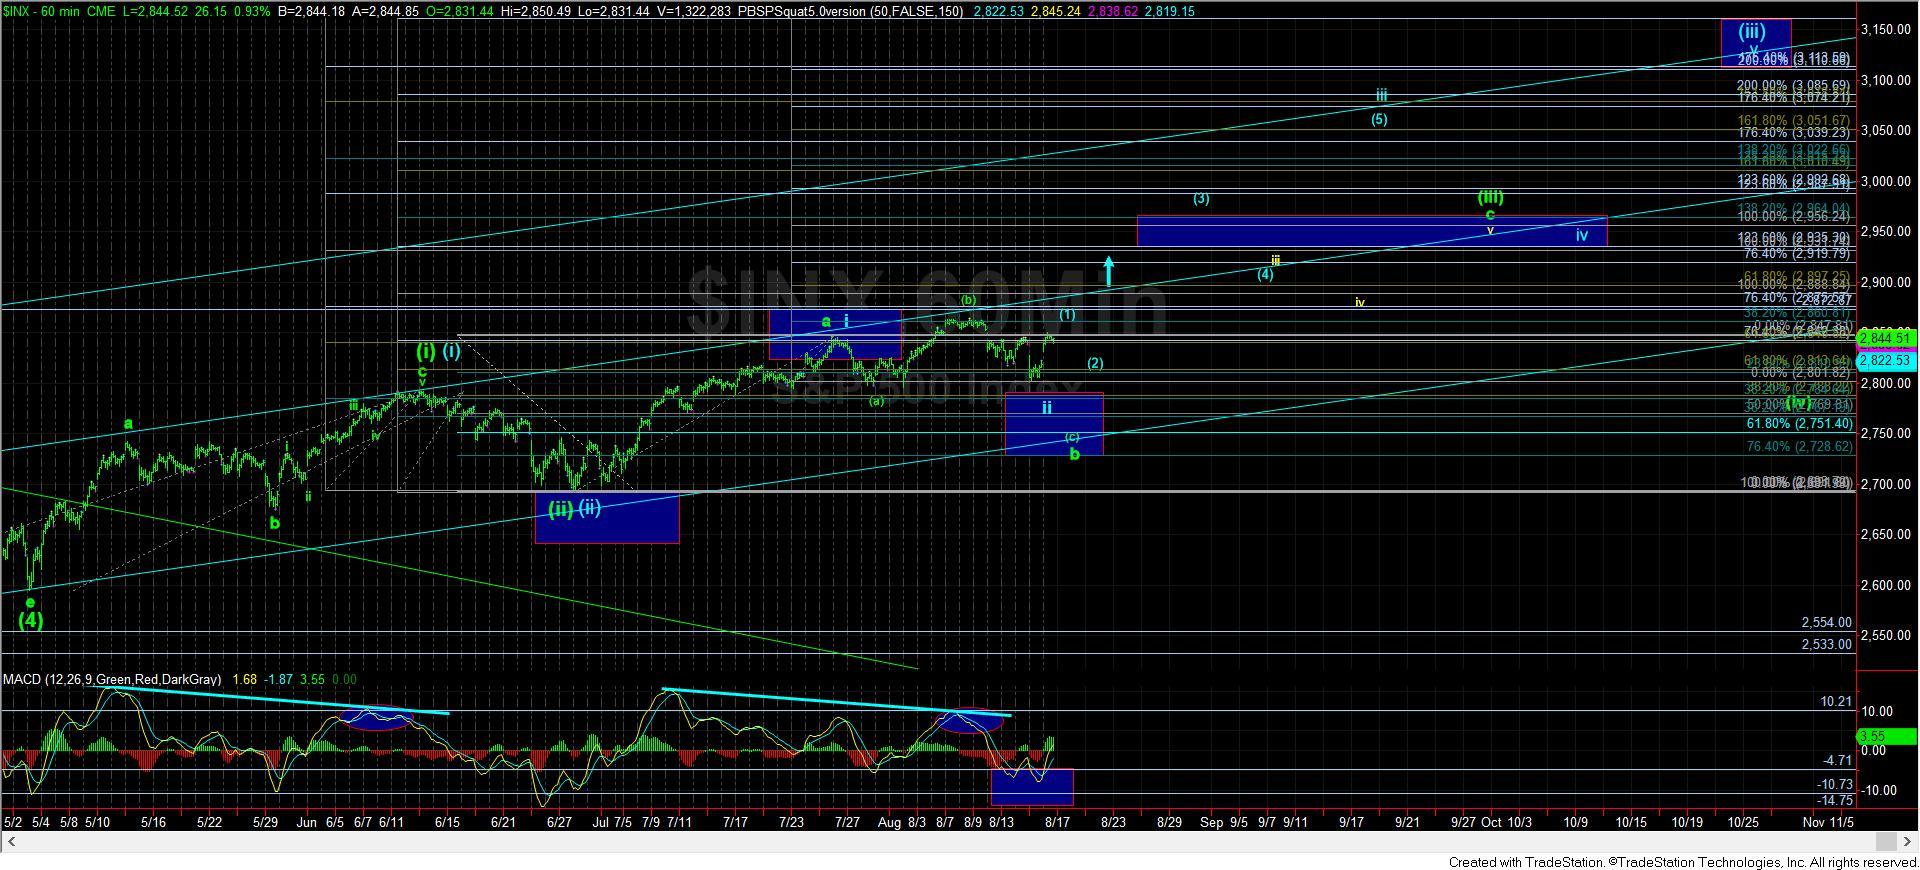
Yesterday, we came down to within points of a 1.00 extension down, and also came VERY close to the blue box on the chart. Moreover, the MACD on the 60-minute chart has moved into the blue box as I wanted to see occur to re-set the indicators for the next rally. And, with today’s rally, it seems the market is attempting to set up for the run through 2900SPX.
But, we still do not have confirmation of that potential. So, let me tell you what I am looking for.
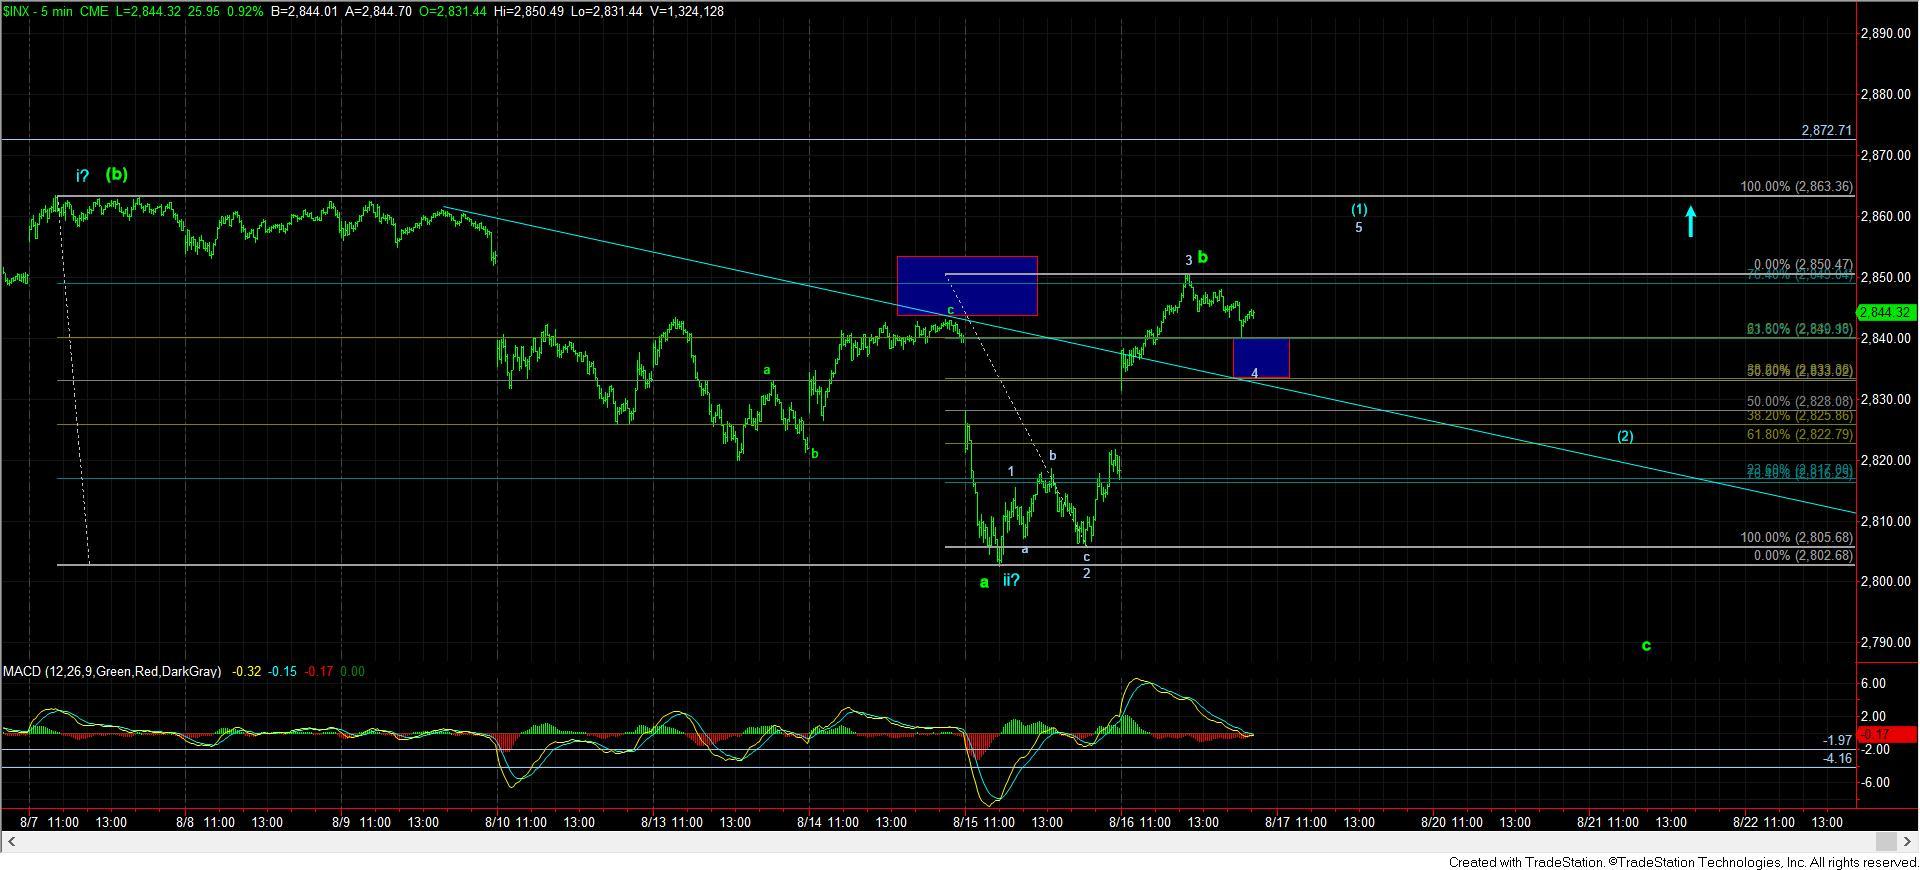
As you can see on the attached 5-minute chart, we need to hold over 2833SPX, and then rally to a higher high to complete a potential 5 wave structure off yesterday’s low. Now, in order to confirm that this is the correct structure, we then would need to see a corrective pullback in wave (2). Once wave (2) completes, when we rally back over the top of wave (1) in an impulsive structure, we have a probability signal that we are heading to the 2900+ region.
Alternatively, if the market begins to drop impulsively below 2833SPX, then it opens the door to this rally being a b-wave corrective rally, and we will again be targeting the 2800SPX region and potentially lower.
So, until I see a solid 5 wave structure completed, I am going to remain a bit cautious in the near term. Ultimately, as you know, I still expect the SPX to rally over 2900. But, we have been working for the last few weeks to determine exactly how we get there and which larger degree pattern will be playing out. To that point, I want to add a little insight.
Normally, when the heart of a 3rd wave takes hold, it moves us from one uptrend channel into a higher accelerated channel, which I have now drawn for the blue count. That means that if we complete this (1)(2) in blue, and then begin the 3rd wave higher, and break out through the lower trend channel by the end of this month, it would suggest to me the pattern taking us to 3200+ is likely in play. Otherwise, if we are unable to break out through that trend channel by early September, then it suggests the ending diagonal is playing out, and it becomes much less likely that we can break out through 3011 before this wave (5) of v of 3 off the 2009 lows tops out.
So, the lines have been drawn over this past week. And, its time for the bulls to give us long term direction within the next few days, into the end of the month. That should provide us with enough information to guide us for the next year.