Are We Heading To 5300+ Now?
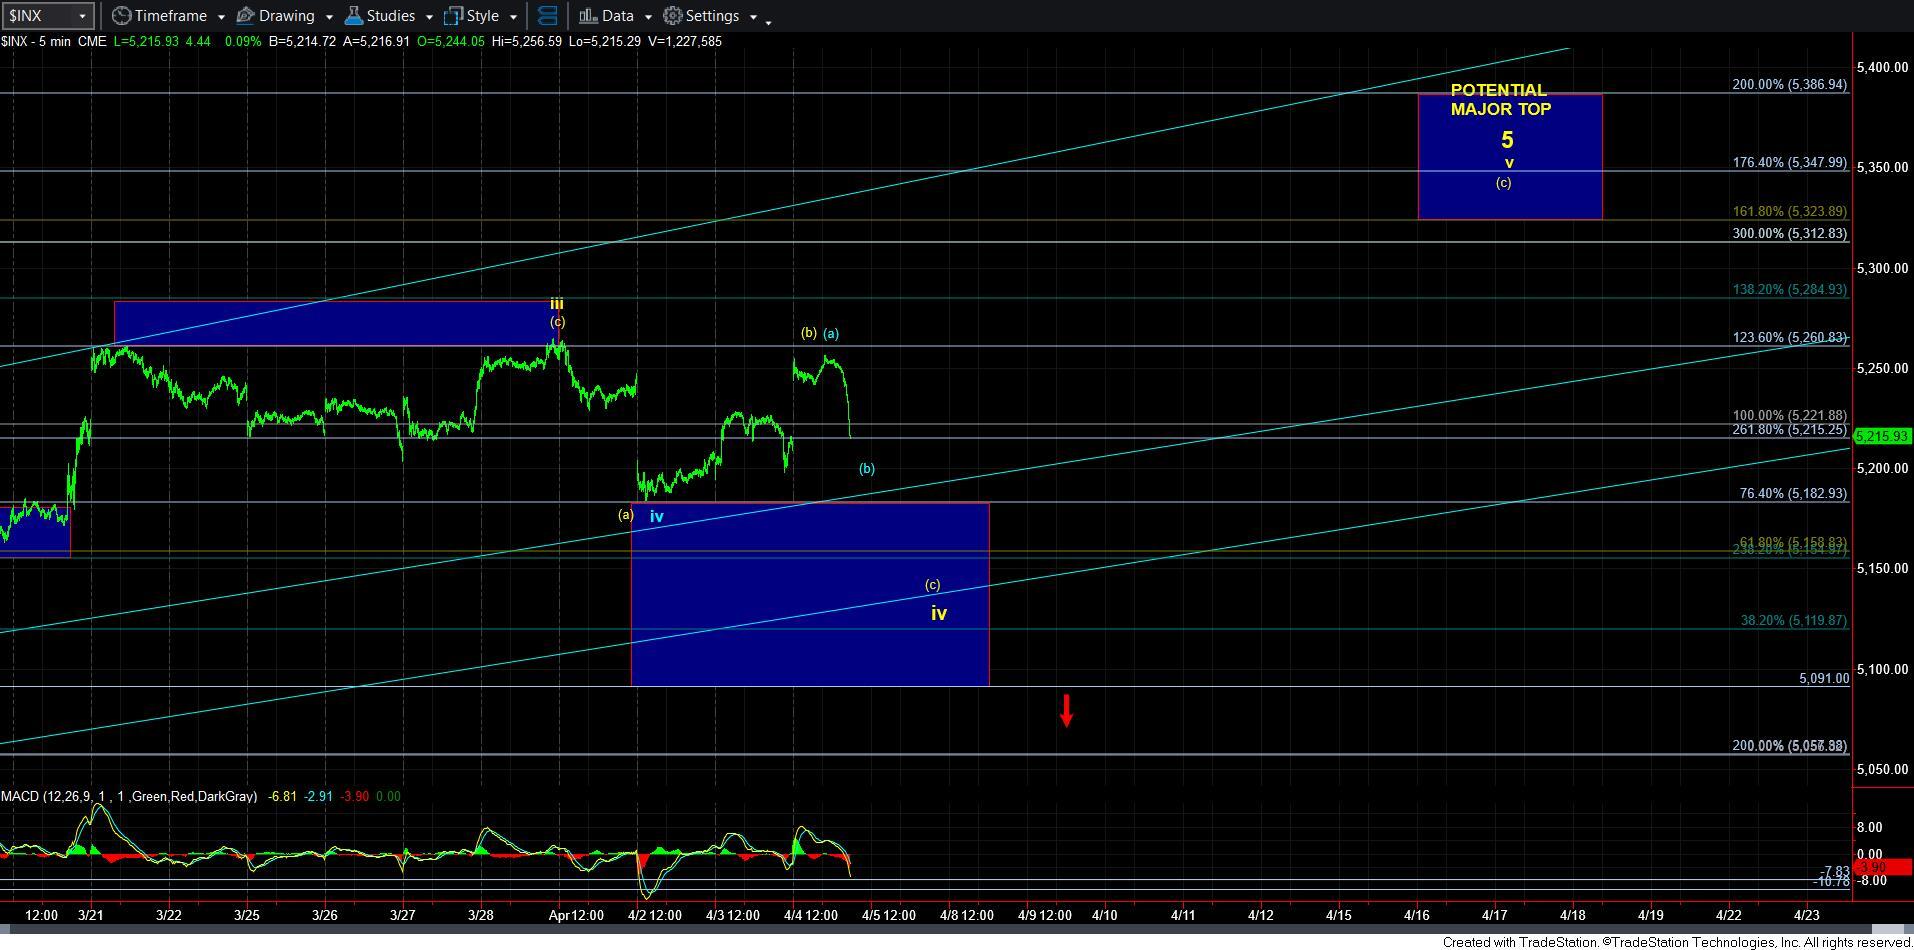
As I highlighted earlier this week, trying to distinguish this rally between the [a] wave of wave v of 5, which is pointing us north of 5300SPX, and the [b] wave of a more protracted wave iv will be almost impossible. You see, both structures are most commonly 3-waves in nature, which means they will look exactly alike.
And, in truth, I went back and forth today regarding which is my primary and which is my alternative. As I said a number of times, the standard expectation would be for a deeper wave iv in the diagonal structure, which would follow the yellow path now on the 5-minute chart. Earlier today, I was actually considering moving to the blue path, but I am again leaning towards the yellow path. But, I cannot say one is a much higher probability than the other right now. I am simply leaning towards the yellow as that is the typical structure we would normally see.
However, if we are able to take out today’s high, then I am going to move into the more direct path to 5300+ in the [c] wave of wave v of 5, especially if we hold the blue [b] wave pullback and begin a 5-wave rally off that low. That would signal wave 1 of the [c] wave to 5300+.
So, for now, as long as we remain below today’s high, pressure will remain down for a deeper wave iv. Should the market be able to exceed today’s high, especially in impulsive fashion, then I will be moving into the [c] wave of wave v as my primary count.
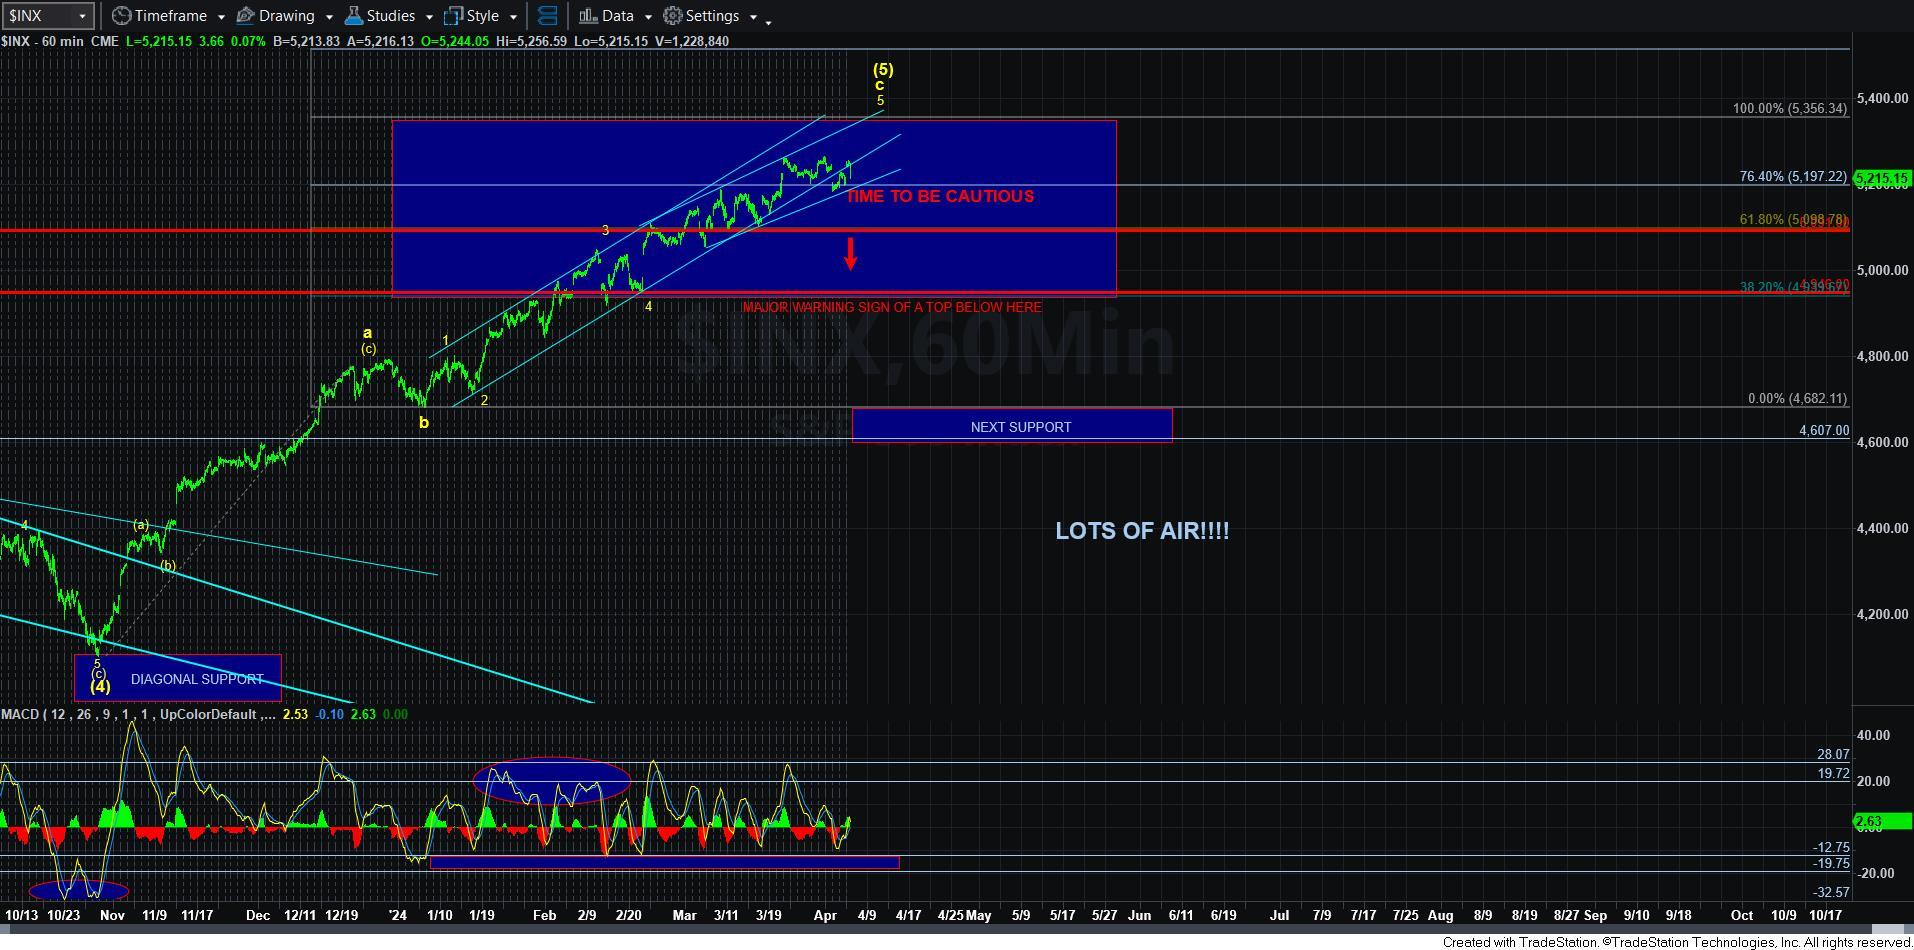
I am also going to reiterate that as long as we remain over 5091SPX, I am still going to expect another push higher to 5300+.And, clearly, a break down below that level would open the door to confirming a major top having potentially been struck.