Are We Heading Directly To New All-Time Highs?
 By
By
Today we saw the market open flat only to see a strong spike after the FMOC. As of the time of this writing, we are still near the highs of the day and in general have seen very few pullbacks since the low that was struck in October. So while the pattern remains quite full in this region leaving the market ready for a local top at any point in time until we actually see a break of support we still do not have any signal that we have put in a local top just yet. Furthermore, with this continued push higher, we are now at the point where we have to start drawing out upside pivots that would have this move directly to new all-time highs without seeing a pullback first. Now there are some issues with this moving directly to a new all time high without a pullback first but with this continued to push higher, we do have to at least allow for the possibility and prepare for it by laying out some pivots.
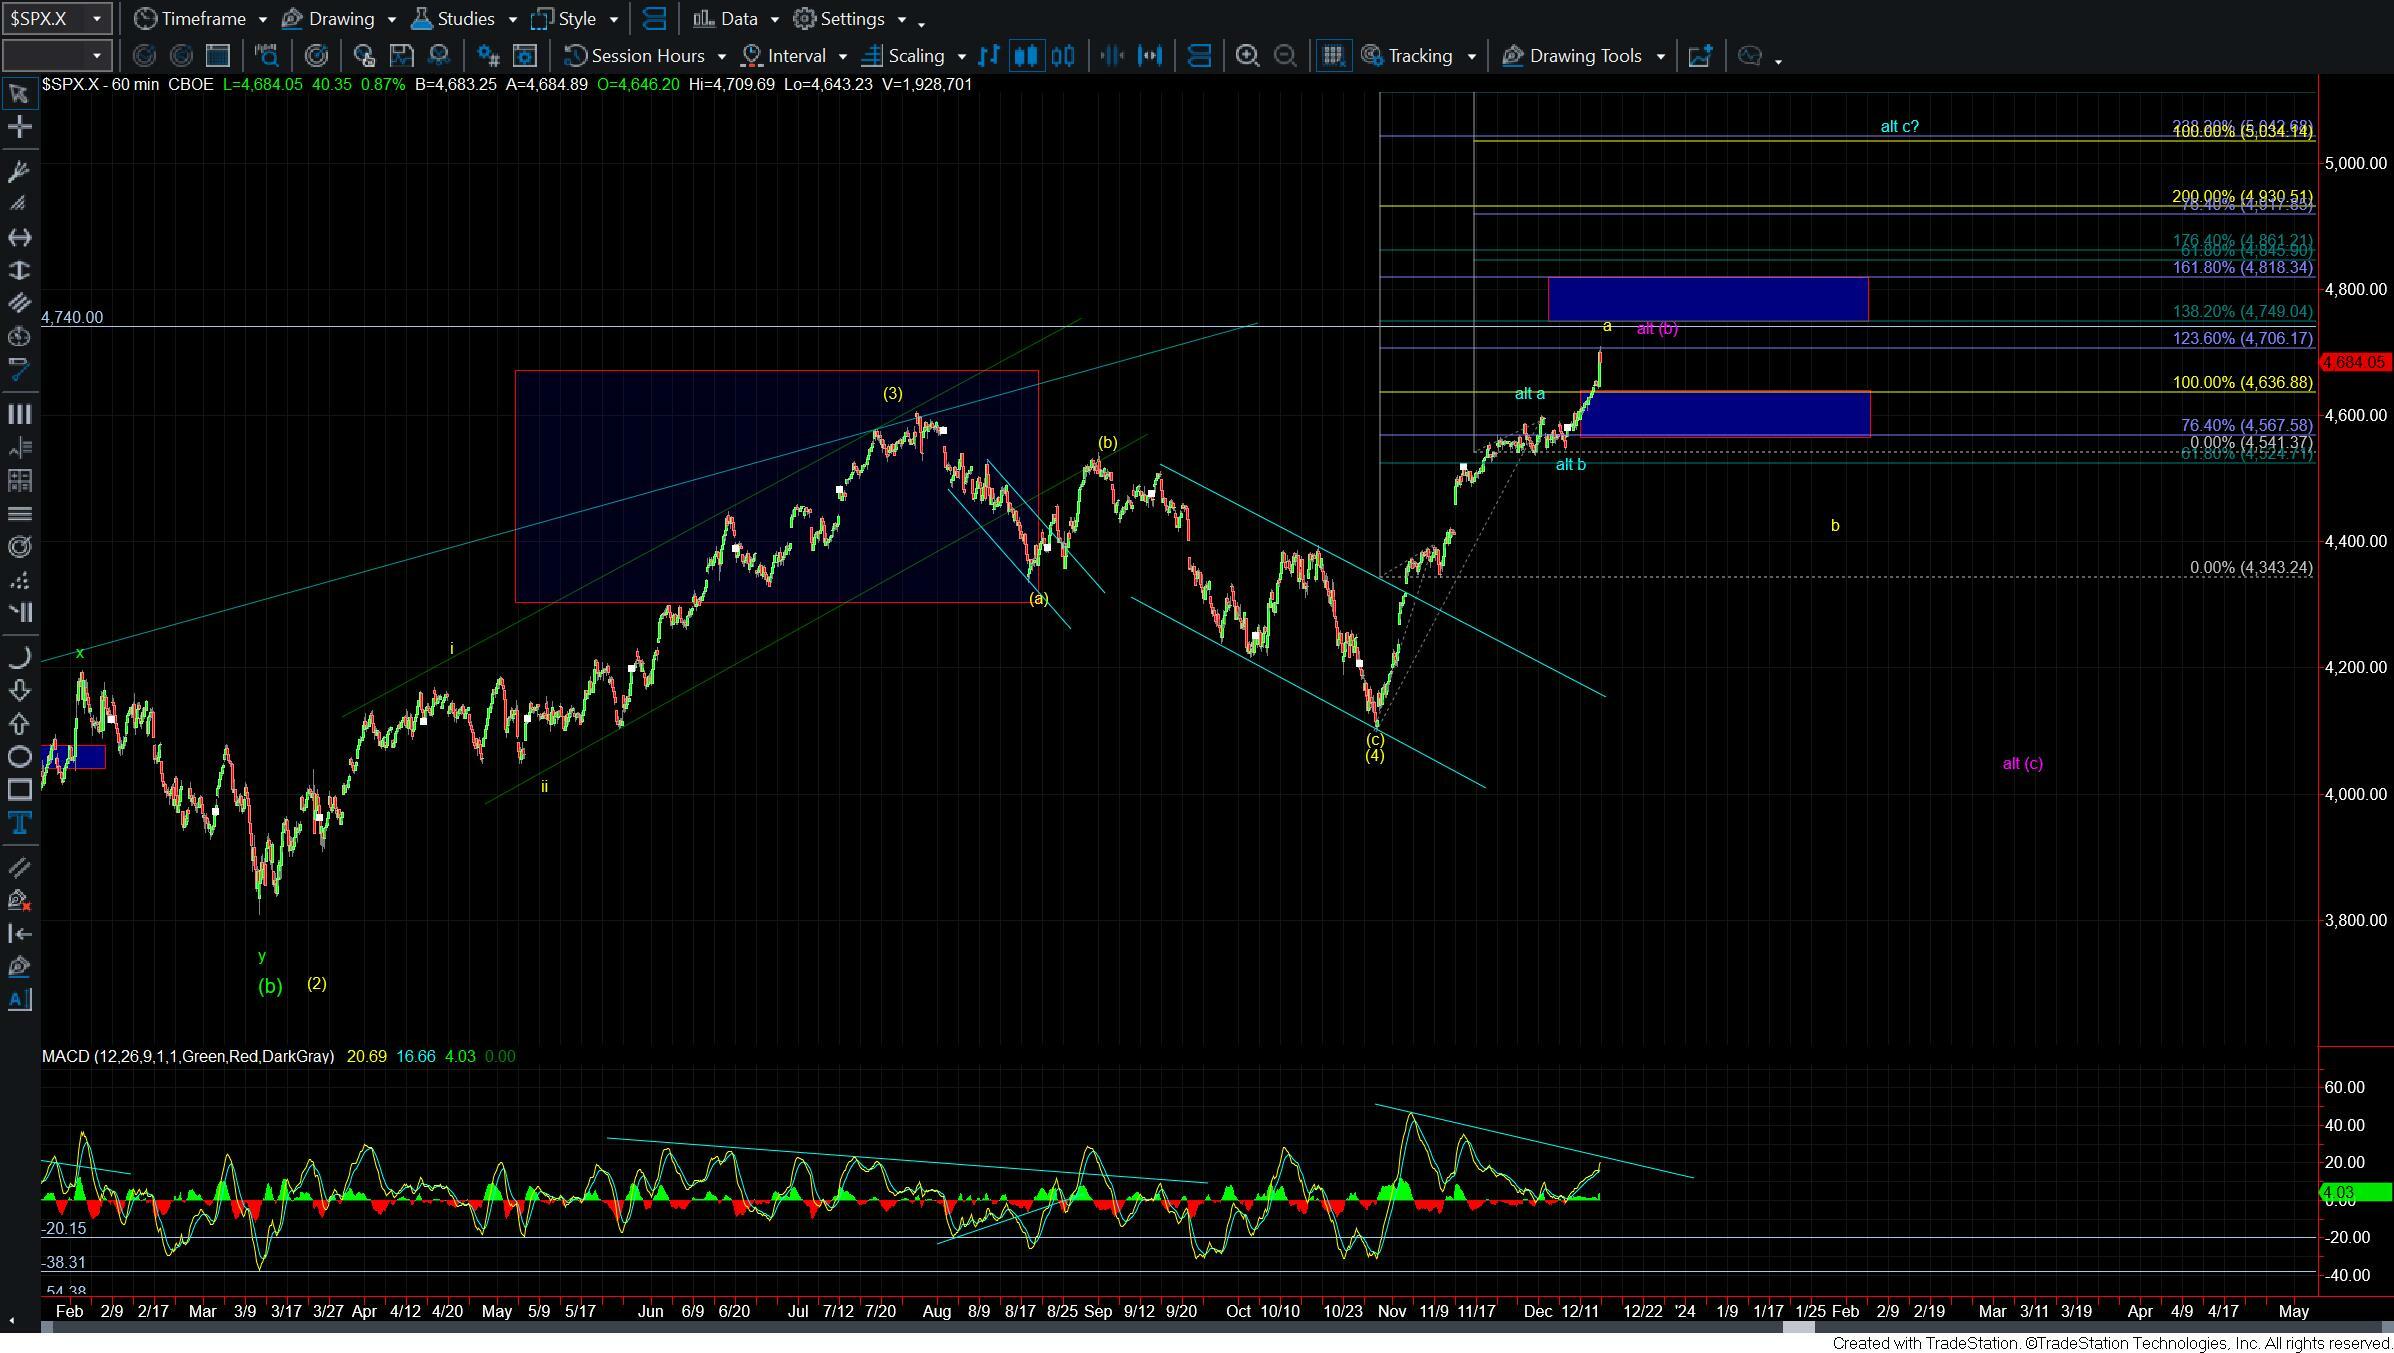
As it is likely that we are dealing with a large Ending Diagonal up off of the lows that were struck in October of 2022 the fact that the price action since that move is very difficult to track is not terribly surprising. In fact, this is to be expected as all of the sub waves within a diagonal are corrective in nature. This current move off of the October of 2023 low is no exception to this and has also been quite difficult to track as the pullbacks have been very shallow. Typically when we see a wave b pullback it will retrace to at least the 38.2% retrace level and more commonly the 50%-76.4% retrace level. In this case, the pullbacks have all been very shallow which is making it very difficult to get good fib guidance as to where we may see potential top in the wave a of the final fifth wave of this move.
We have been using the pullback on 11/9 as the b wave pullback and if that is indeed accurate then we are now approaching the 123.6 ext of the initial move up off of the lows. This is well within the range of a corrective move and even a move into the 138.2-161.8 is acceptable for a standard ABC. The 138.2 extension comes in at the 4749 level and the 161.8ext comes in at the 4818 level. If we begin to break out over the 4749 level at the 138.2 ext then it will make it more likely that we are following a more direct path to new all-time highs as laid out in the new blue count. Furthermore, under this blue path the 38.2ext of the wave a comes in right at the 4740 level. This allows us to use the 4740-4749 region as a bullish pivot that would potentially point us up toward the 5050 region in a more direct manner. As long as we hold under this pivot however the yellow count will remain the primary count and I will still continue to look toward a local top in the wave a.
As far as support is concerned we will need to see this break under the 4636-4567 region to give us an initial signal that we have indeed topped in the yellow wave a. Until that region is broken we still can continue to grind higher but keep in mind that this current move up off of the October lows is extremely stretched and we are now dealing with a potentially full pattern into these levels.
So while a move directly to new all-time highs cannot be ruled out as long as we remain under the 4740-4750 zone as noted above I will continue to look for the market to see a larger and more standard-sized pullback for the wave b before we see a continued break to new all-time highs.