Are We About To Melt-Up Again?
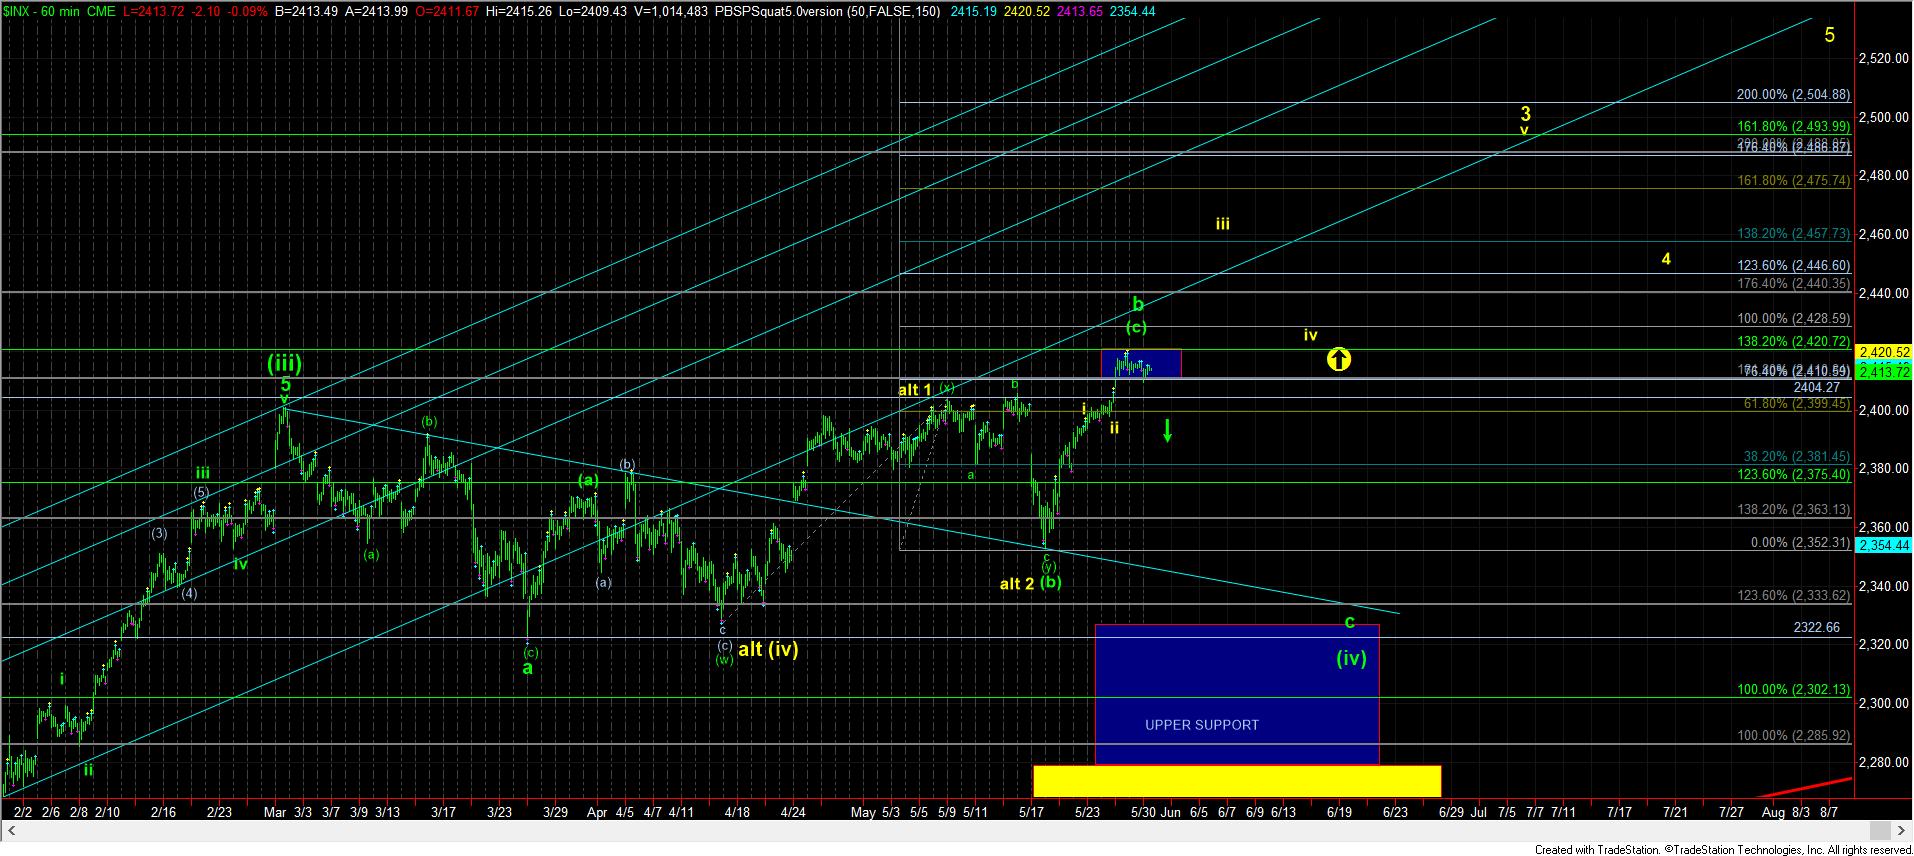
While the market continues to hover within our resistance region, we have no clear signs YET that the market is ready to drop into a c-wave towards 2330SPX.
As I have noted several times already, we will need to see a strong and sustained break of the 2400SPX region to open the trap door for a c-wave lower. But, if the market is able to break out strongly through the 2428SPX region, then we will likely see another melt-up phase in wave iii of 3 in this wave (v).
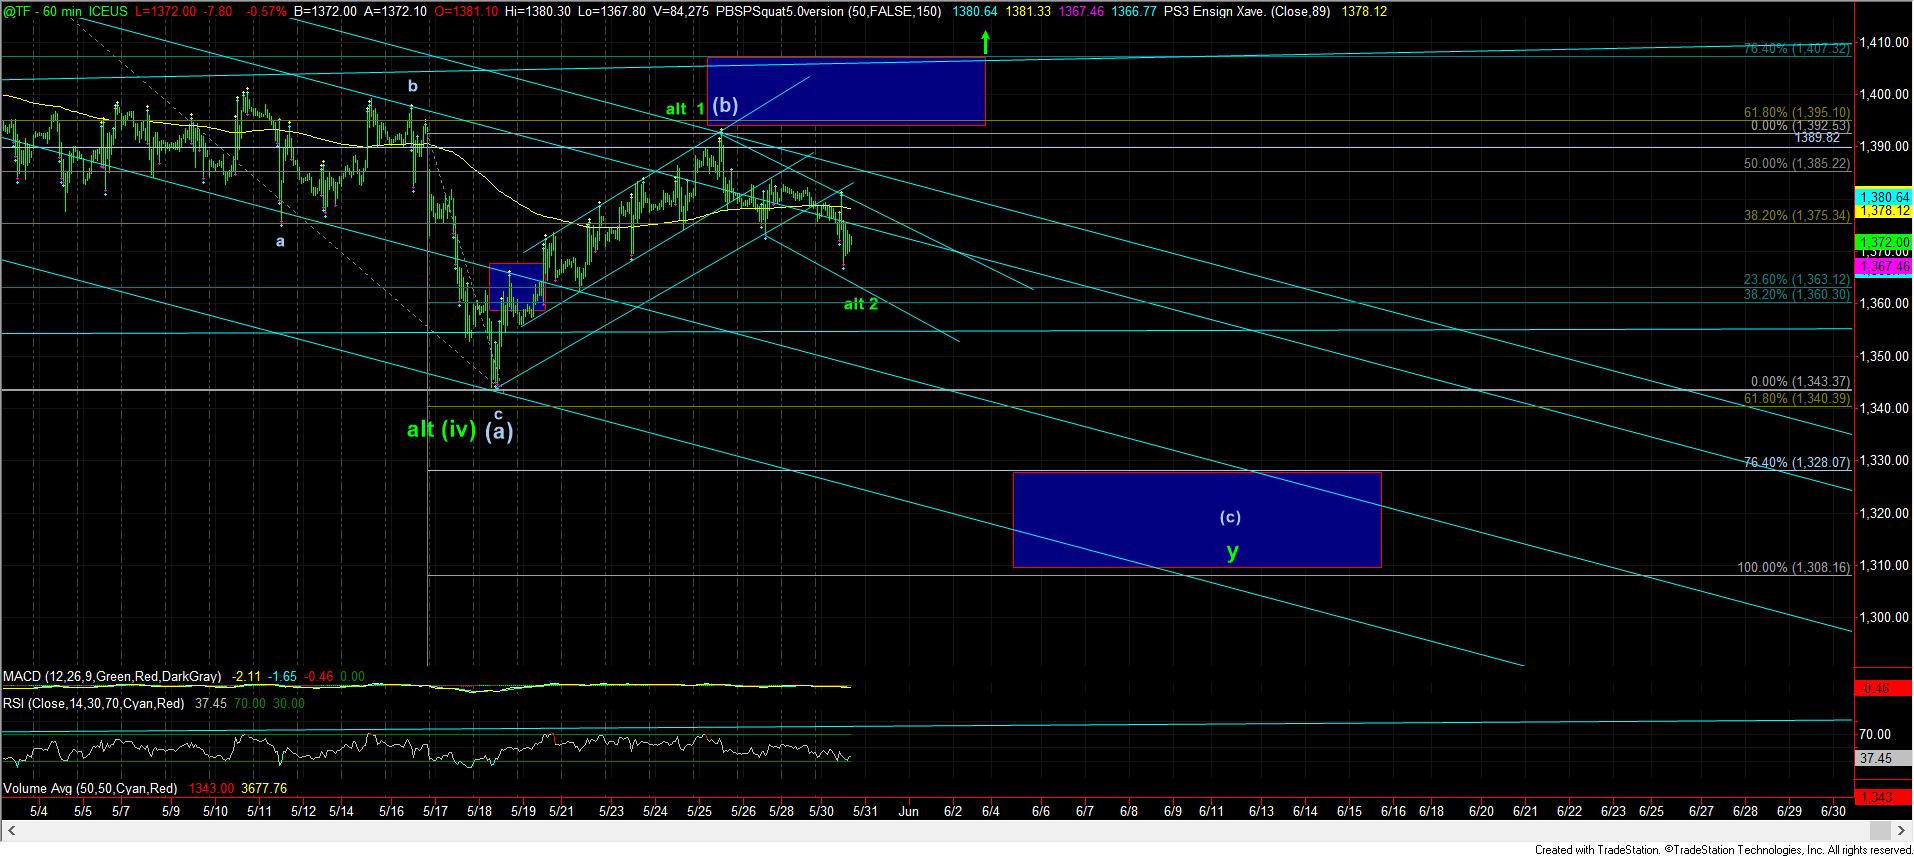
I also want to repost something I sent out as an Alert today about the TF/IWM:
So, with the overlapping downside seen thus far in the TF, it very well can suggest that wave (iv) could be completed already. If we are able to rally over the high made last week, then it would add to the evidence that wave (iv) did not reach its ideal downside target and wave (v) may be in progress.
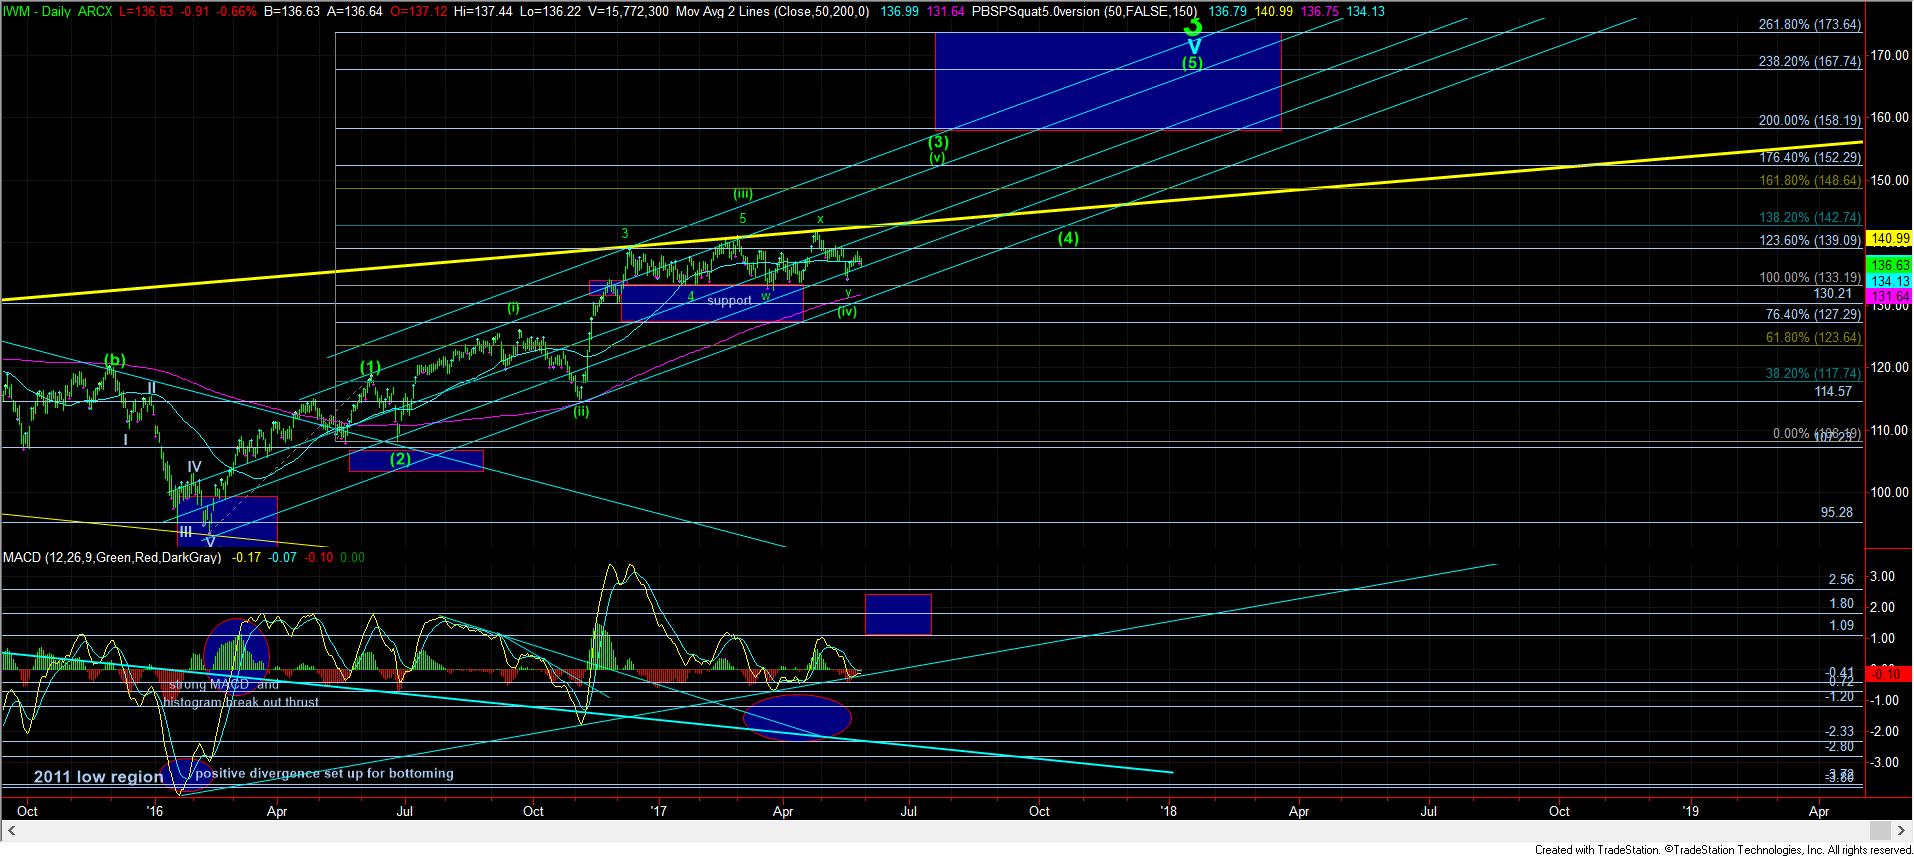
Since we often see relationships between waves (I) and (v) of equality, and wave (I) was approximately 18 points, it points us directly to the 152 target for wave (v), assuming wave (iv) is already completed. But, this would suggest that if wave (iv) is done, the IWM "should" outperform the SPX to the upside in the coming rally.
Therefore, just like the SPX, we have the minimal corrective pattern in place to consider wave (iv) as completed in the IWM as well, even though it did not reach the ideal target zone. But, if we see the SPX take out 2428SPX at the same time as the IWM takes out last week’s high, it can be a signal that a melt-up phase is in progress, wherein the IWM can potentially play catch up in this wave (v), and outperform the SPX on this phase of wave (v).
But, until we see such a break out, the pressure will remain down for a more protracted wave (iv) pullback potential. This would fill in a much more complete 4th wave pullback, and set up wave (v) to take hold into the summer.