Are The Markets Finally Ready For Some Downside Follow-Through
 By
By
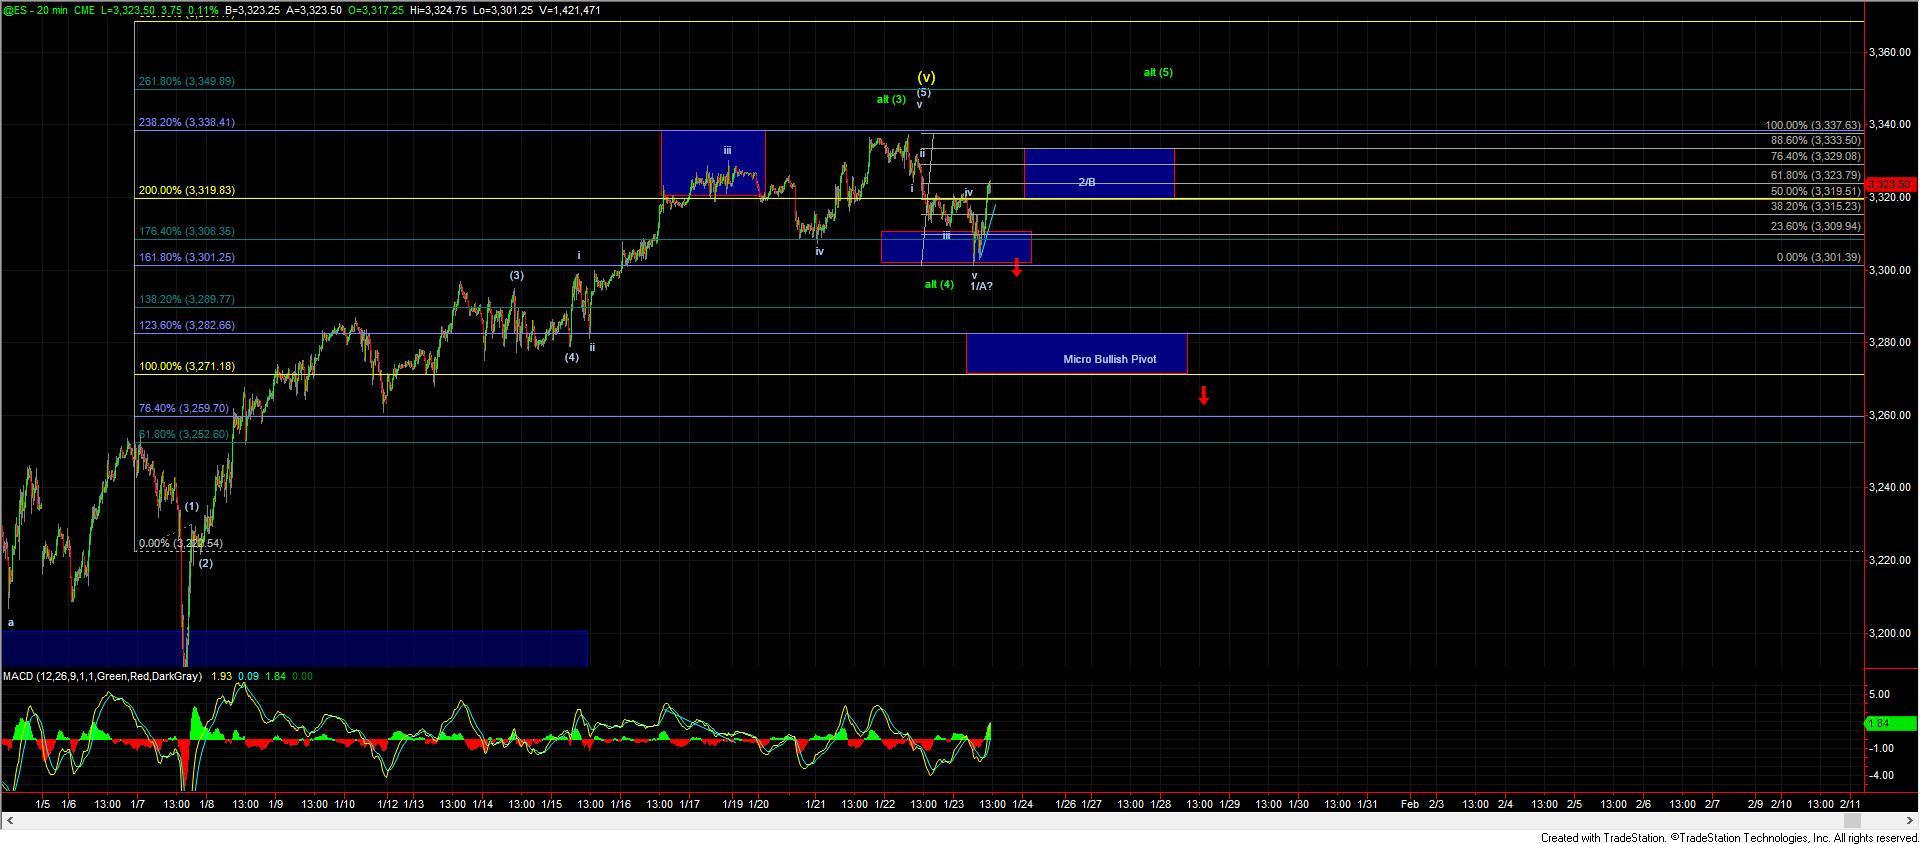
ES/SPX - After seeing a sharp drop overnight and into the early part of the session the equity markets have all formed intraday bottoms and bounced higher. At the open, the initial move down off of the high was counting as a nice five wave move on most of the futures charts which was giving us a nice signal that we would see additional downside action in at least the near term. Unfortunately, the ES continued to break directly lower which opened the door to the move down off of the highs being able to be counted as either a five-wave or three-wave move. Furthermore, we stopped and reversed right off of the bottom of the range of the upper support zone at the 3302 level.
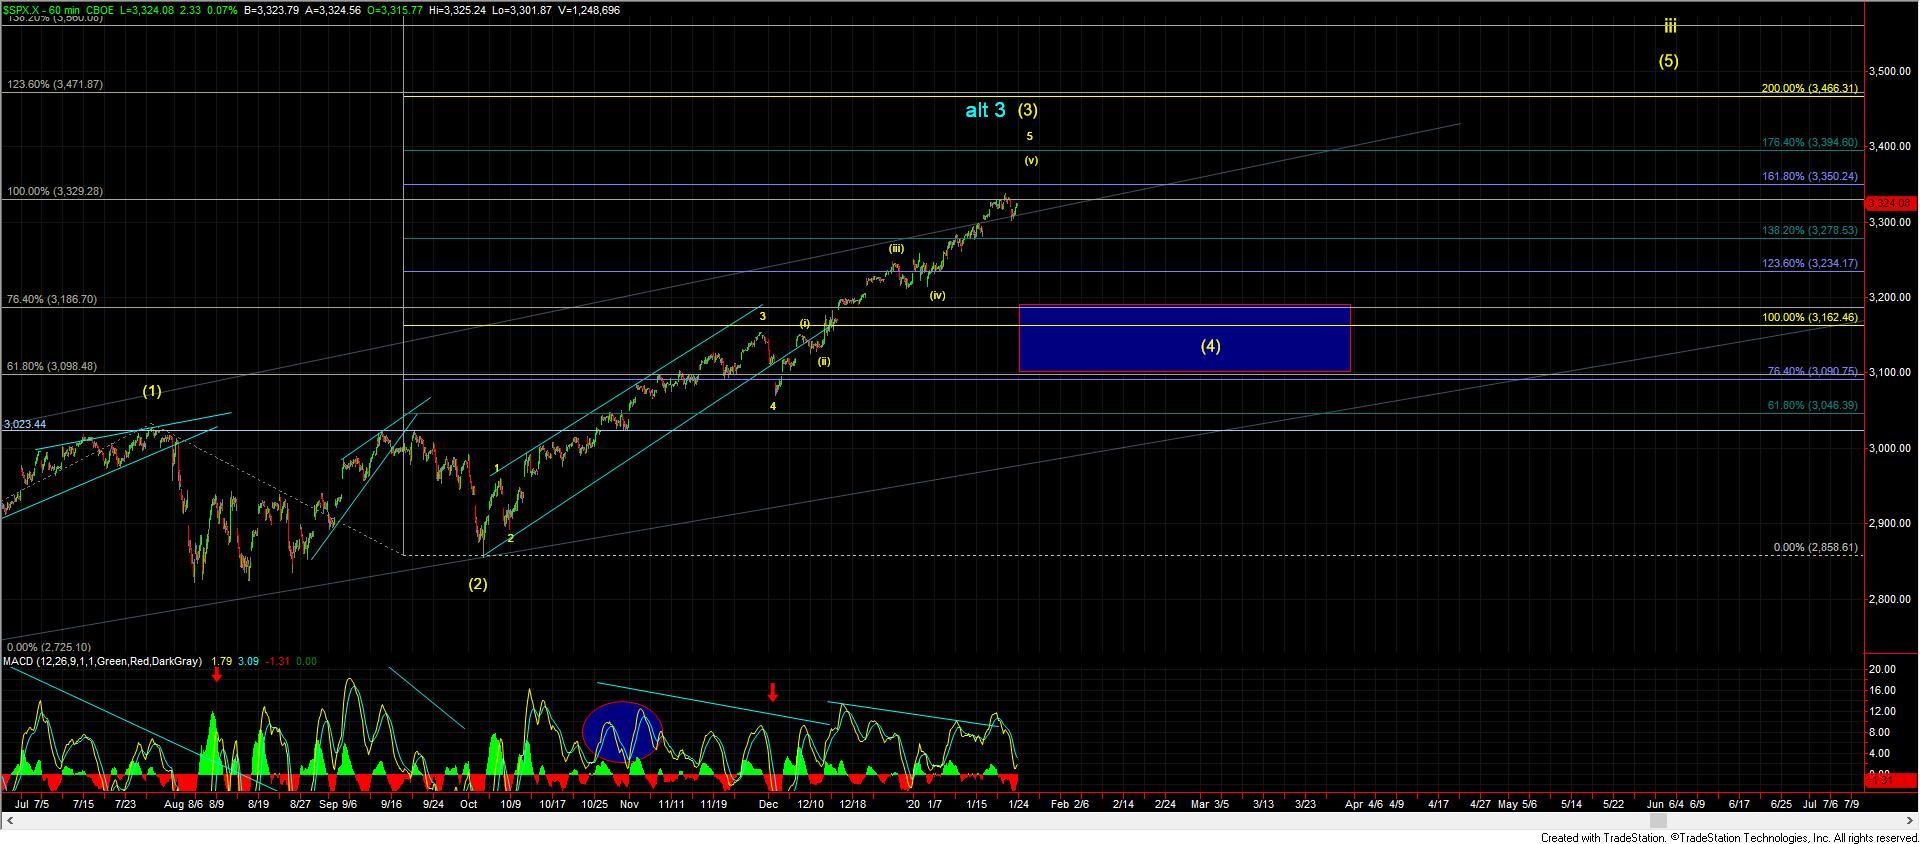
So with that, while I am leaning towards this indeed having formed at least a local top with the high at the 3338 level until we see a sustained break of some of the support levels below I still cannot rule out that this still sees another high as laid out by the green path on the 20min ES chart. Now, this would still be part of the larger degree topping yellow count but would simply require another high prior to finishing off that wave (v) of 5 of 3 as shown on the SPX 60m chart. If we do indeed breakout overhead then the next key fib I will be watching comes in at the 3349 level which as noted previously has multiple degrees of confluence on both the smaller and larger degree charts.
Downside support now resides at that 3302 level as I am still viewing this as a key micro pivot that should signal that we have struck at least a local top. Should we break that level I am then still keying in on the 3271 level below as this is still the 100 ext of one larger degree and I still view this as an important pivot below and a move through this level should help to confirm that we have topped in the larger degree wave (3) as shown on the 60 min chart in yellow.
Overall we are still following our fib pinball pattern on both the smaller and larger degree timeframes so this is still giving us good overhead fibs to watch as well as our support levels below making this for the most part fairly straightforward to analyze which I have tried to layout in the notes and charts attached.