Are The Bears Taking Control?
With today’s reversal just below our resistance noted the last two days, the market may be handing the bears a gift. The question now is if they can retain downside pressure.
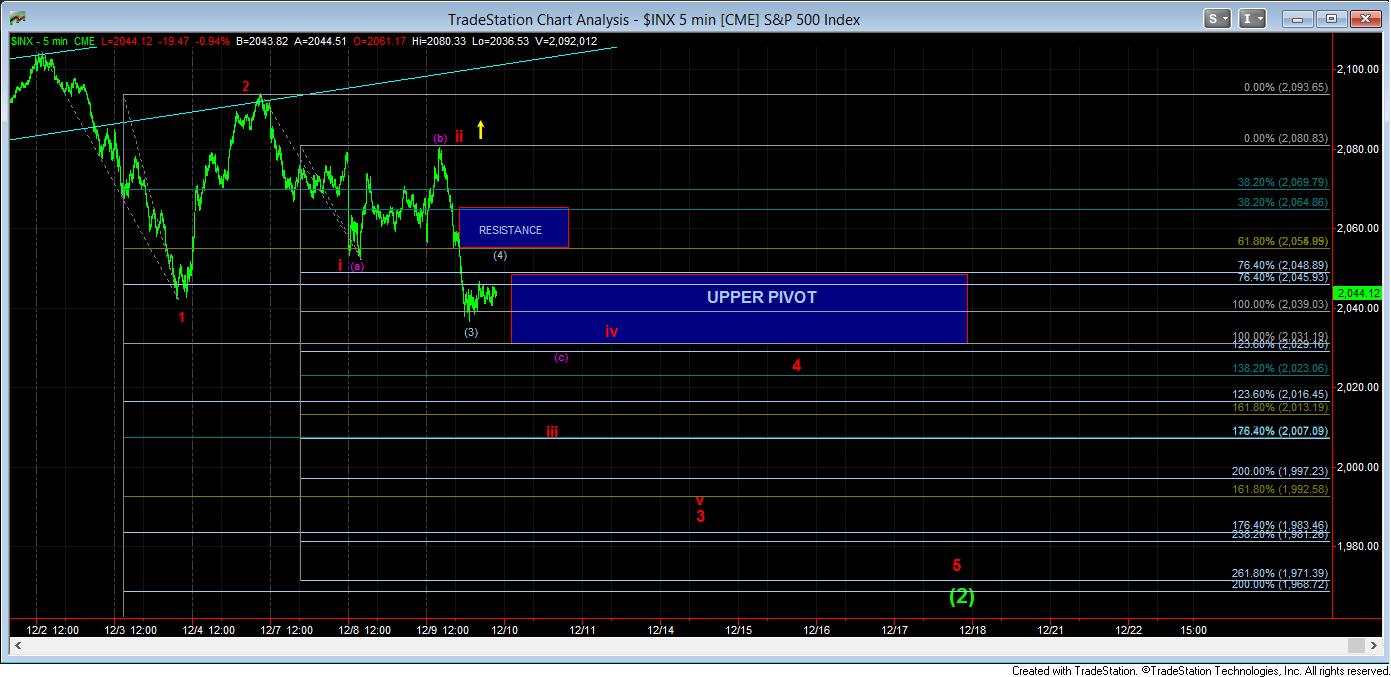
There are several ways to count this decline, and I am going to present both to you right now. First, as long as the market maintains below the resistance cited on our 5 minute chart, and ideally below 2055SPX, we should be heading down to test the next micro Fib support at 2031.
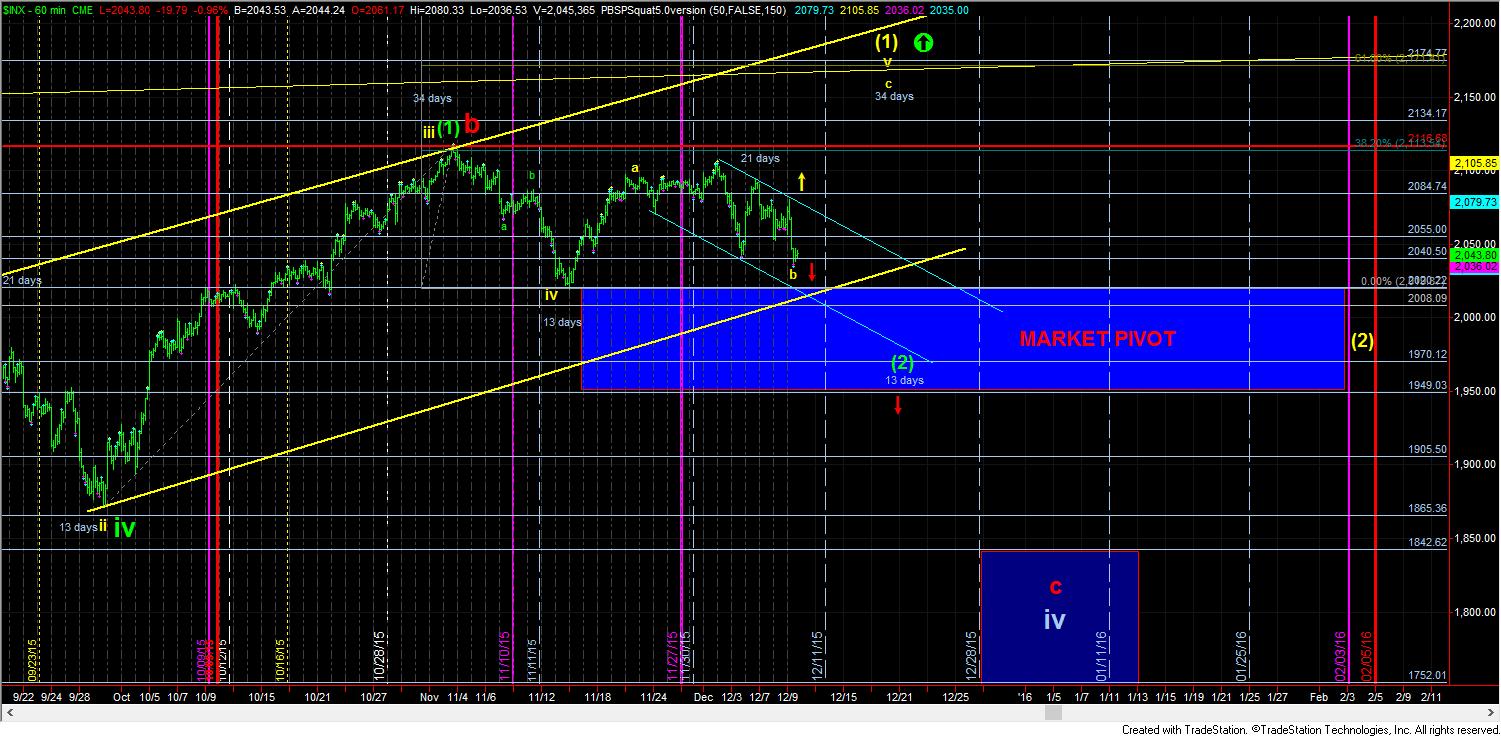
Please take note of the UPPER PIVOT region on the 5 minute chart, as the bottom of that region is the 2031SPX level. If the market breaks below that, and heads down in the red count, then until it is able to break back through the UPPER PIVOT, we are set up to drop down into the low to mid 1900’s, as you see on the 5 minute chart. Also, take note that this is the lower end of the bigger Market Pivot zone on our 60 minute chart. This would count the pullback as a wave (2) in green, as long as the pivot is not broken.
So, as long as the market maintains below 2055SPX, I am looking for a test of 2031SPX next. IF it breaks, then we will follow the red count, until the market action tells us not to do so. If we hold 2031SPX, or some other action breaks the red count, then we can still head lower, but it may be in more of an ending diagonal fashion, which brings back much more whipsaw.
So, yes, the plot thickens. And, only when I can count a solid larger degree 5 waves up from a support region, followed by a corrective pullback, and then a take out of the high of the initial 5 waves up, I will continue to follow the market down. But, once that bullish signal is given, then I will turn bullish, and will be looking for a major rally into 2016. Until the market breaks through a resistance, we have to follow her down for now.