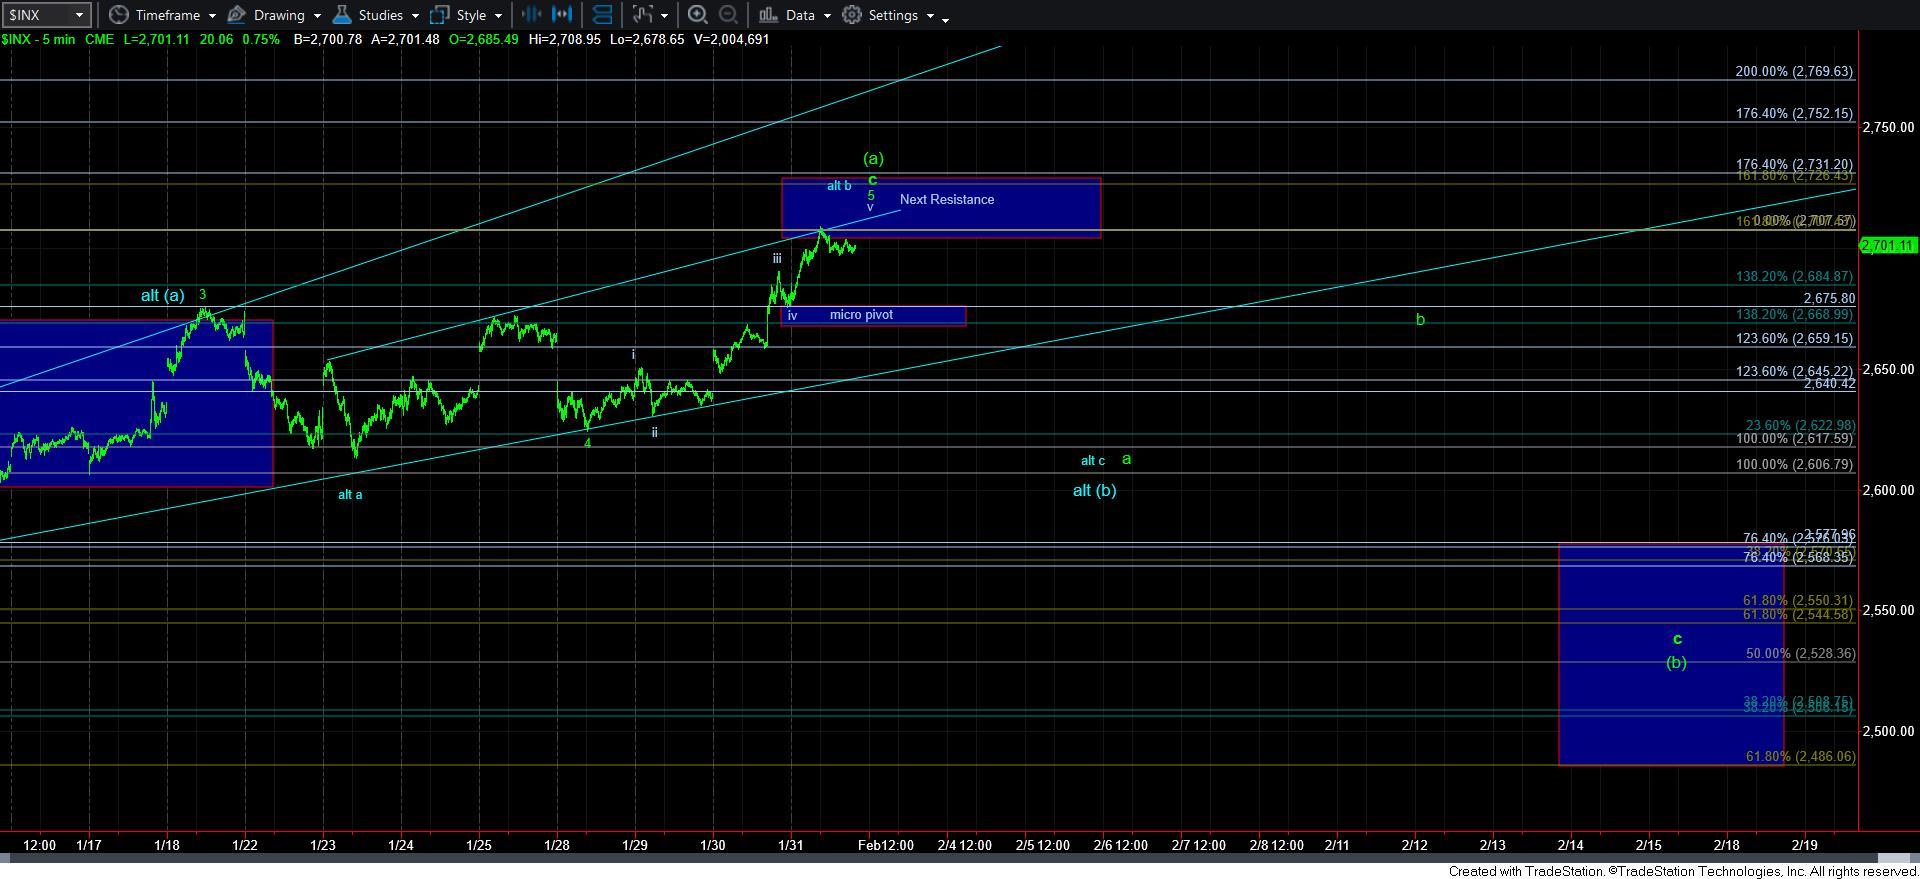
Approaching Next Resistance Region
As highlighted in last evenings update, the next target region was between 2705-2730SPX. And, today, we reached that target. While the market can still see one more micro push higher to complete another 5 wave structure in the most recent rally, I have to assume this will FINALLY put a cap to this very extended [a] wave.
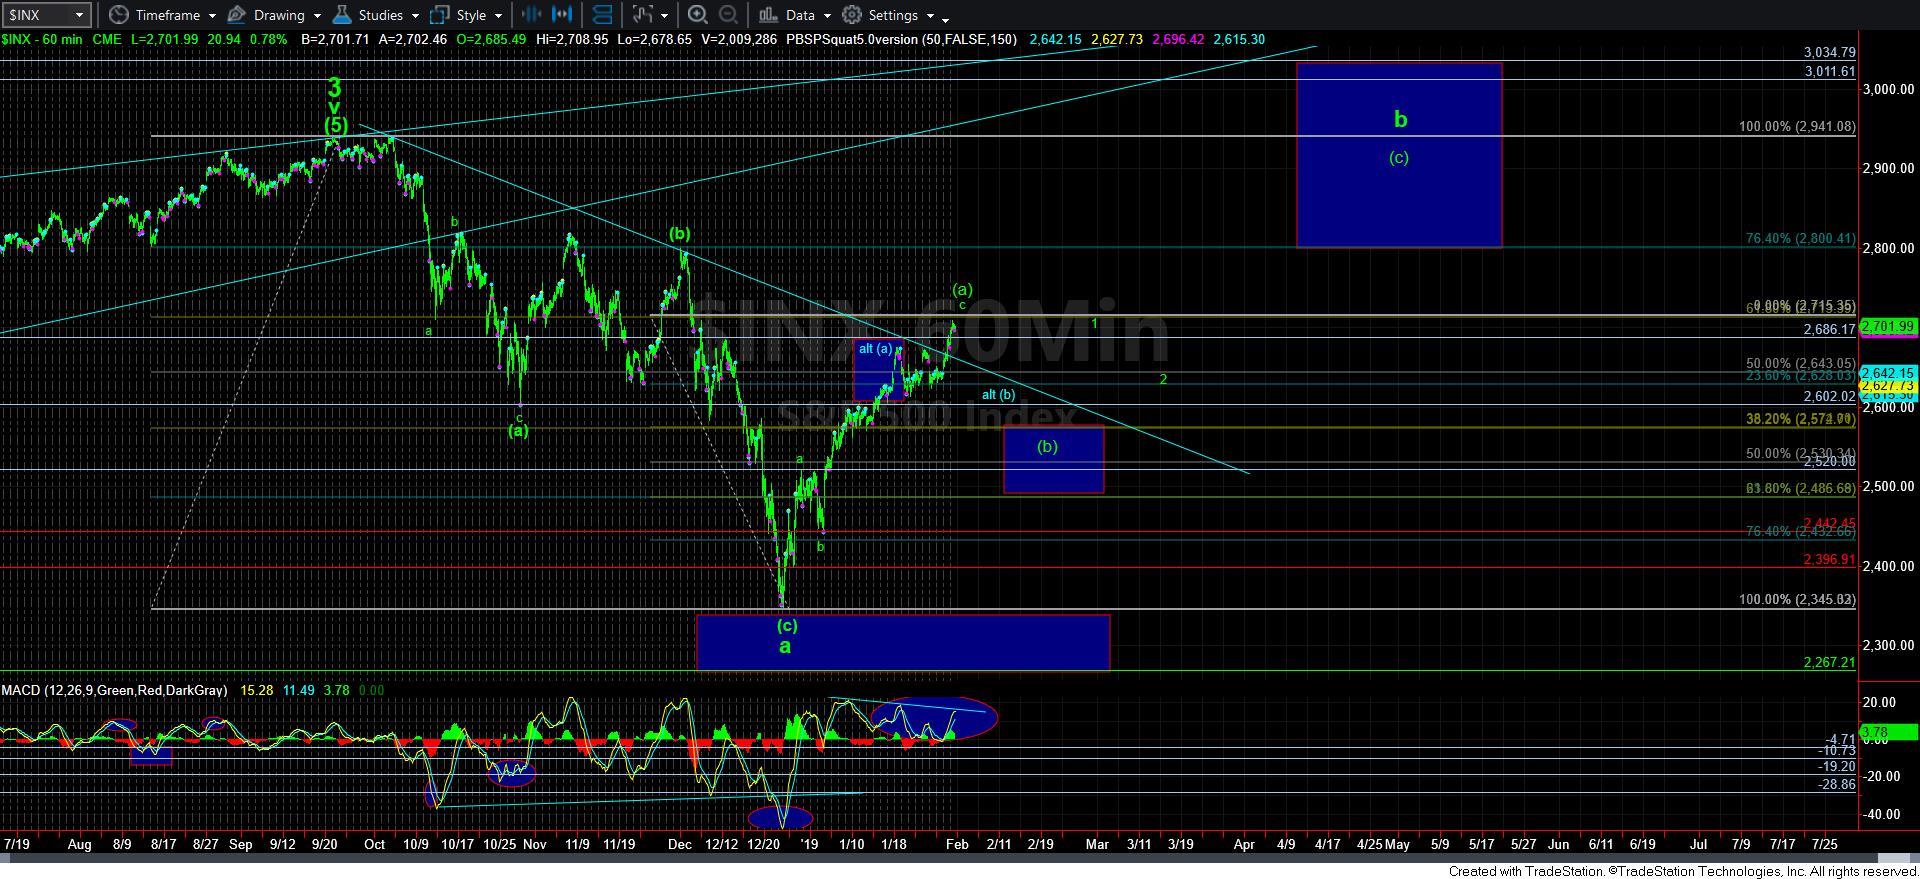
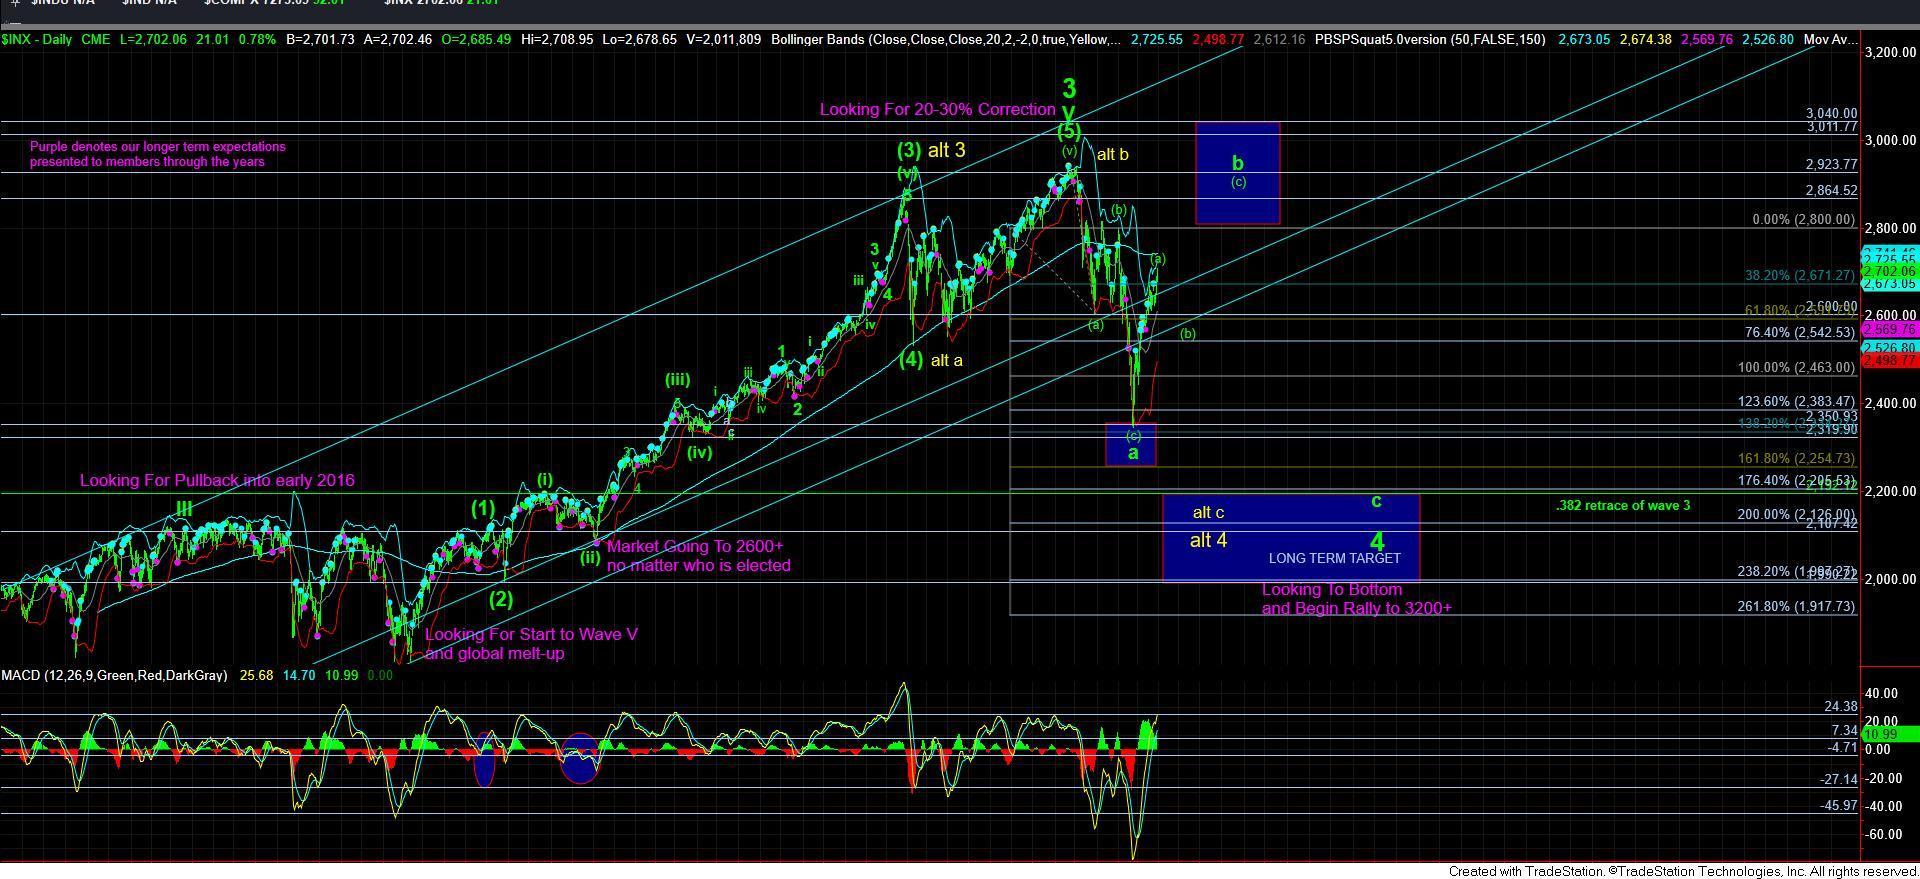
As I have highlighted as well, the SPX is approaching its .618 retracement of the decline off the all-time highs, and the IWM has approached its .500 retracement. But, as I have also been highlighting for months, I think the market will likely target a minimum of the 2800SPX region before this bigger b-wave completes, with the potential we can even hit new all-time highs in the 3011-3040 region. And, again, for those following our work since the fall of 2011, this should all sound very familiar, as we have expected a large b-wave rally for this correction.
In the micro count, I have added an alternative (in blue) which provides for this rally being an expanded b-wave high, within a [b] wave pullback. There are a number of reasons I am considering this potential as an alternative for now. Moreover, MikeG pointed out to me that the VXXB would count quite well with this potential as well.
So, should the market drop from this region in 5-waves (as c-waves are most often 5-wave structures, whereas it is much more rare to see an a-wave as a 5-wave structure), I would have to strongly consider that alternative count, and even look to buy a long position for a rally to the 2900 region. Of course, I may get stopped out of that position if the rally thereafter is actually the green b-wave rally noted on the 5-miunute SPX chart, which will then point us down below 2600 in the c-wave of the [b] wave.
Currently, upper support now resides between 2665-2675SPX, which must be broken to suggest that the next decline phase is taking hold. And, the manner in which we drop below that support (5-wave structure or 3-wave structure) will be instructive as to how high a likelihood the blue count may be.
In summary, I still have to expect a [b] wave structure to be evident on the chart, as nothing suggests it has completed just yet. And, I still am going to expect levels of 2800+ to be struck before this larger degree b-wave completes over the coming months.