Approaching 3.618 - Market Analysis for May 14th, 2026
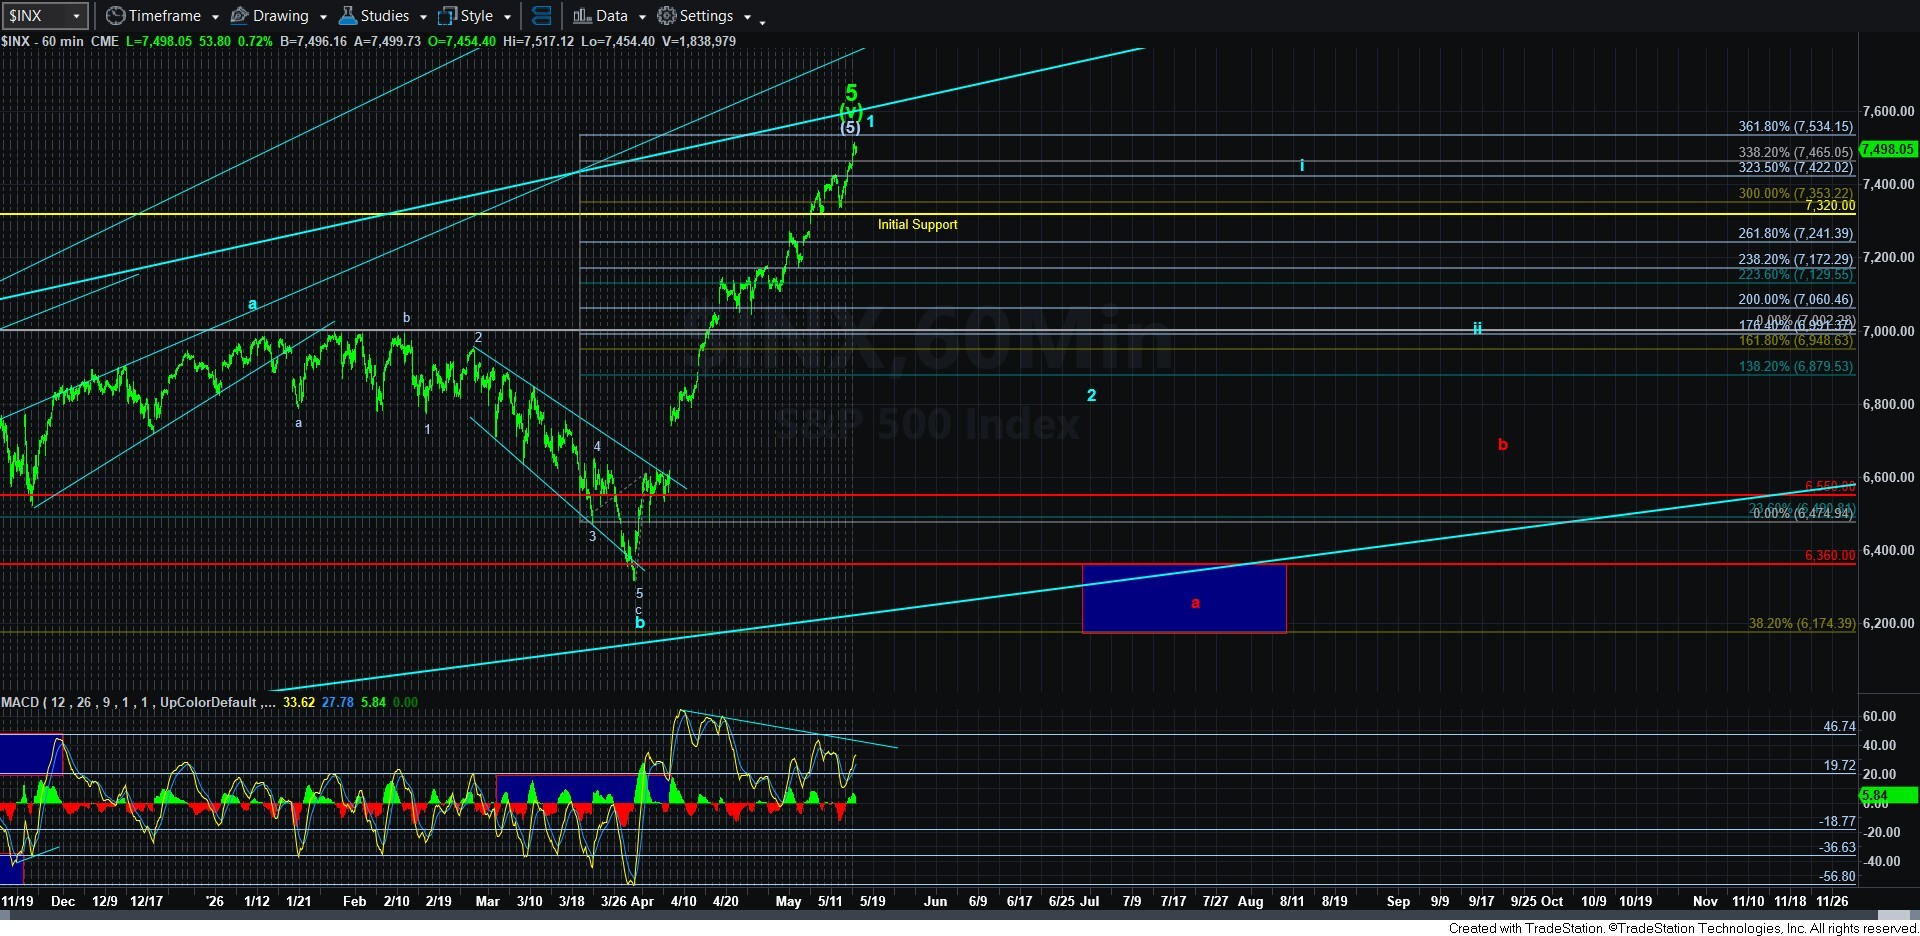
As I noted in my earlier update, the SPX is now approaching the 3.618 extension of waves i-ii off the end of March low. And, yes, this is extreme. But, there is still no clear indication that a top has been struck. Minimally, we would need to see a strong break down below 7320SPX to suggest that the blue wave 2 or the red a-wave is in progress.
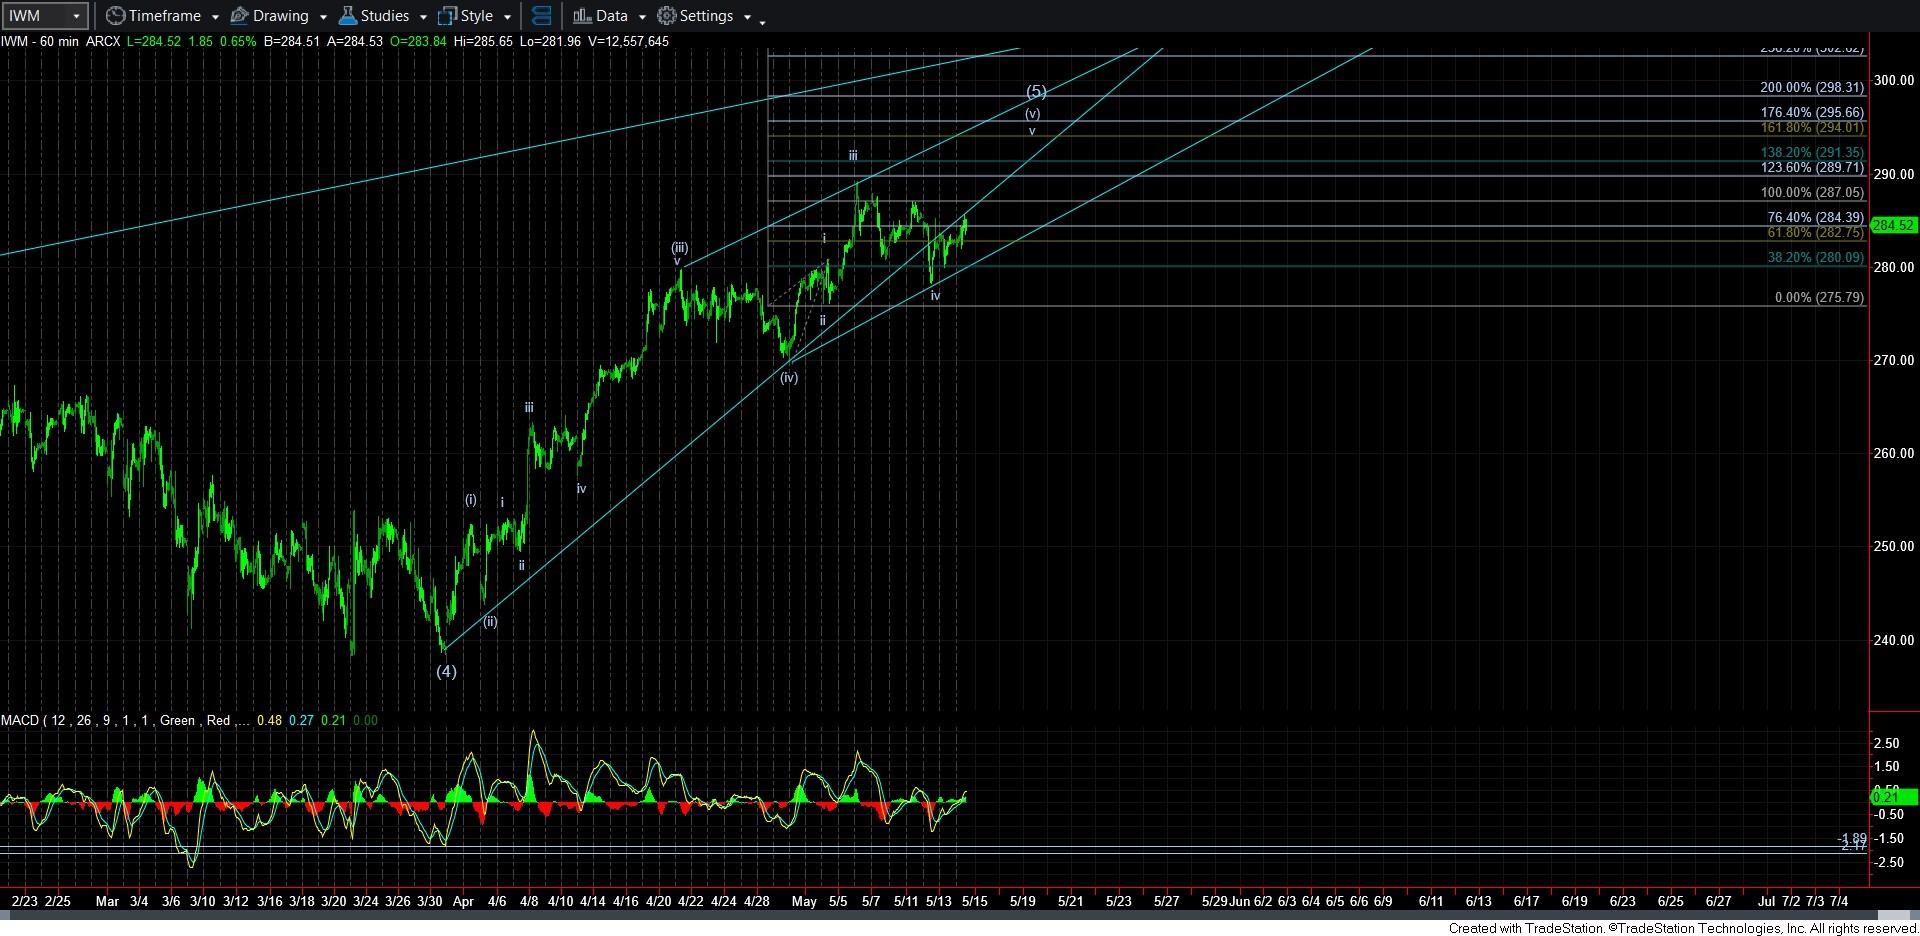
In the meantime, I have noted over the last week that the IWM may still be attempting to complete an ending diagonal, as outlined on the 60-minute IWM chart. However, admittedly, this diagonal is a bit wonky with the size of wave iv being relatively large. Yet, until that support is broken, I said I would give it the room to attempt a move to the 294 region to complete that diagonal.
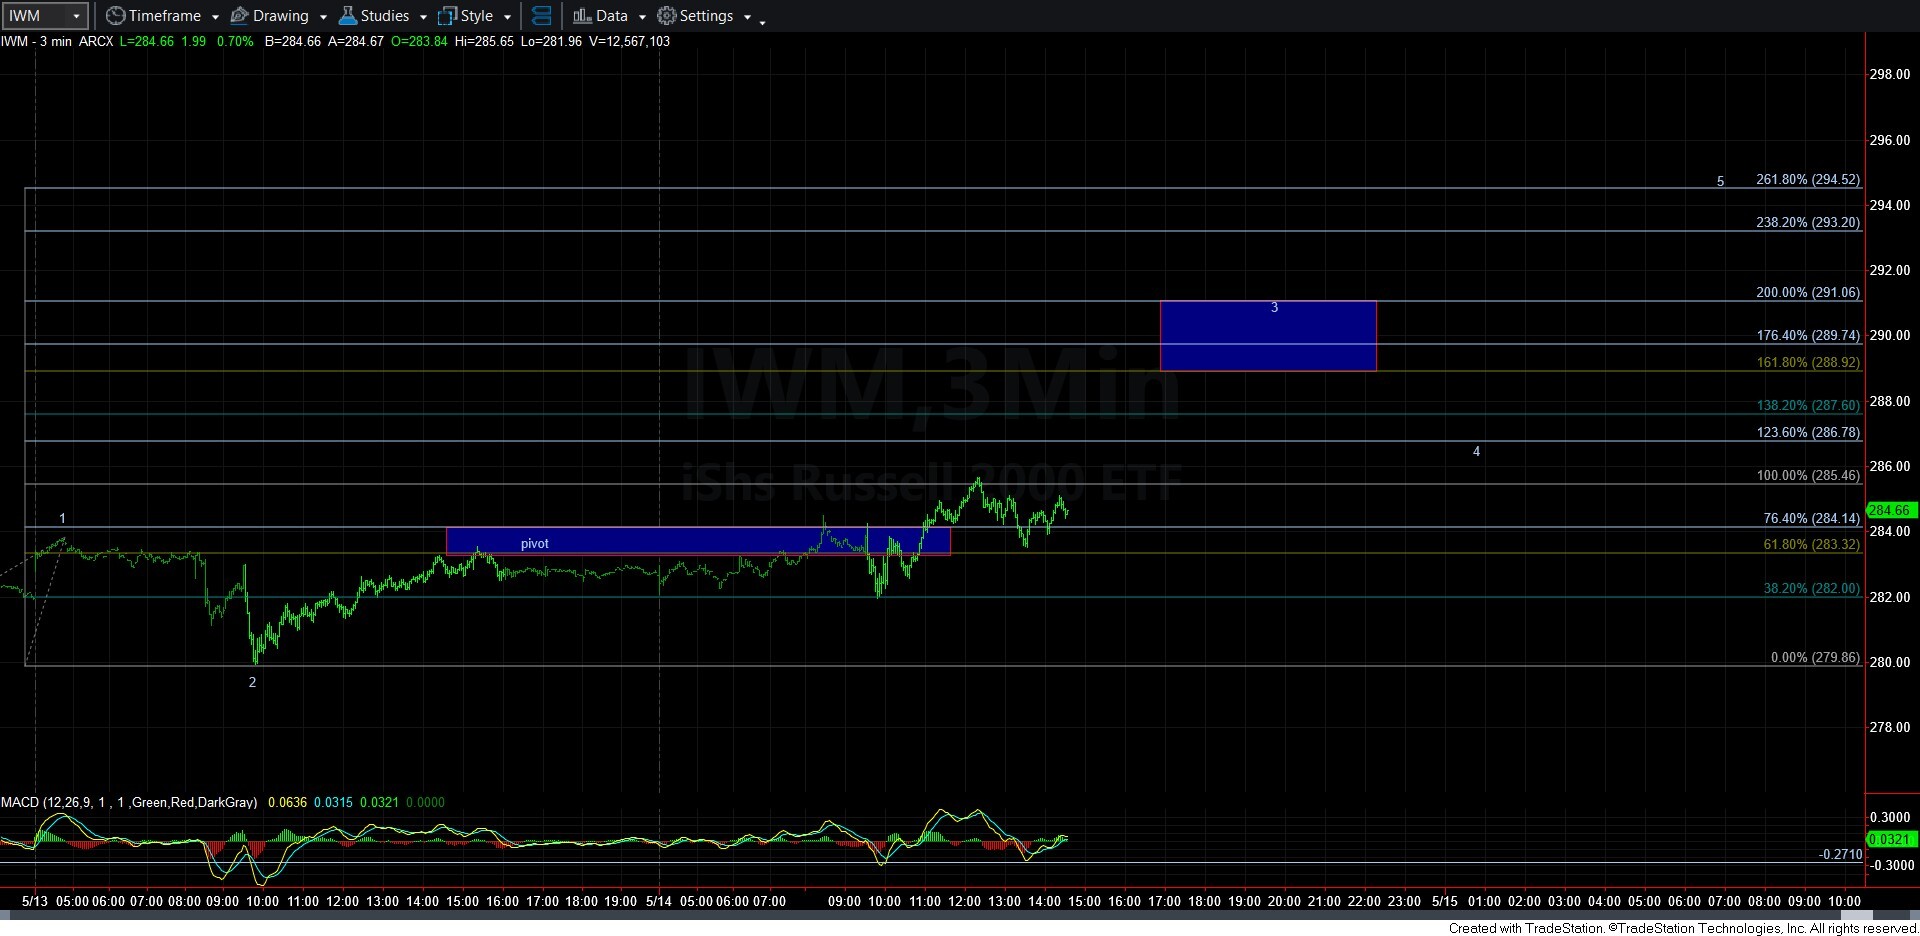
As it stands right now, 282 is the support I would really like to see hold and provide us with a break out to the upside tomorrow in furtherance of wave 3 in the c-wave of wave v. Yesterday afternoon I provided a 3-minute chart on IWM with this potential set up, and the market came up to the 1.00 extension on the chart and turned down. If we can gap up over it tomorrow, then we will likely be on our way to completing wave 3 of that c-wave in wave v.
However, should the market turn lower instead, and break below 282, with follow through below the wave iv low, then that would likely mean a top is in place for this rally, and I would expect the SPX to follow through as well below 7320SPX, and potentially quite fast. Remember, when parabolas end, the reversal is usually quite strong.