Almost Giving Up On More Of A Pullback
To say that the market has been stingy on pullbacks since we hit the bottom to wave [ii] on December 20th is a real understatement. While the market has hit all our upside targets through the Fibonacci Pinball structure off that low, it has not provided us with standard pullbacks during this rally. And, we may see that once more.
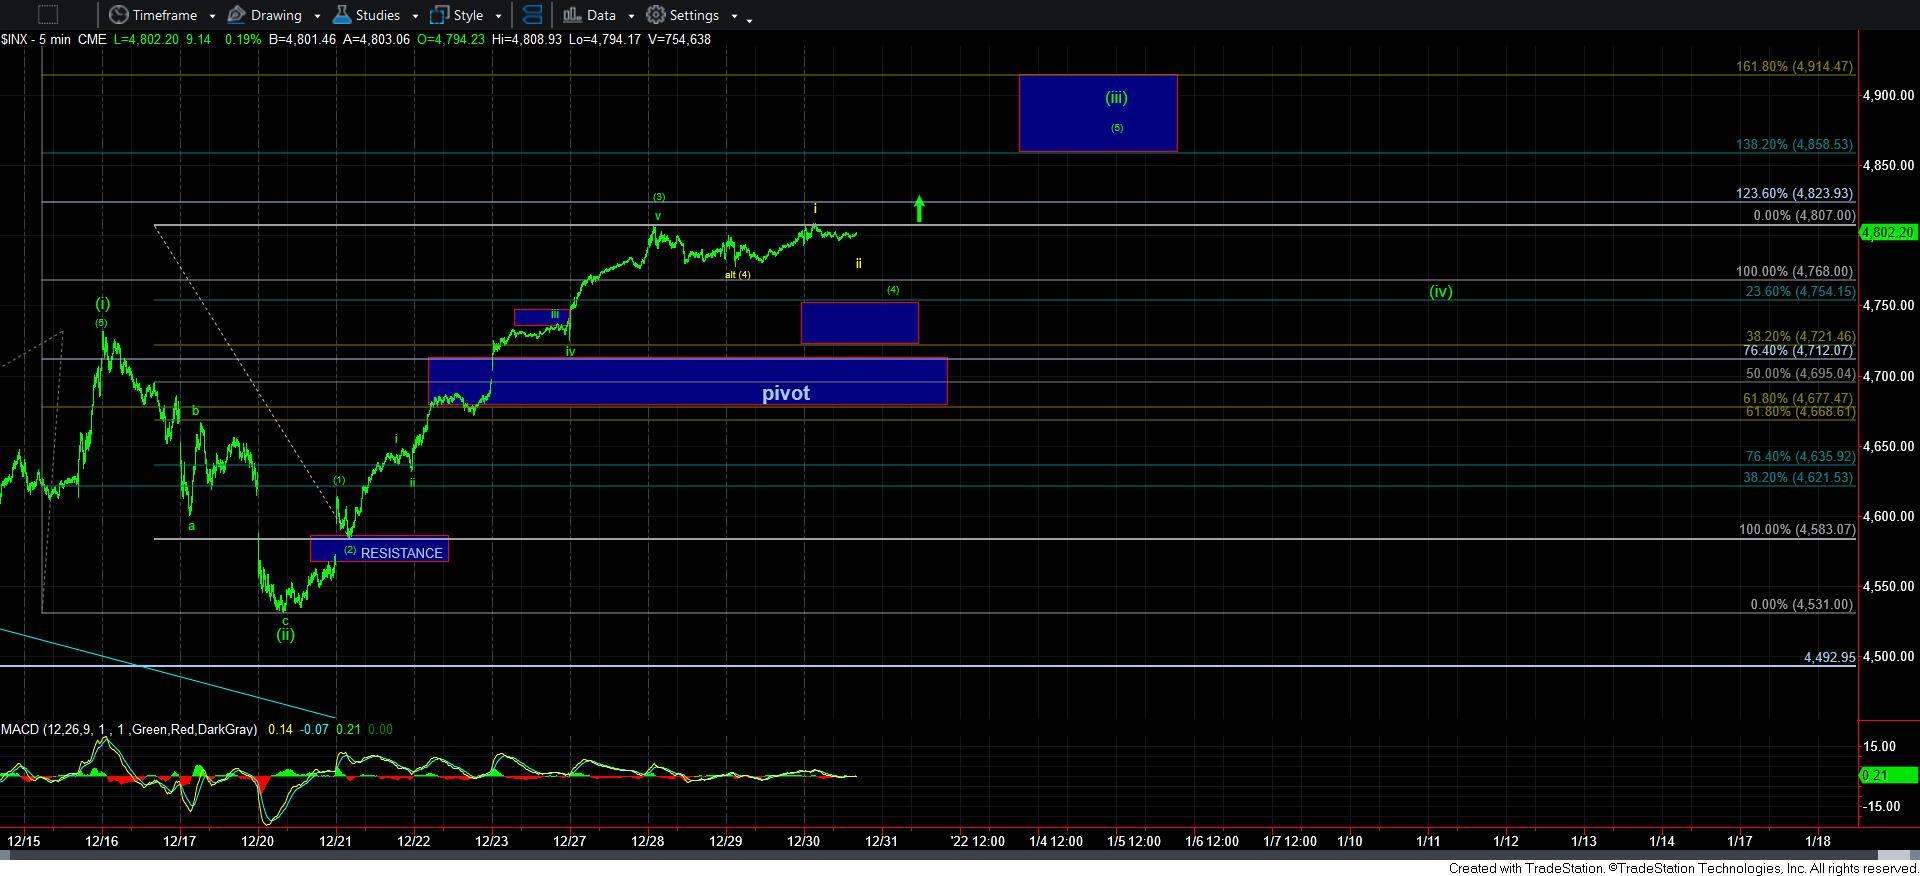
As it stands right now, as long as we remain below today’s high, I can at least retain some reasonable expectation for more of a wave [4] pullback, as shown by the 5-minute SPX chart in the green count.
However, if the market breaks back over today’s high, then I have to begin viewing wave [4] as already completed, as shown in yellow on the 5-minute chart. I will then be looking up towards our next higher blue box target on the 5-minute chart.
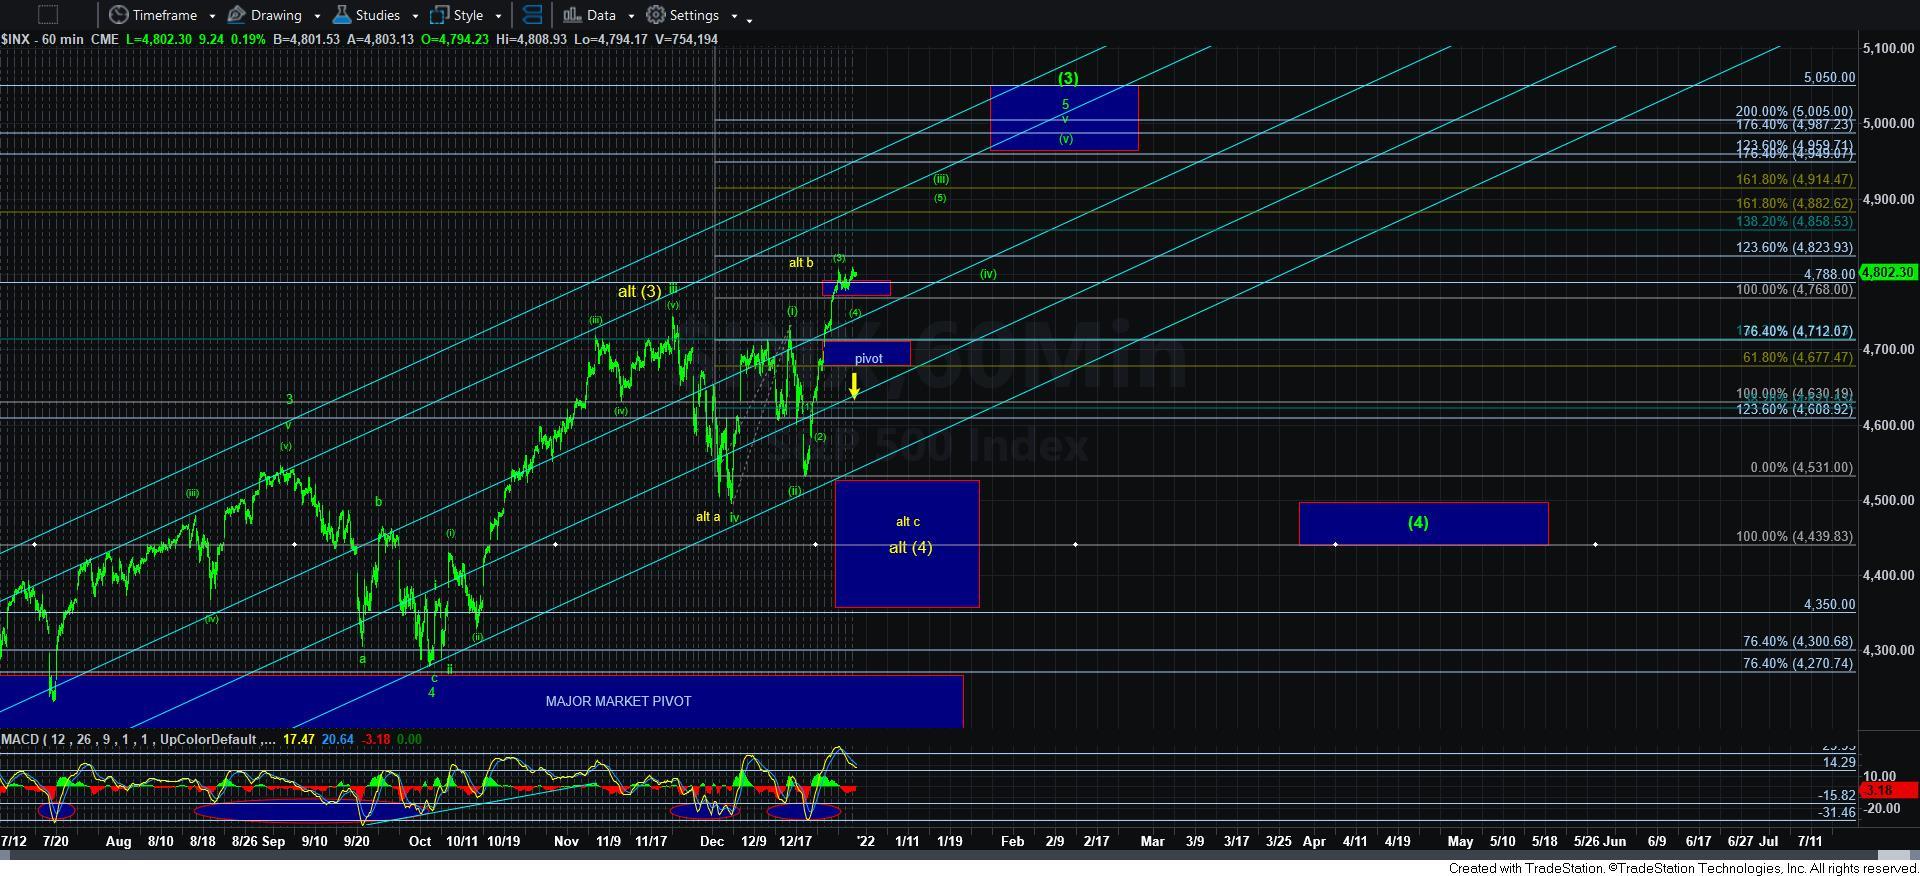
I want to remind you that I will be raising more cash as we move into that next target region. You see, once we move over 4860SPX, the upside potential is well exceeded by the downside potential in wave [4], as you can see on the 60-minute chart. So, I will be raising cash so that I am around 10% in cash to prepare for the wave [4] pullback. Should the market complete waves [iv] and [v] in wave v of 5 of [3], as shown on the 60-minute chart, then I will likely raise another 5% of cash.
In the meantime, the market seems poised to rally to our next higher Fibonacci Pinball target. But, I am still questioning if we head there in a more direct fashion, or if the market has one more pullback in store before we head to our next target.