Addressing The Larger Degrees
With the market exceeding our standard targets at the end of last year, which we set several years ago, it has caused us to adjust our expectations regarding wave (3) of wave v of 3 off the 2009 lows. While it would have been much cleaner to see a standard target struck and develop a wave (4) from that target, the market chose to provide us some uber-bullish extensions, so we have to deal with the realities of the market.
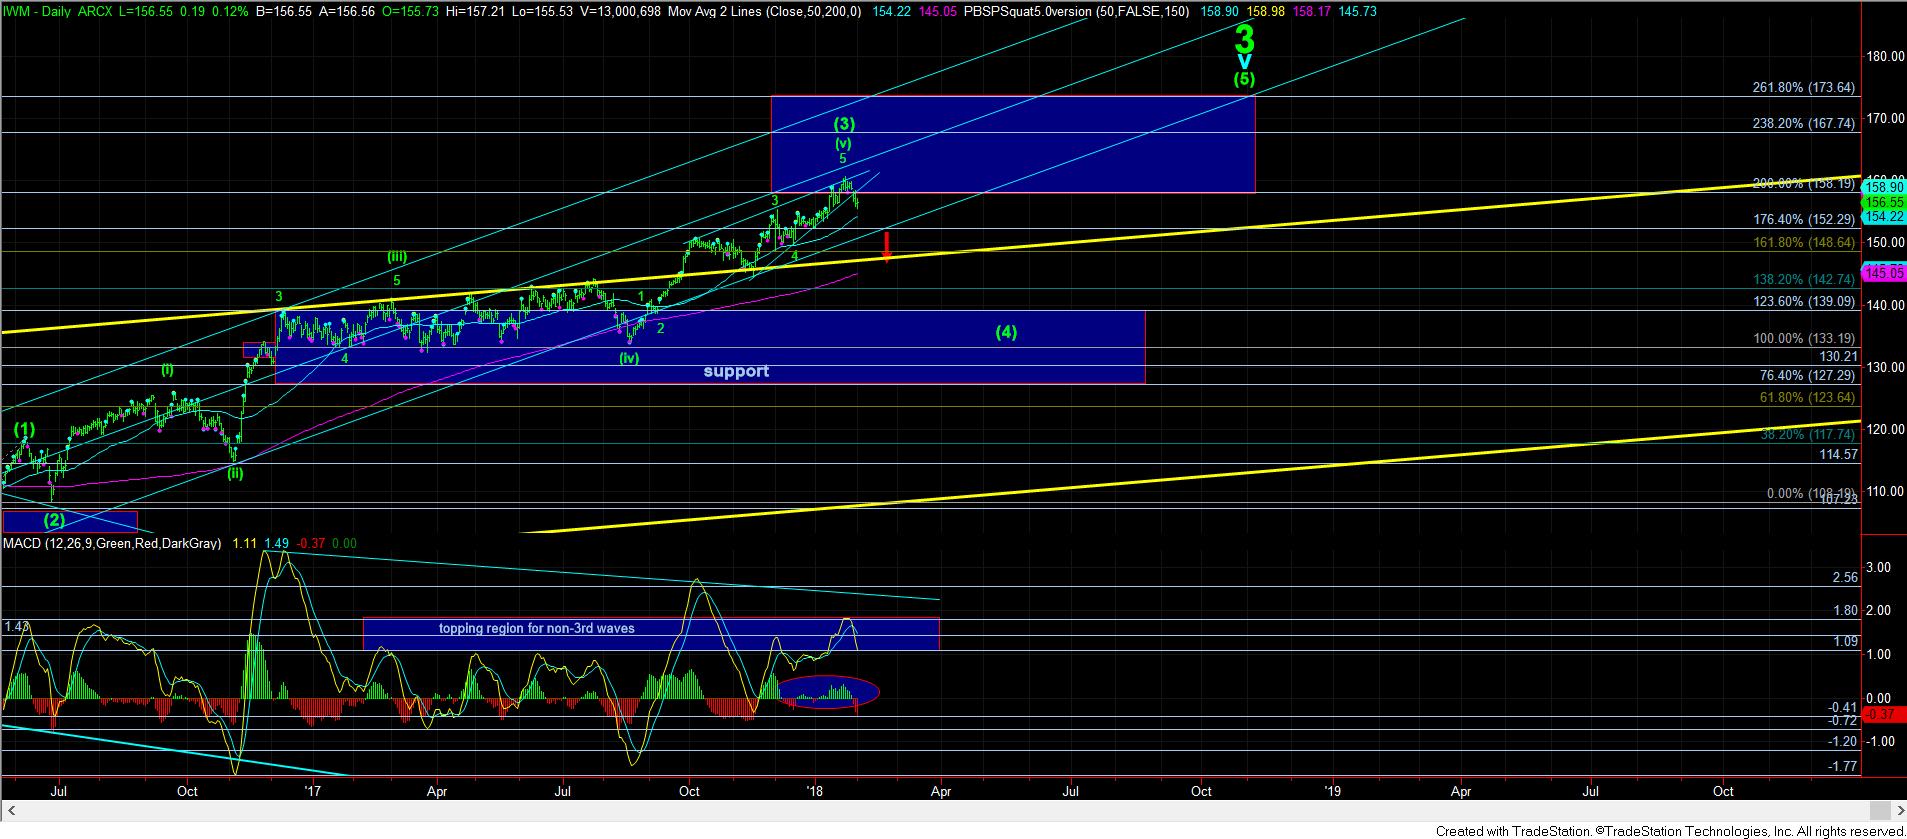
So, I will start out by noting that the IWM clearly has more than enough waves in place to suggest that all of wave (3) of v of 3 has topped. And, breaking below ideal support today makes that case a bit stronger. If you review the divergences evident on the daily chart, it suggests that the long side in the IWM is truly fraught with much greater risk at this time. And, should we see follow through below 152 on the IWM, that would solidify that expectation even more.
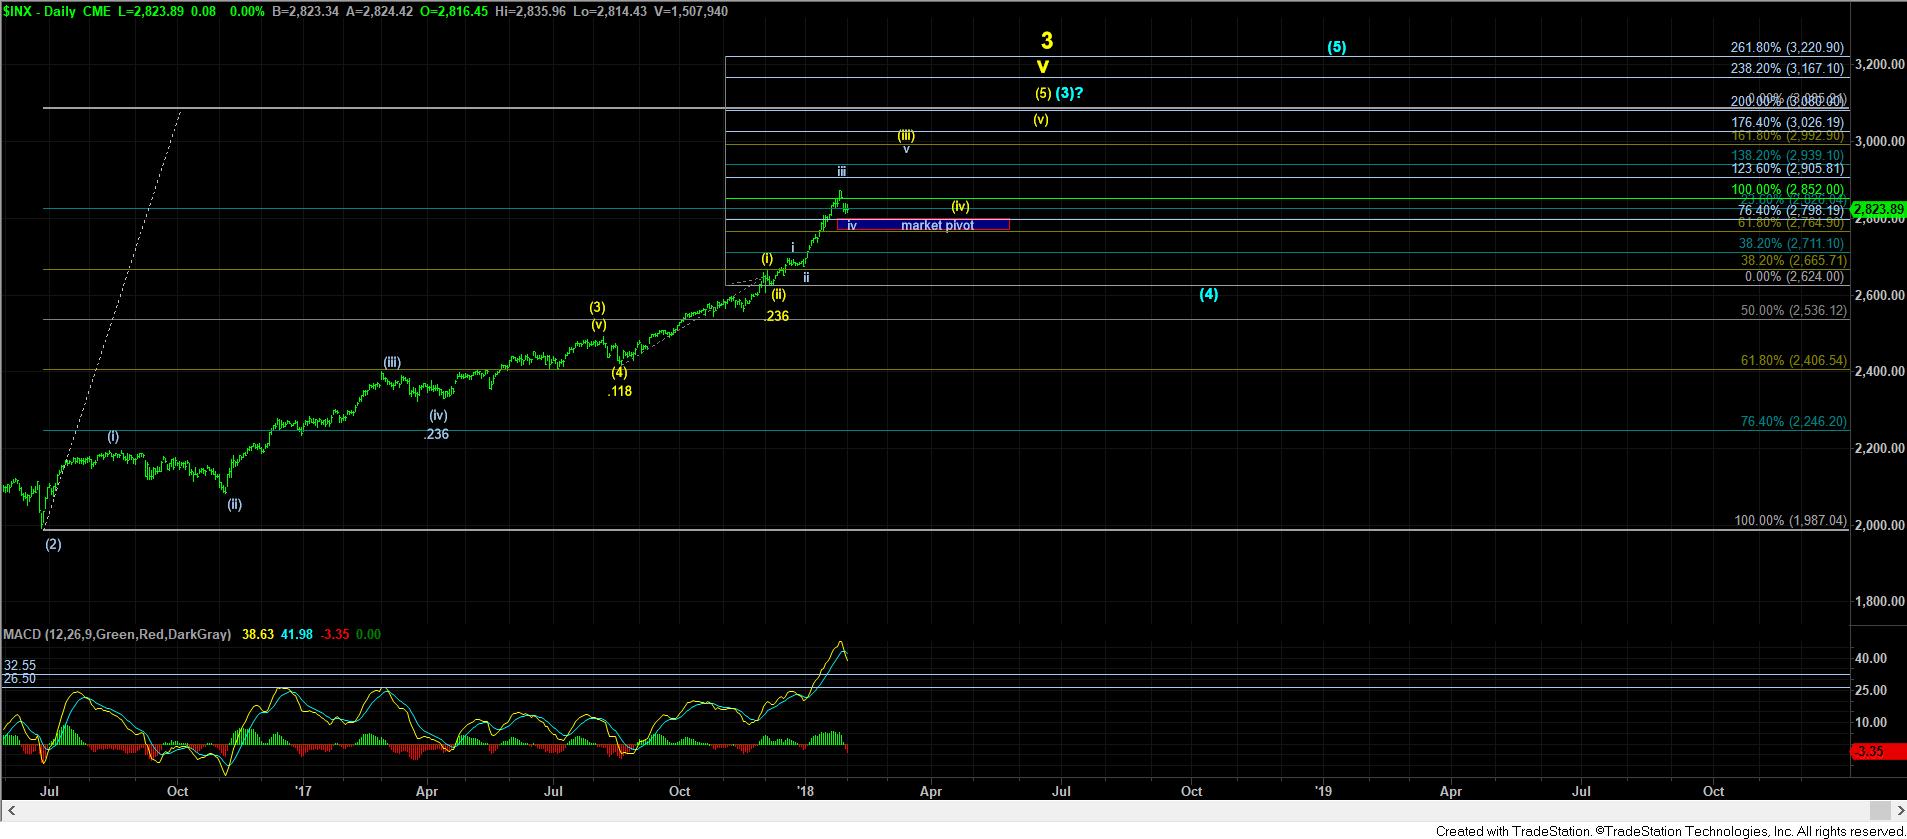
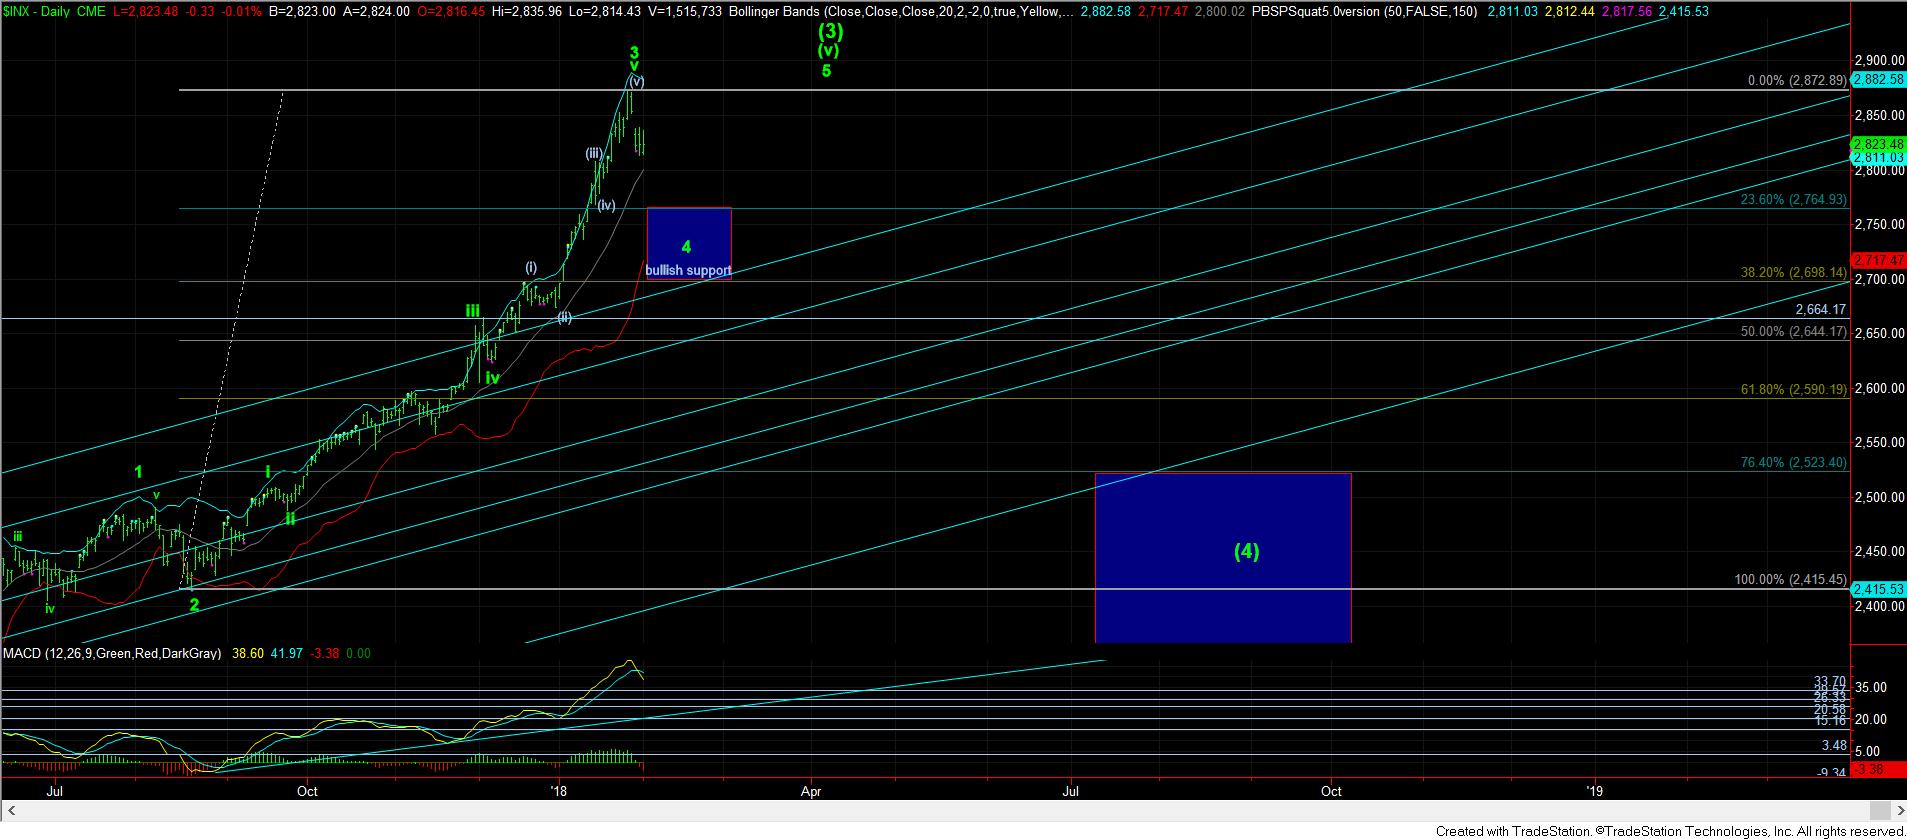
However, the SPX has shown to be much stronger than the IWM of late, and I still think we have to be cautious about assuming the SPX has certainly topped. For this reason, I have provided two potential support regions which can still lead to higher highs in the SPX, and I cannot assume a much larger degree wave (4) is in progress until those levels break. The two supports are represented in the bullish counts presented on the SPX charts attached, with the first support at 2796SPX for the more immediate bullish count, as we had been noting this week. A sustained break of 2796SPX would have me looking to 2700-2765SPX for the next bullish support, as represented on the alternative bullish chart.
Now, despite this being a very strong bull market, I have noted that the only way I would consider getting aggressive on the long side in the SPX is if one of our support levels we are following holds, and the market then develops a 1-2, i-ii structure off that low. That would suggest a lower risk long side entry, with a stop below the start of the wave i of 3 in that set up. Until that occurs, the market may begin to follow the IWM in a potential topping scenario, and the IWM has clearly caused me to become much more cautious in that regard.
The immediate current structure of the price action in the SPX is not strongly suggestive that we have begun a run to higher highs. In fact, the action has been quite overlapping and lacking an impulsive structure. So, it leaves me in the position I have noted above regarding a perspective of caution, as suggested by the IWM daily chart, along with being unwilling to trade to the long side of the market until a 1-2, i-ii structure develops.
While there is no question the market is quite stretched up here, and can continue to stretch higher, I still maintain an overall bullish bias when I look towards the coming years, however, I am trying to identify where we can see a larger correction taking hold. So, my perspective will be attempting to retain a bullish bias when we approach support, but only willing to trade to the long side when a 1-2, 1-ii structure is in place. Until that time, I will be considering the potential of “topping,” especially if supports begin to break.
Currently, the initial support is in the 2796SPX region, and we may still be setting up to test that support. In fact, the IWM suggests that I have to have an eye towards some further weakness. And, should we see a bullish structure develop before we are able to take out resistance, I will certainly post it.