Addendum To Today's Update
No, I am not coming back to tell you that the green count we were following before has resurrected. I think that is highly unlikely right now, therefore, I think it is unlikely that we are going to extend to 4400+ in this posture, as I see it now.
Rather, what I am seeing are two paths to complete this larger [c] wave at the lower region, as outlined in the weekend update.
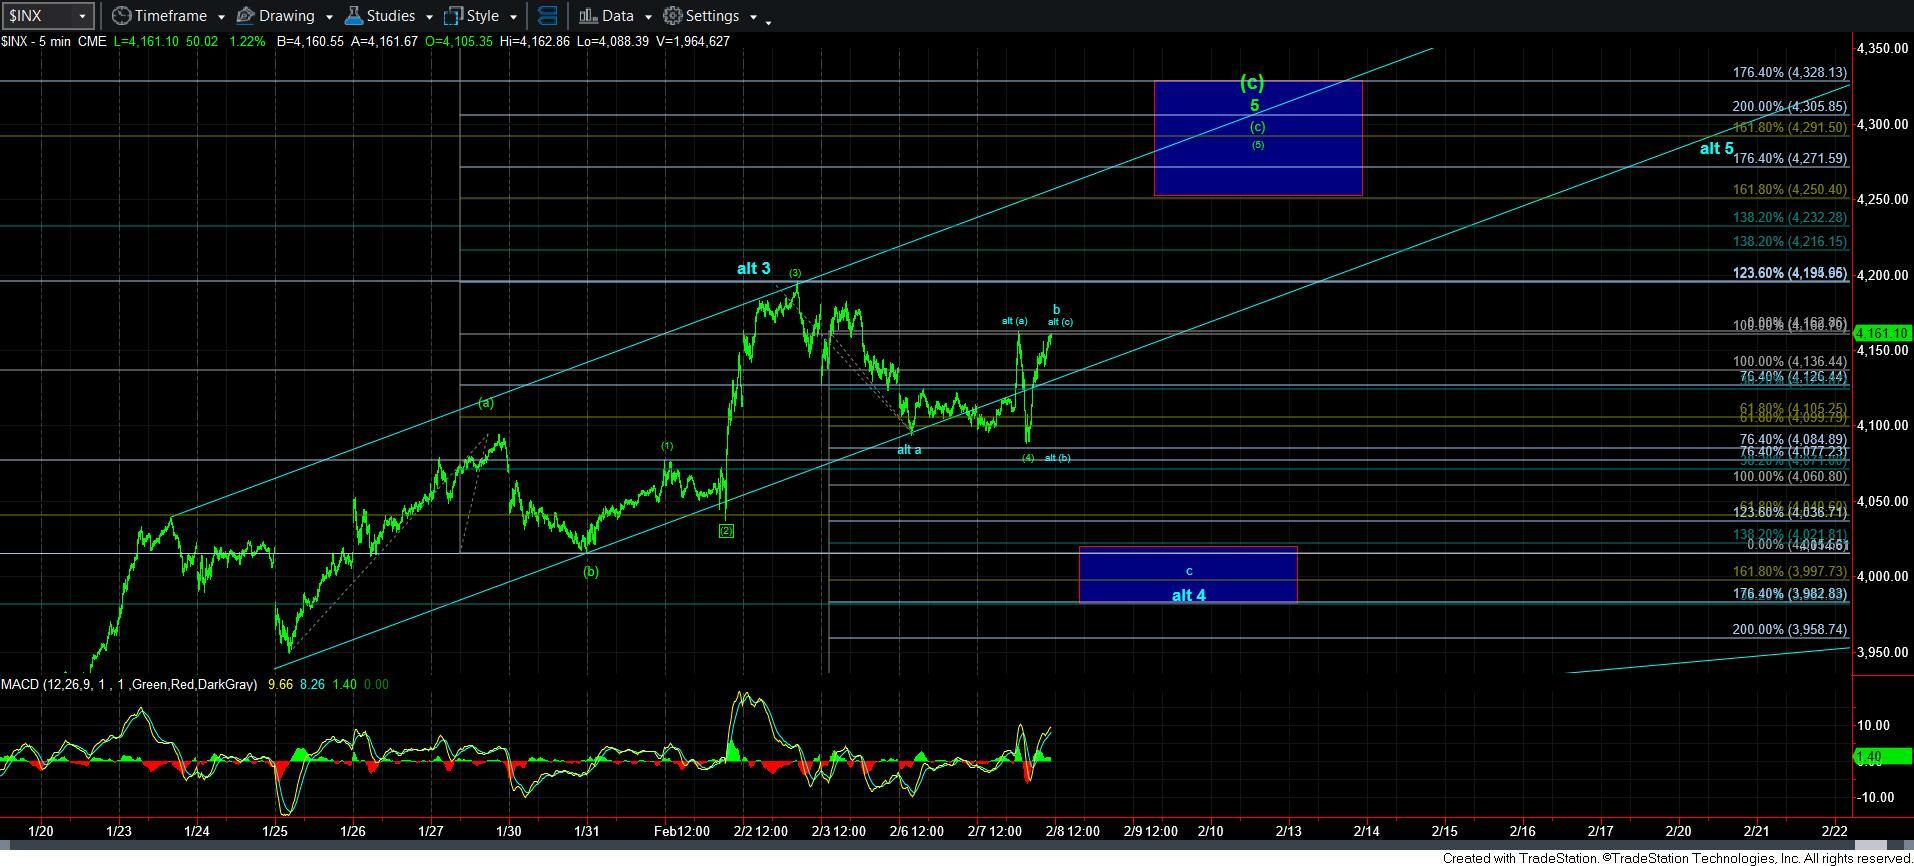
I am still using the blue count as an "alternative" since we did not break below 4077 and I think I am forced to do so, especially considering this momentum right now. Therefore, if all we see is a corrective pullback off today's low, then I have to assume we may be completing this [c] wave in a more direct fashion, as you can now see on the 5-minute SPX chart.
However, if the market turns down in impulsive manner, that would suggest the blue c-wave down is starting and we would be completing wave 4 in that manner.
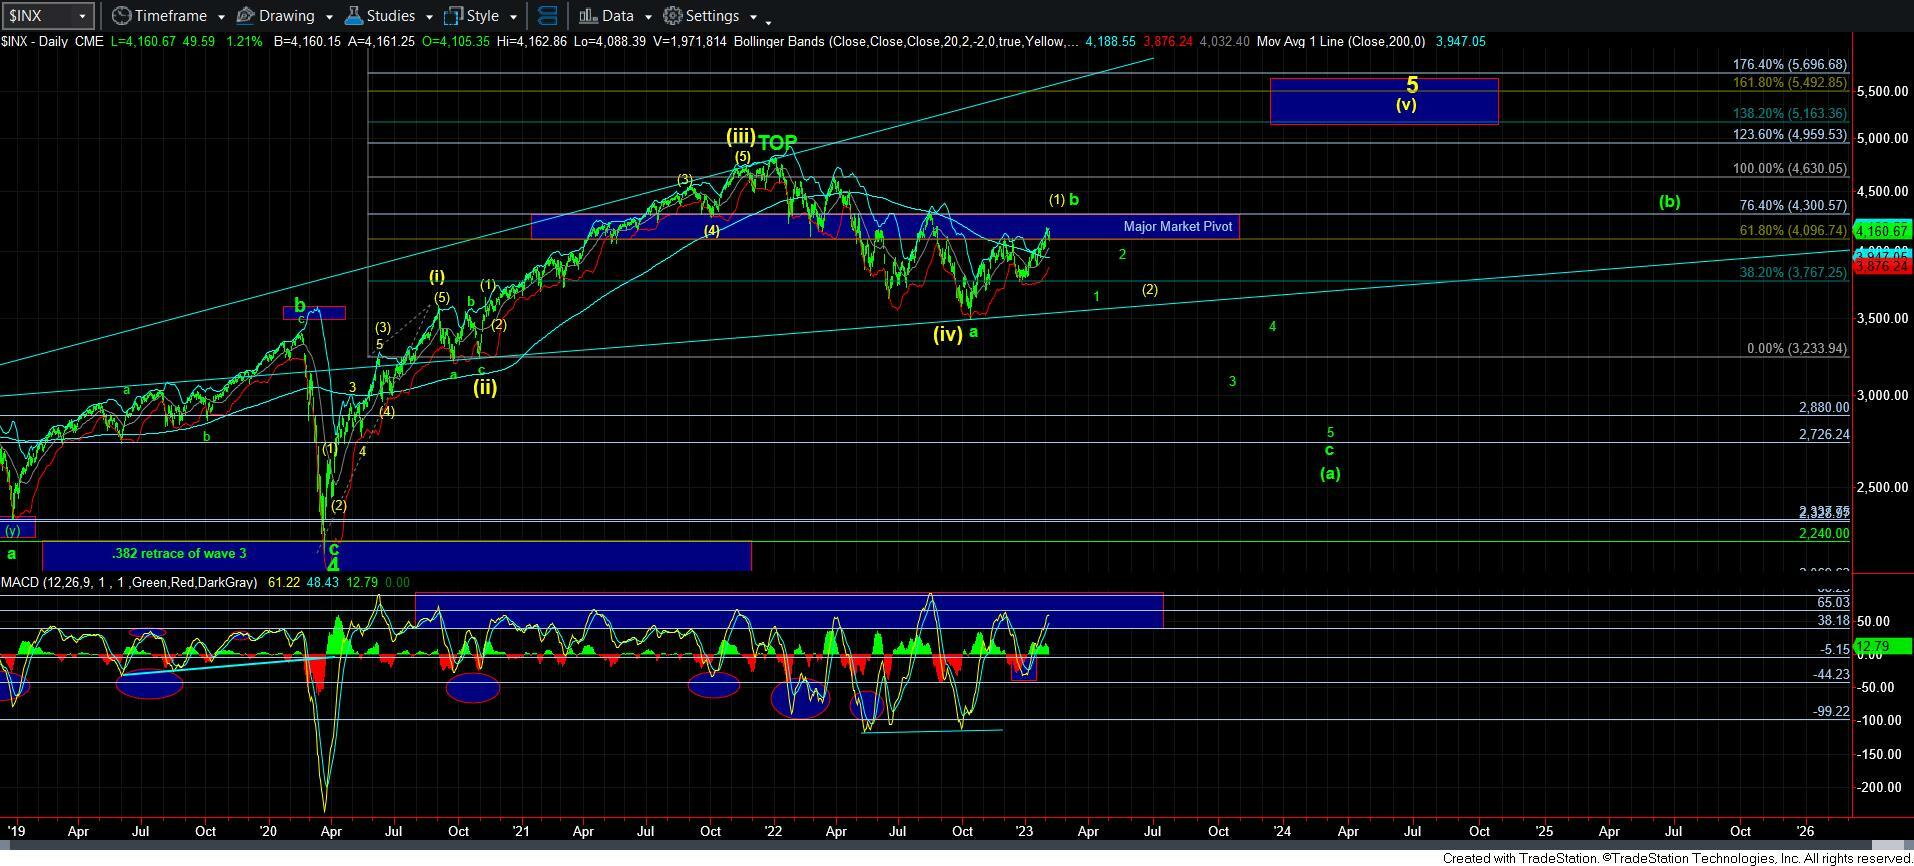
Under both situations, I still see the market attempting another push higher to complete this [c] wave of a larger b-wave. But, I have included the daily chart in this update to remind you that we are likely completing a bigger b-wave rally, with an alternative as yellow wave [1]. That likely means that once this [c] wave rally completes, we will have to see the manner in which the market breaks down below the 4000SPX region. If that break is clearly impulsive, then we have to prepare for a sizeable decline into later this year. If that decline is corrective, then we can begin to more strongly consider the yellow count to a higher all-time high and the 5150+ region again.