A Warning Shot To The Bulls?
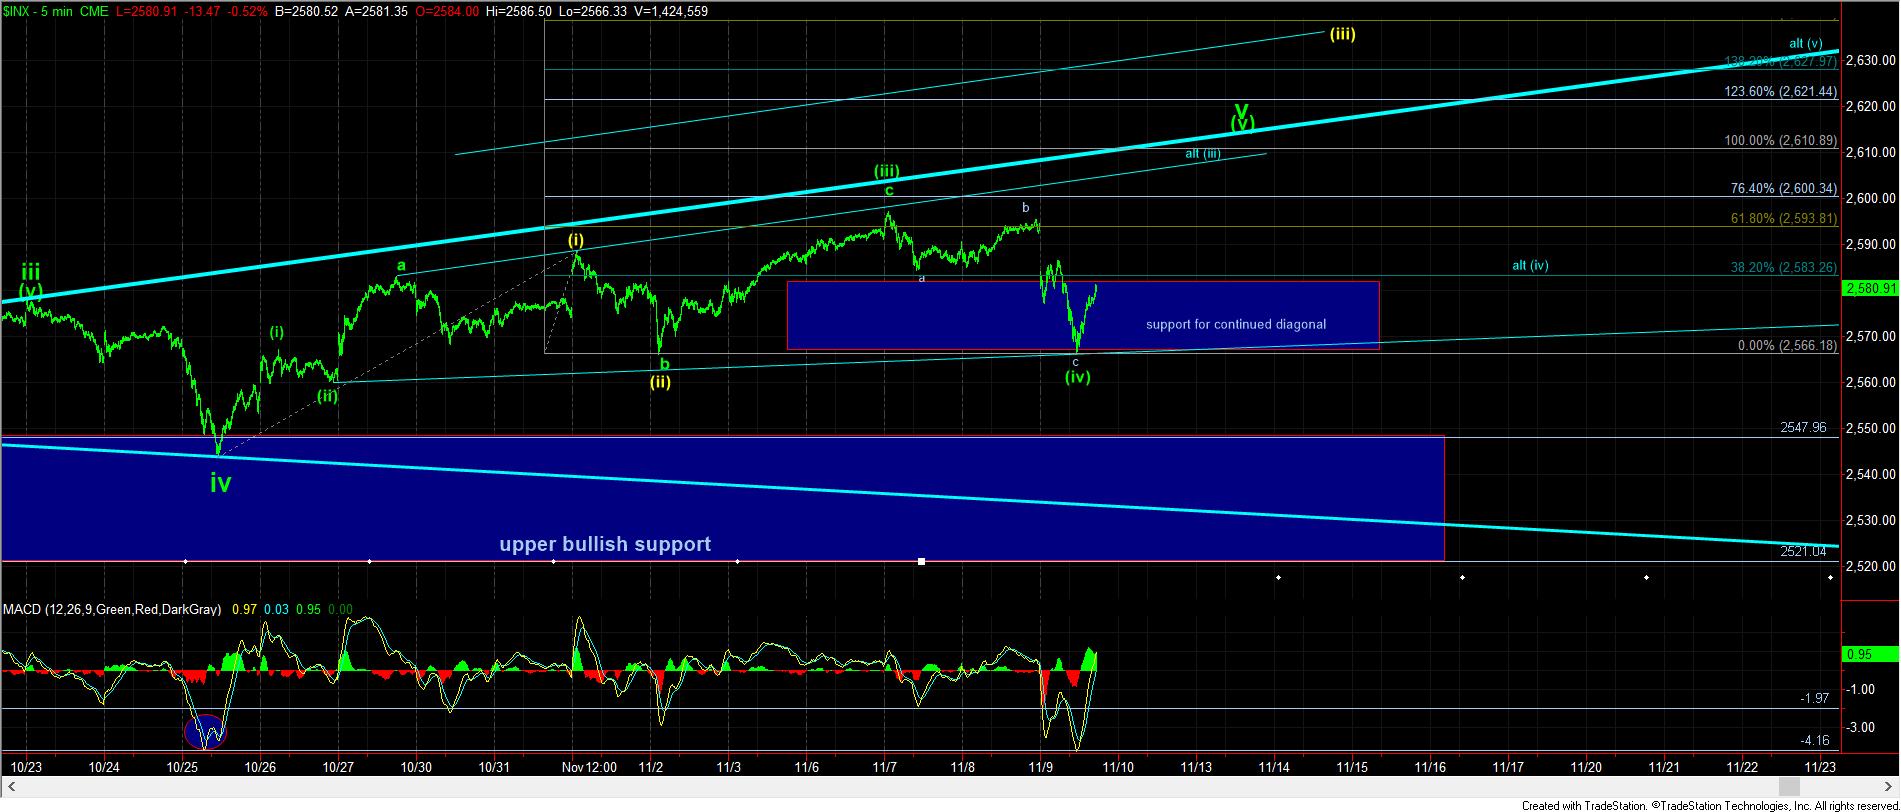
As was shown in the 5-minute SPX chart yesterday afternoon, the ideal pattern suggested a bit more weakness to complete a standard wave (iv) into today. However, what we experienced today was clearly deeper than my primary expectations. My opinion is that the market is weakening on its way up, and this is just a shot across the bow of the boat being piloted by the bulls.
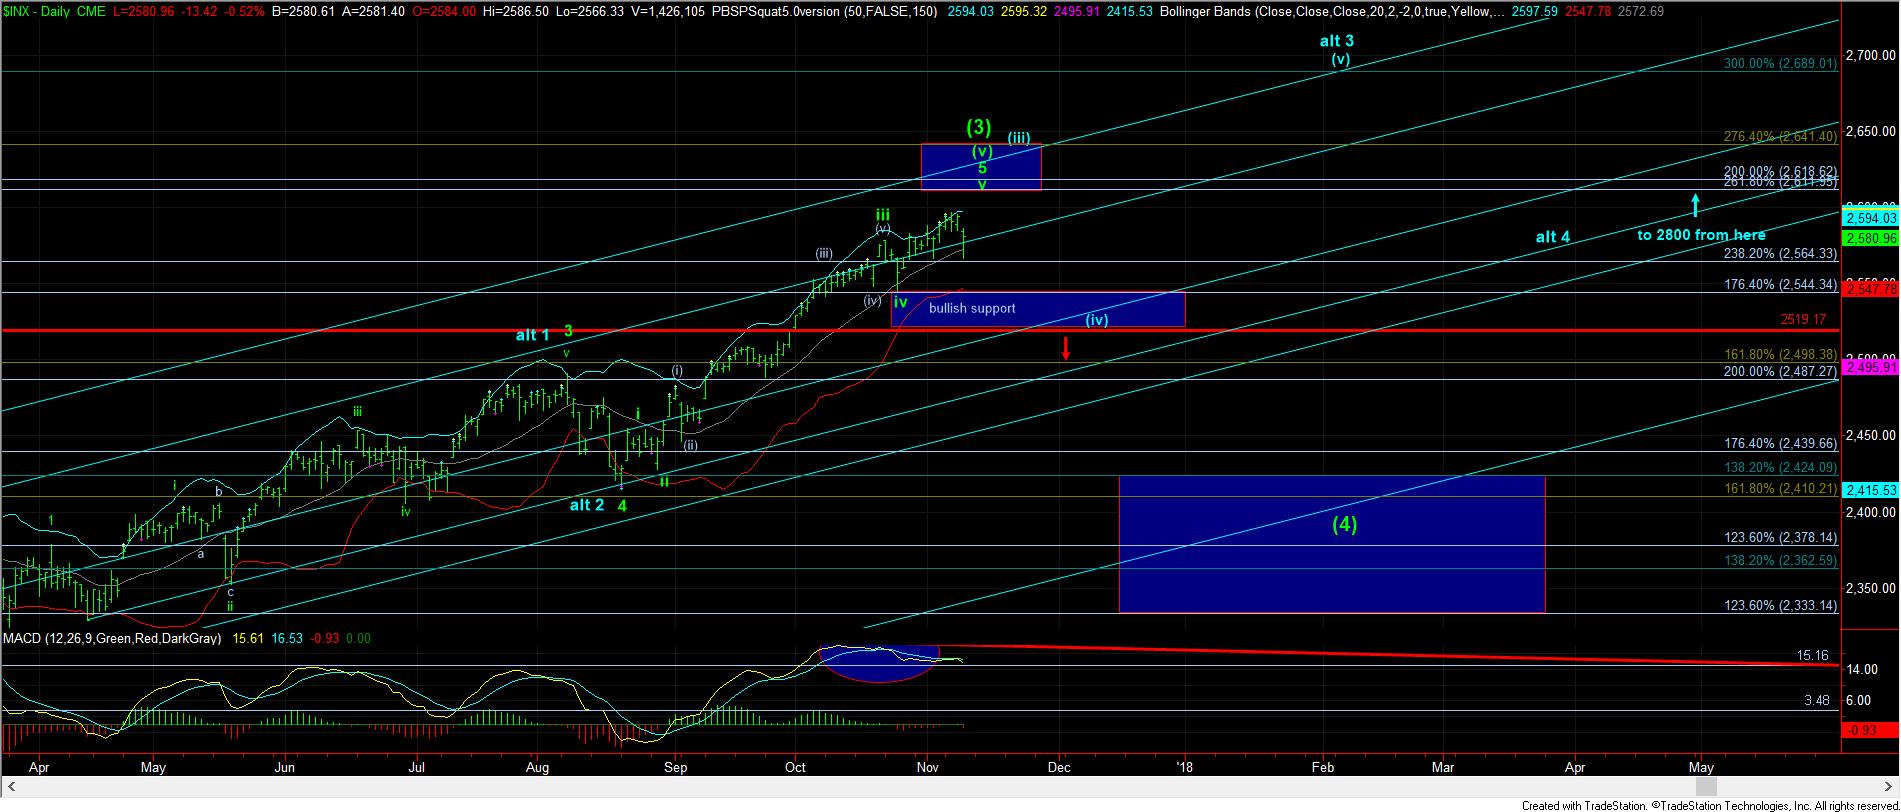
After all the dust settled, the SPX held the support box literally by pennies. While it still leaves the door open to head up towards our target box overhead on the daily chart, I have to say that the depth of the drop today has made it much more dangerous to maintain a strong bullish bias in the SPX, at least from my perspective.
But, it is still quite possible that the rest of the equity market (the NQ and IWM), which still have patterns in play pointing higher, may pull the SPX up along with it. But, the long side is not a highly confident trade for me in the SPX from this region at all, especially with the manner this market has overlapped in its wave structure since we began to rally off the October 25th low. Overlapping structures are not terribly appealing to me from a trading perspective, as there often is too much variability to provide a higher probability structure to trade. And, I think we have seen evidence of this over the last several weeks.
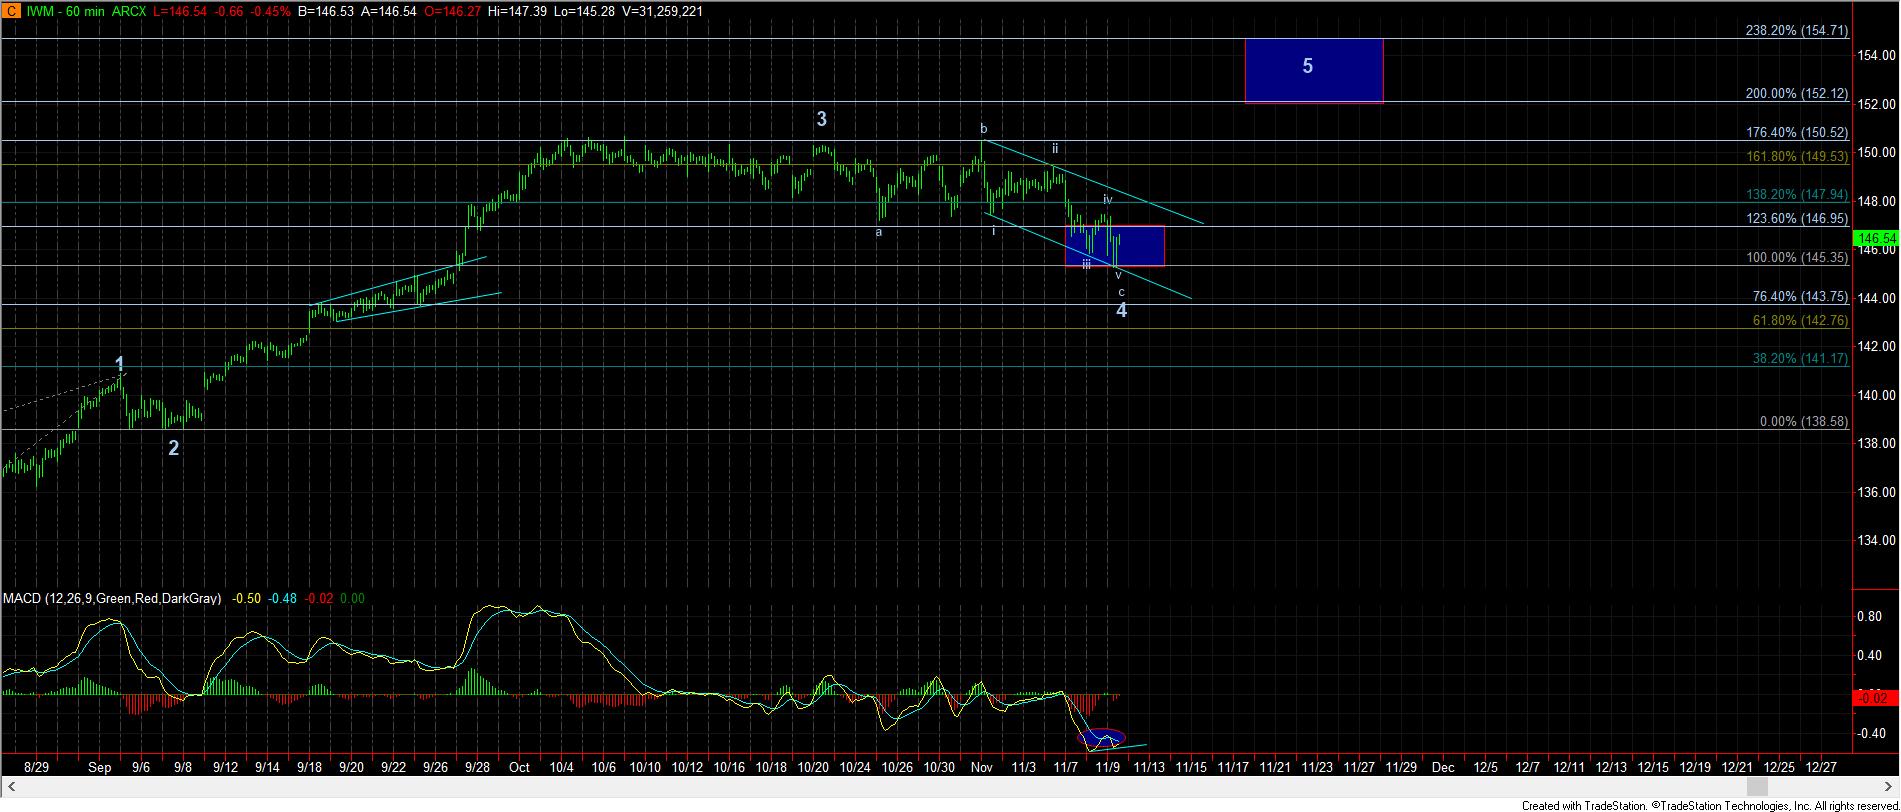
Rather, the more confident trade I see is still the IWM. As we have noted many times before, the daily chart really shows only a solid 3 waves up, right into the 1.764 extension of waves 1 and 2, as shown on the attached 60-minute IWM chart. The current pullback has taken us back towards the 1.00 extension for waves 1 and 2, which is just slightly below the .382 retracement of wave 3. This is the general target region for a 4th wave in an impulsive Fibonacci Pinball structure, so this is following a very typical Fibonacci Pinball structure thus far.
While the market MAY still want to provide a lower low down to the 144.50 region, should that support strongly break, it would be a strong indication that the IWM has completed its run off the August lows with a truncated top in place, which has to be my alternative perspective at this point in time. I personally do not rely upon truncated tops because they happen so rarely. So, I always need the market to prove it. With the pullback currently taking us to exactly where a 4th wave would normally expect to pullback, my primary count remains that this is wave 4, with a 5th wave to new all-time highs in IWM yet to come.
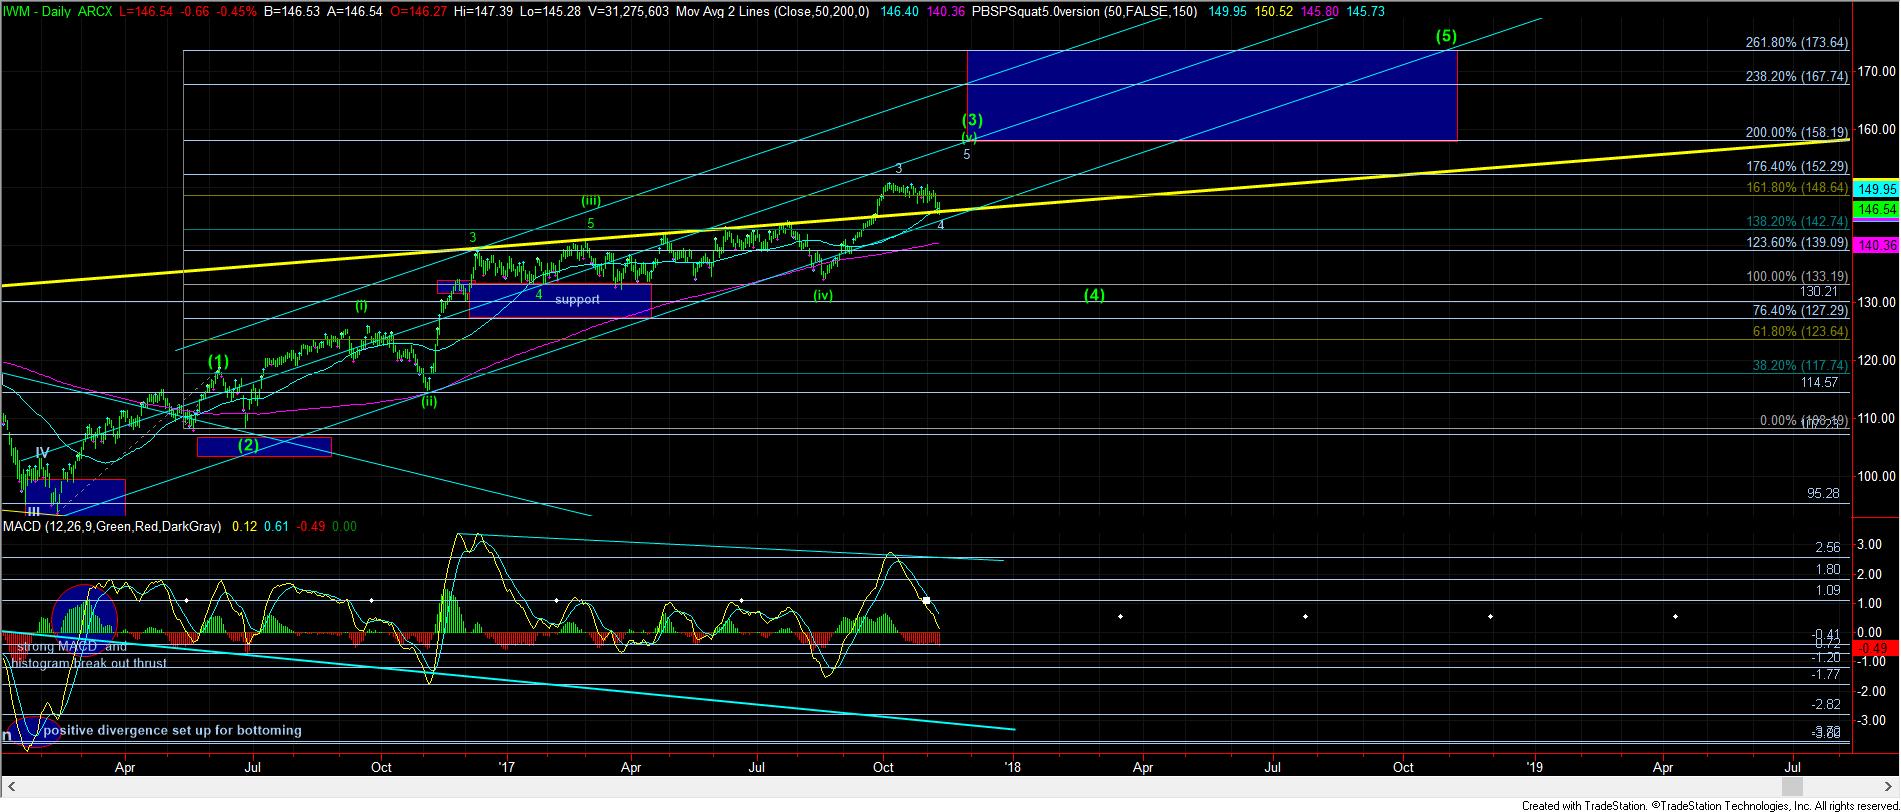
Moreover, if you look at the daily IWM chart, you will see that the August rally broke out through a trend line which has held the IWM in check since the 2014 high. Moreover, each time we have struck that trend line, the market has pulled back strongly. After breaking out of a long term trend line, as we did with the August rally, the market is now coming back to test that break out region from above, which is also quite typical of bull markets, right before they begin the next rally. In our case, that next rally counts best as a 5th wave to new highs.
While extensions can certainly still occur in the SPX (as shown in yellow, and discussed yesterday), I am still of the point of view that we are approaching a top that will send us back down to test the support region on our daily chart within the 2520-50SPX region. And, should we be able to break that region of support, it will open the door in a big way for the wave (4) pullback that I am still expecting, which targets the 2330-2400SPX region.