A Walk In The Clouds
Well, right now, I feel like I am soaring among the clouds. Whereas the market has attained heights many never dared dream of years ago, we have been looking up to these levels for years. So, we are clearly soaring in the clouds.
But, at the same time, when you are soaring amongst the clouds, it does get cloudy. And, right now, I would classify the current structure as a bit cloudy.
As I explained last night:
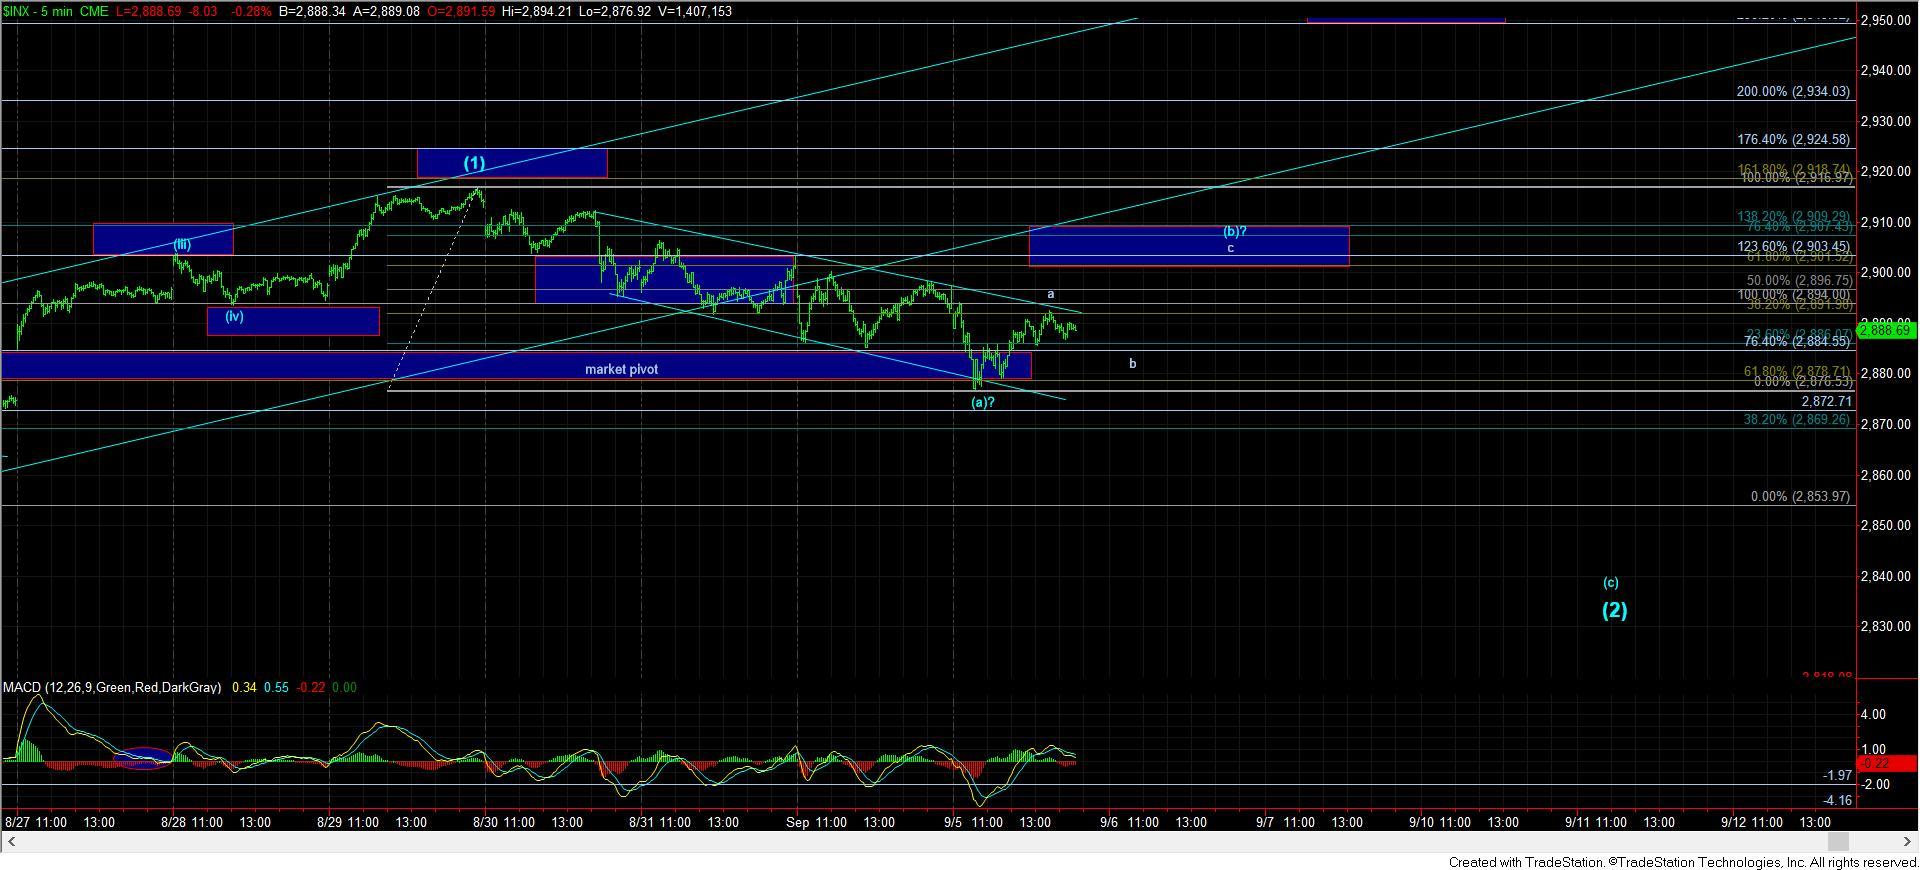
“While the market was playing textbook Fibonacci Pinball for several weeks now, the break down below Friday’s low has now provided us a warning as it has gone outside standard Fibonacci Pinball. You see, within our Fibonacci Pinball system (which is a standardized analysis), once the market strikes a 1.618 extension, it USUALLY targets the 1.00 extension for a 4th wave pullback. That 1.00 extension was struck on Friday.
Today, we have broken below that, and have thus far bottomed at the .764 extension, which is not often seen as a target for this degree of 4th wave. Rather, when we break below the 1.00 extension, more often than not, it provides us with an early warning that the market will likely retrace even further.”
Today, the market dropped down to the lower end of our smaller time frame market pivot, and has bounced. While I can count 5-up in this bounce in what could only be classified as a leading diagonal due to the overlap in waves 1 and 4 in that rally off today’s low, I cannot count that as a clear indication of a solid bottom just yet.
As you can see from my modified count on the 5-minute chart, I am viewing this rally as corrective and the start of wave (2). And, as long as we remain below 2910SPX, this is going to be my primary count right now.
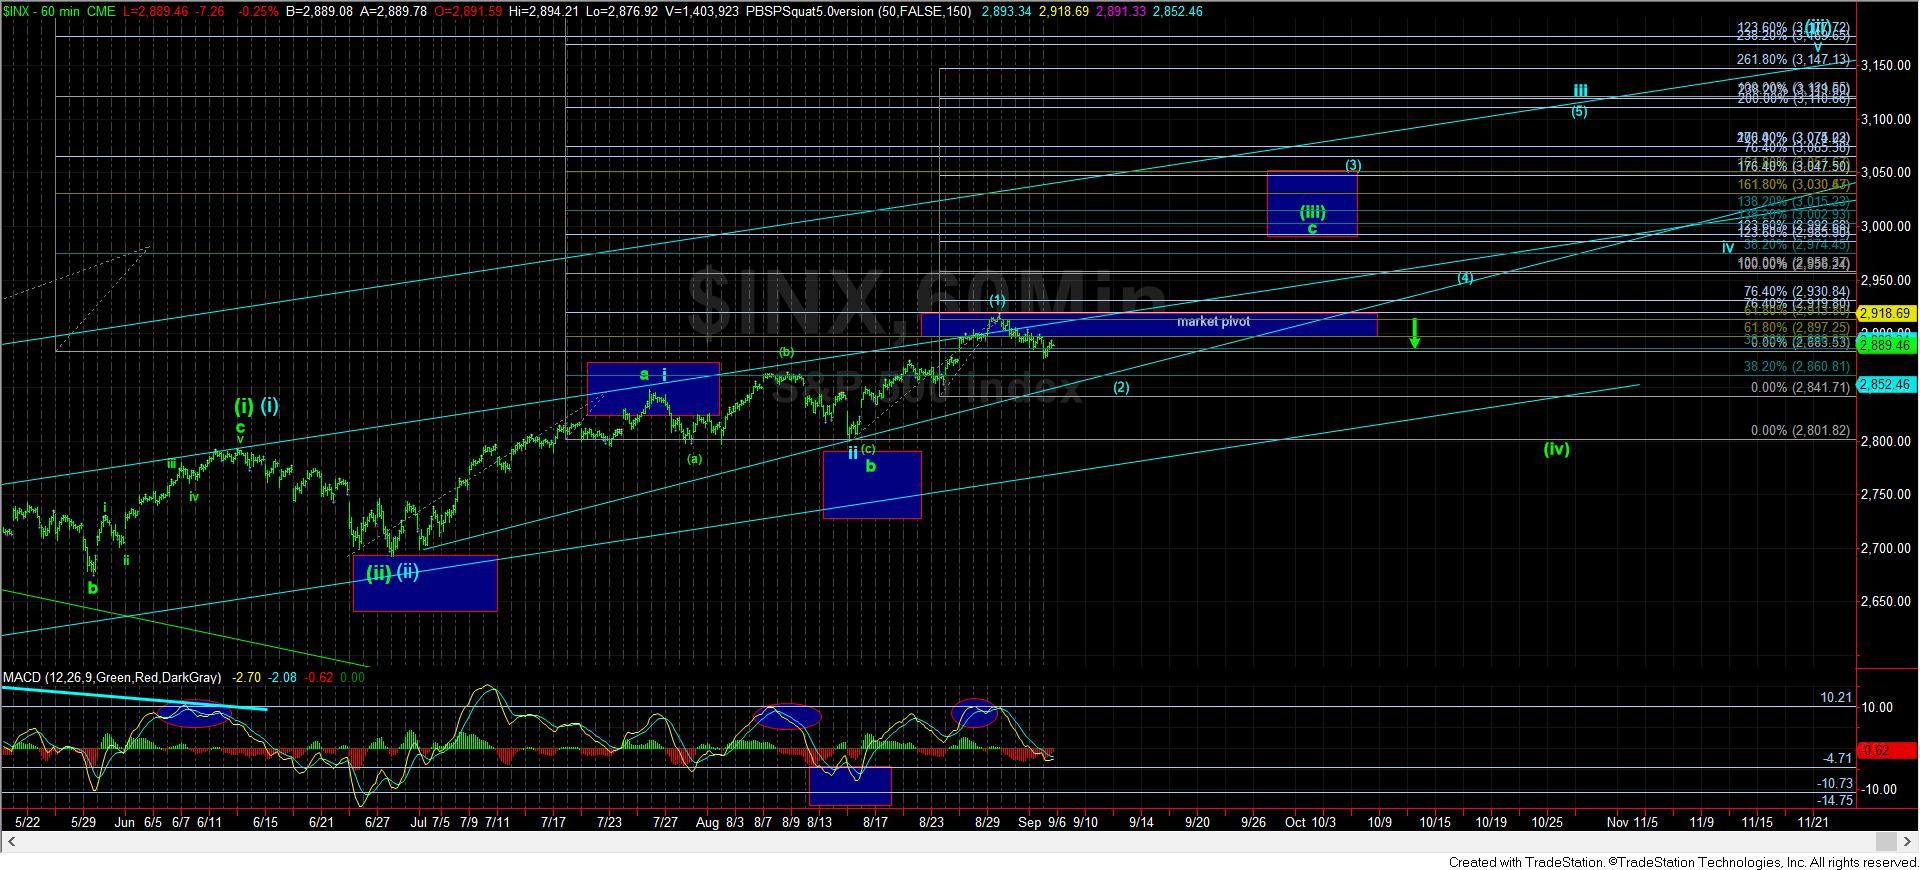
While the market can certainly resurrect and rally through 2910SPX on its way to 2950+SPX, our Fibonacci Pinball method suggests that the break of the 1.00 extension with a further break of .764 is an early warning that the market will not continue in the standard impulsive structure to the upside. Moreover, even if the market is able to break out over 2910SPX, and continue towards 2950SPX, then I would have to view it as part of the ending diagonal presented in green on the 60-minute chart. This would also make it much less likely that we can attain our 3225SPX target, with the more likely target just over the 3000 region.
But, since a break of the Fibonacci Pinball supports suggest a bigger pullback is likely in play, I am going to have to side with what the greater probabilities suggest. And, should we see the lesser probability play out, then it likely limits our upside to the 3011 region.
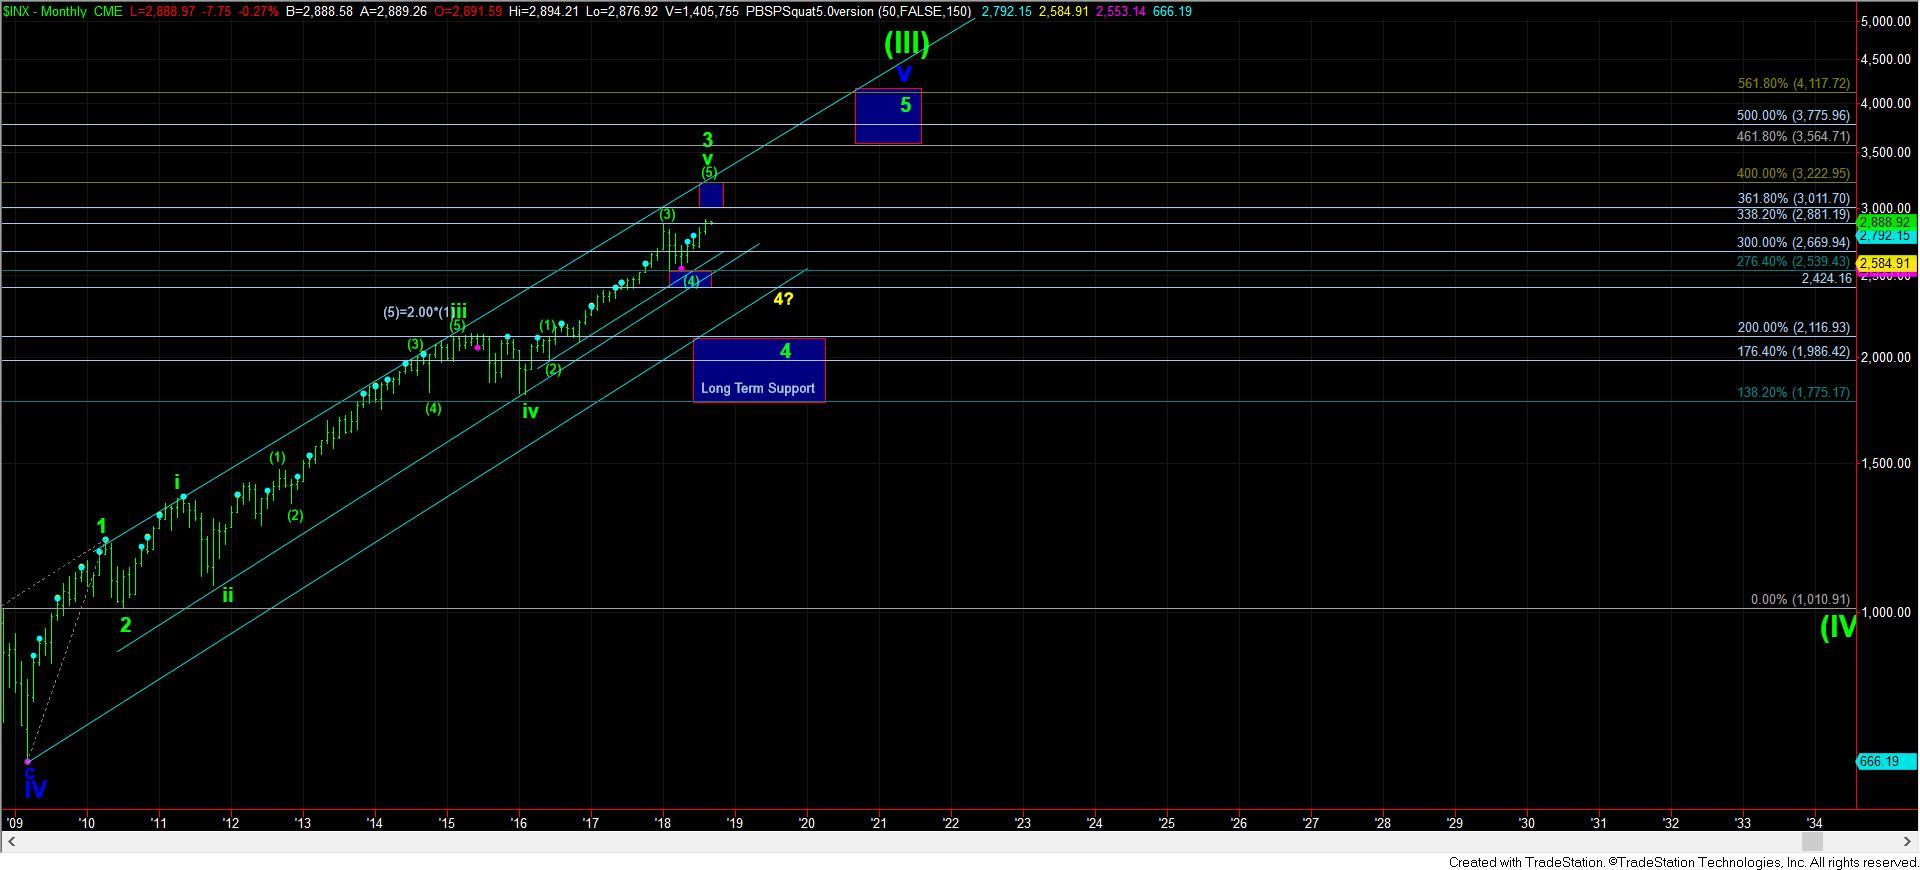
Also, remember that if we do get the bigger wave (2) pullback, it puts us back on track for the 3225SPX target.
At the end of the day, as long as the market remains over the 2830/40SPX support region, I have to maintain a larger degree bullish perspective, with a minimum target of the 3011 region. The question remains the path as to how we get there.
Alternatively, should the market either see a sustained break below 2800SPX OR develop 5 waves down off the recent highs, then I will have to be on alert to the potential that we have topped in this wave 3 off the 2009 lows, or that we are in a c-wave in a much larger wave (4), pointing us down to the 2500 region retest again. But, for now, those are the lesser probabilities I am tracking. But, when we break a Fibonacci Pinball structure, I have to at least maintain them as a consideration for now.
I know this has become a bit more complex than we were hoping for at this time, so if you have questions please do ask. Have a good evening.