A Tale Of Two Charts
A Tale Of Two Charts
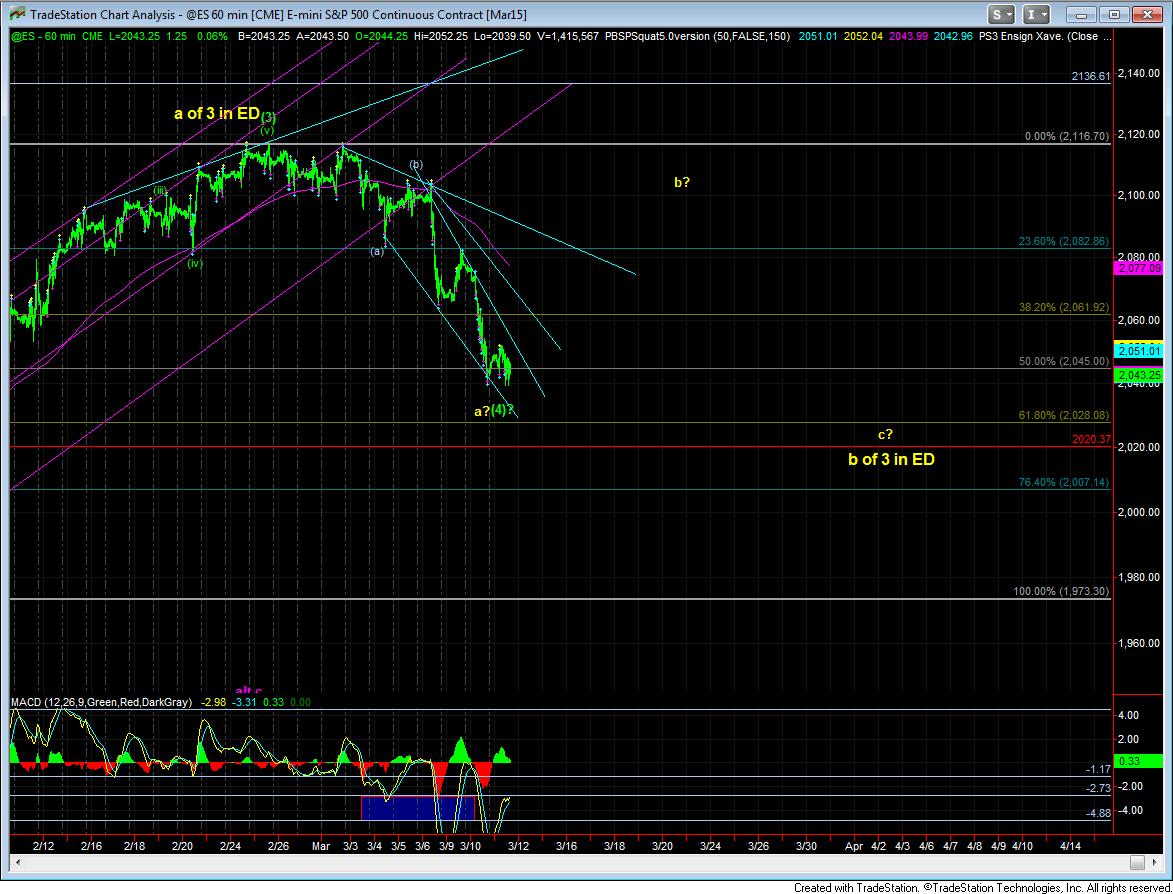
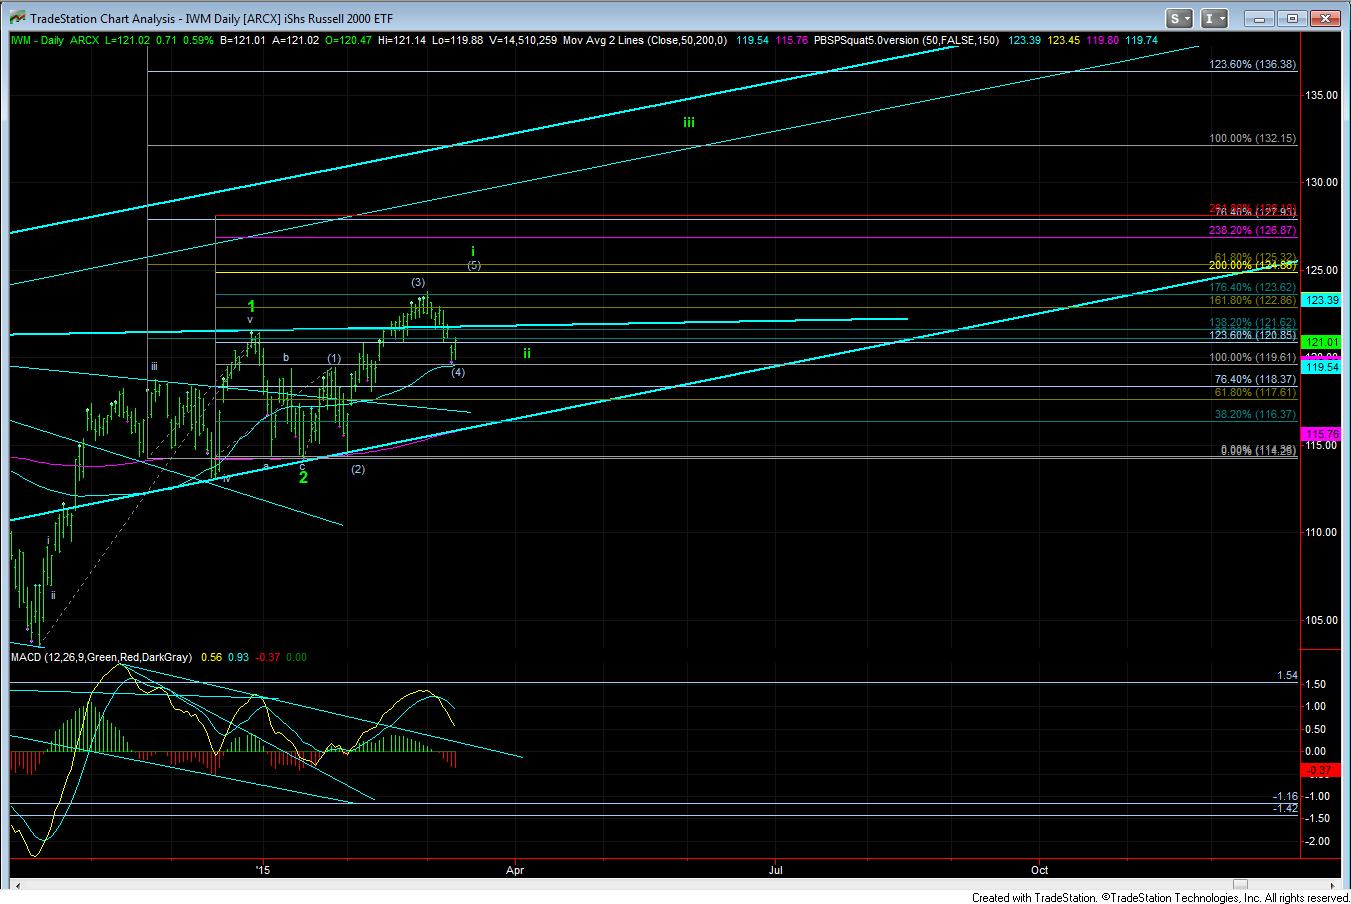
As we have seen, the IWM has held up much better during this decline than the ES. And, technically, the IWM can still count as a wave (4) pullback in wave I of 3. So, I have been trying to get creative as to how ES will potentially stay within an ending diagonal pattern, while IWM completes wave I of 3.
If you look at the 60 minute chart, what I have come up with is that ES has a b-wave rally in a larger b-wave of wave 3 in the ED. This b-wave would likely top around the same time as the IWM completes its wave (5). The next drop would then be a wave ii for IWM and a c-wave in the b-wave for wave 3 in ES. Both of which would then have a 5 wave structure higher to complete wave 3.
But, I just want to note that I am trying to come up with possibilities as to how these two charts reconcile over the next few months. So, I am simply presenting this option tonight for you to think about and keep in the back of your minds over the next week or two. So, while I was hoping to gain more clarity on the bigger picture by the end of this week, it may still take us a few more weeks to straighten out the bigger picture and exactly how we get to higher highs . . . assuming we continue to maintain support.