A Reminder About Corrective Action
Elliott Wave structure outlines for us that the primary trend breaks down into a 5-wave structure. Waves 1, 3 and 5 take shape as 5-wave sub-structures, whereas wave 2 and 4 take shape as 3-wave structures, which are labeled a-b-c.
Most of the time, the a-wave is a 3-wave structure, and it breaks down into its own [a][b][c] structure. Occasionally, they can be a 5-wave structure. B-waves are always 3-wave structures, and break down into [a][b][c] structures. Lastly, c-waves usually take shape as 5-wave structures. And, that includes the [c] wave within an a-wave or a b-wave.
So, as you may have gleaned from that explanation, the most variable segment of a market structure are the corrective structures. And, that is why they are so difficult. This is why I consider trying to identify every twist and turn in a corrective structure as being akin to attempting to throw jello for distance.
As far as targeting, the a-wave often targets the .382 retracement of the prior rally, the b-wave often retraces .618 of the a-wave decline, and the c-wave will often target the .500-.618 retracement of the prior rally. Furthermore, we often see an a=c or c=1.382*a relationship between the c-wave and the a-wave. And, the full a-b-c structure often targets the .618 retracement of the prior rally.
Now, if you take a step back, and recognize that Elliott Wave analysis provides to you the context of the market like no other method can, which will allows you to recognize that you are moving into one of these types of corrective structures. And, understanding the environment in which you are trading or investing is truly half the battle. Clearly, one does not trade aggressively during a corrective structure, as it can take many different twists and turns.
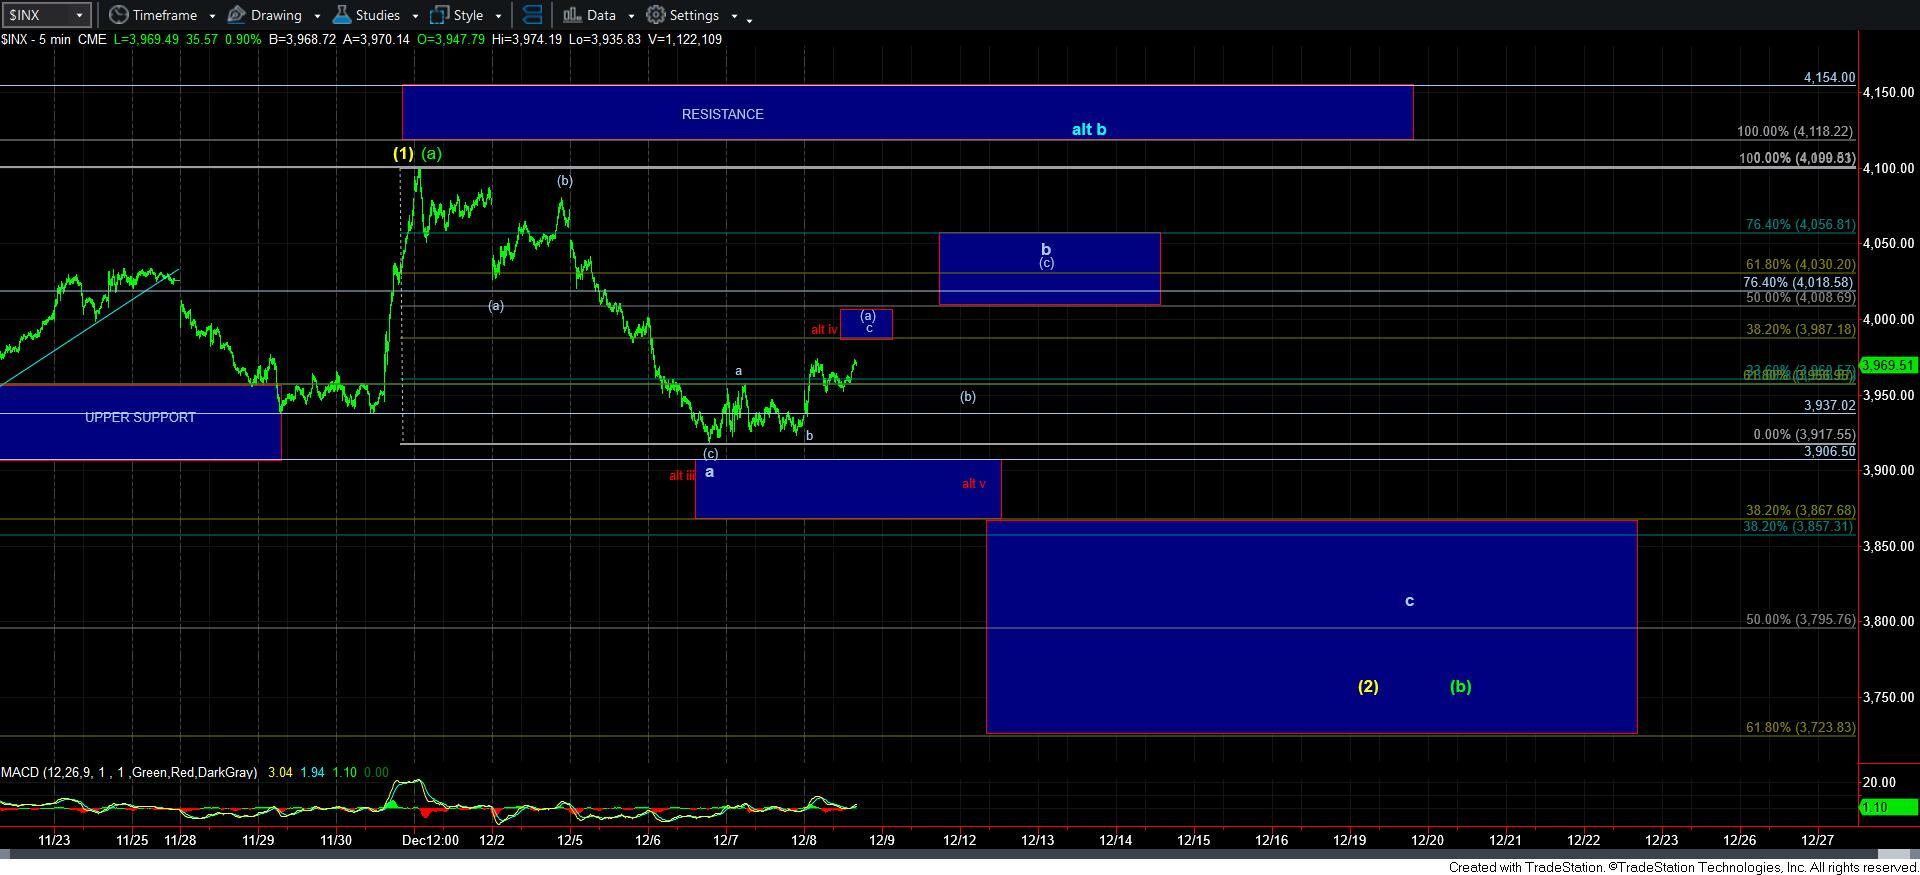
In our current case, I cannot say that the [c] wave of the a-wave down took a clearly impulsive 5-wave shape. Moreover, we have also come up short of the common target for the a-wave in the .382 retracement region. Therefore, I am unsure as to whether the a-wave has indeed completed.
Note that my primary count does have it noted as completed, but I cannot say so with a high degree of confidence due to the issues noted above. Of course, I have outlined an alternative in red which can still provide a bit of a deeper pullback in the a-wave.
Should the market be able to stretch to the 3987SPX region, then it makes it a bit more likely that we are completing an [a] wave of the b-wave bounce, as we would be targeting the .382 retracement of the a-wave decline, which, again, is the common target of the [a] wave within a b-wave.
Again, much of this will likely sound quite difficult, and that is because it is. The degree of market complexity increased many-fold during a corrective structure. And, even though I attempt to provide you a general path during these corrective structures, the market often provides surprises during these structures. So, again, it is not the most reliable environment in which to trade.
But, consider that should we see a completed [a][b][c] structure in the b-wave, wherein we have a clear relationship within the [a] wave and [c] wave, and wherein the [c] wave exhibits a clear 5-wave structure with a 2.00 extension within its internal structure has confluence with a larger [a] wave and [c] wave relationship, which also has confluence with a Fibonacci retracement level of the prior a-wave decline, then we have a high probability turning point. That is the time we can expect a reversal and turn down in the initiation of the c-wave decline. Moreover, should we see a clear 5-wave initial move down off that resistance, then it should confirm for us that the c-wave has begun, at which time, one can choose to short the c-wave down, with a stop at the b-wave high for risk management purposes.
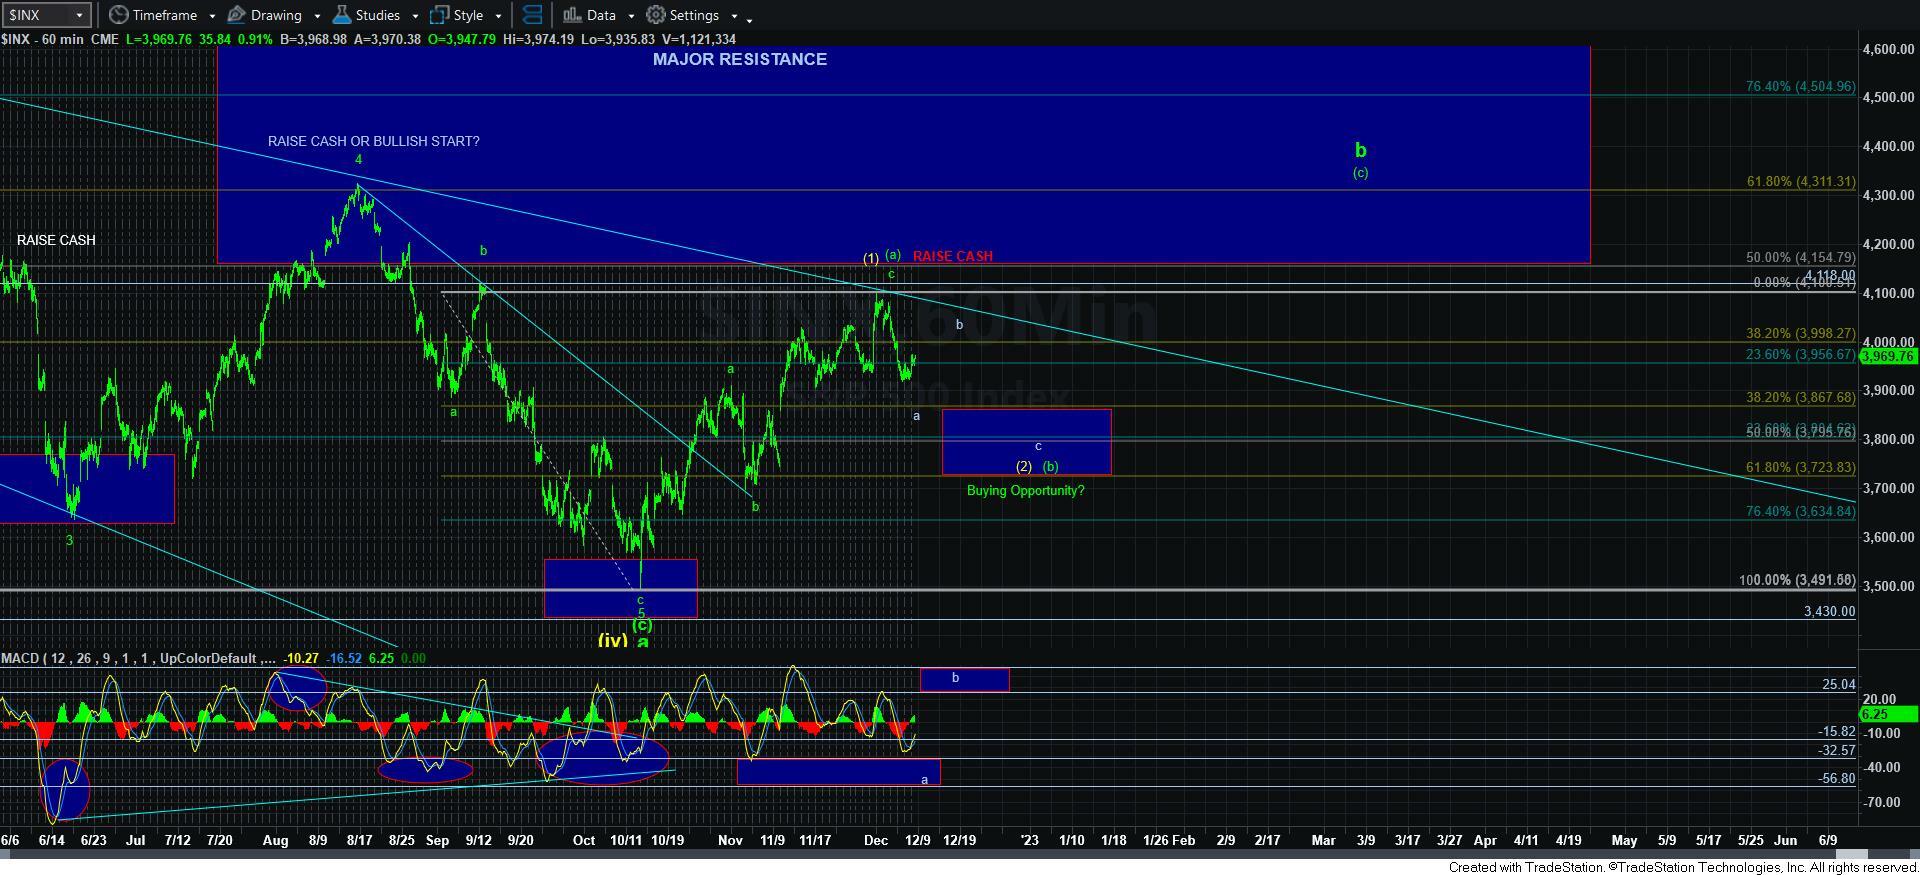
In the meantime, I would note that the MACD on the 60-minute chart seems to have come up a bit short of the ideal target for the a-wave drop. Furthermore, we have come up very short of the ideal target for this a-wave decline. So, this still leave the door open for the lower low potential within this a-wave.
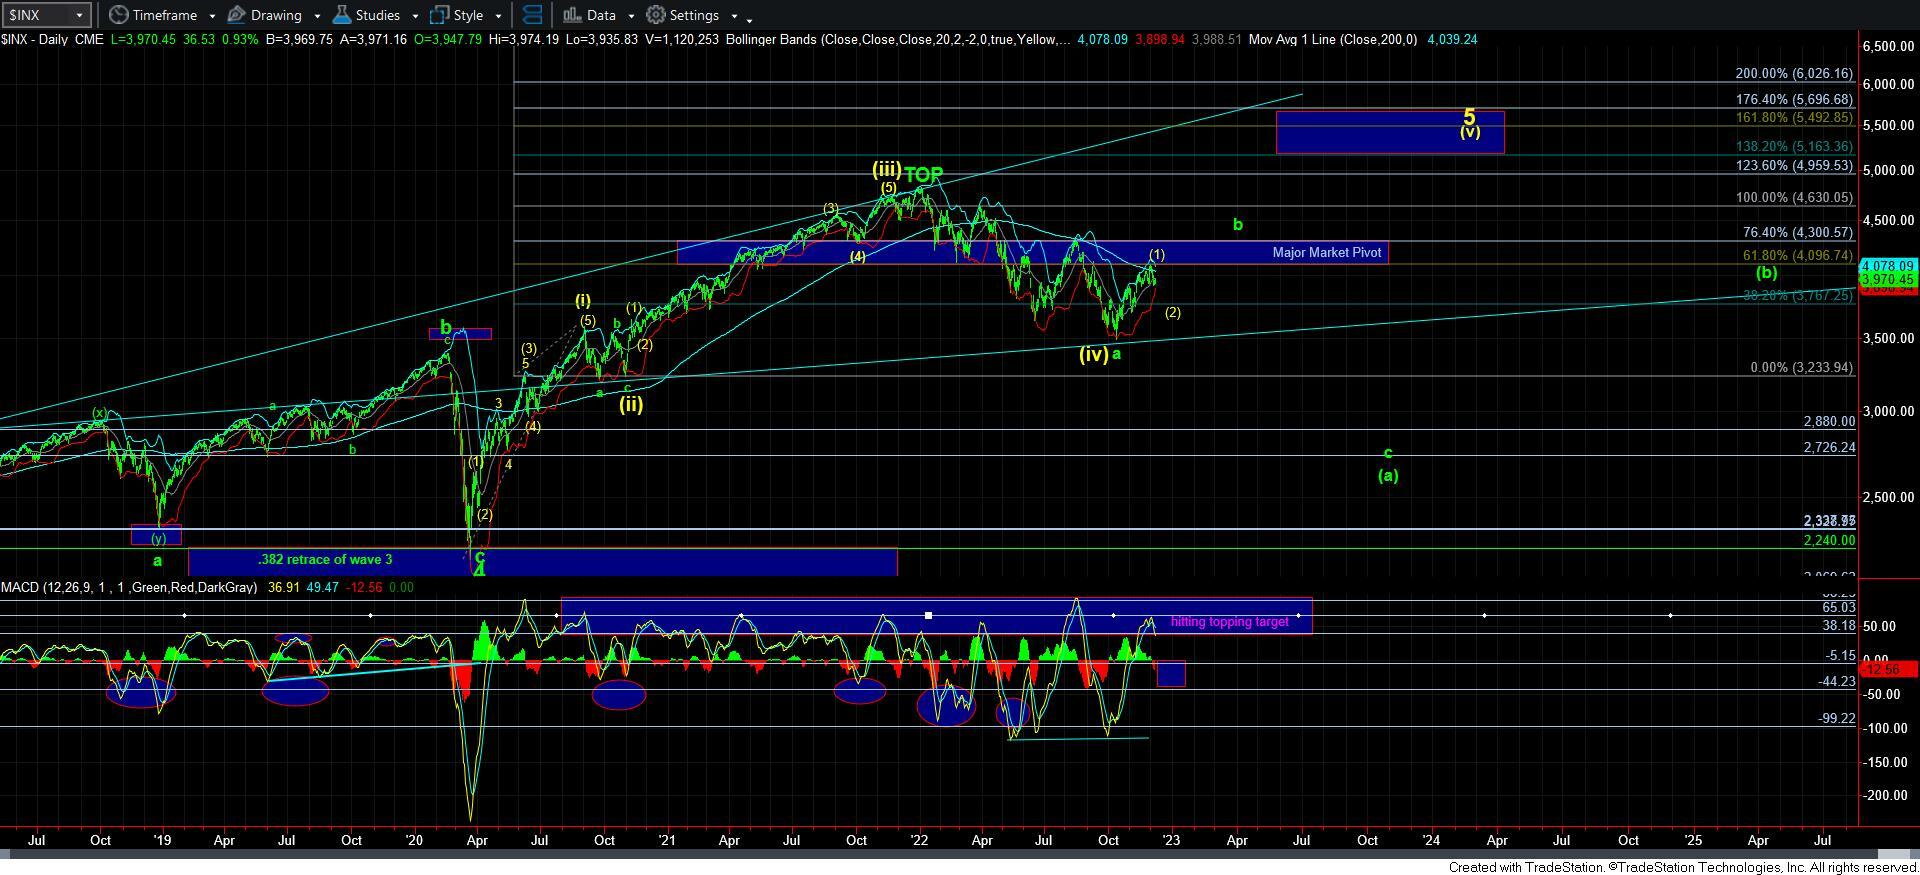
Moreover, the MACD on the daily SPX chart has now begin is descent to the ideal target below. So, I think this is a clear signal we are likely caught within the corrective pullback we have been awaiting.
In summary, the main goal of this update is to highlight for you the treacherous nature of a-b-c structures, and how to deal with them. And, as Elliott Wave analysis is the only methodology which can prepare you for advance notice of the potential whipsaw environment of these corrective structures, it would prudent for you to act accordingly. Too many traders get chopped up in these environments.