A Little Perspective - Market Analysis for Nov 29th, 2017
Some of you may have misinterpreted my analysis from this past weekend. First, even though I had the word “top” in my title, please recognize that the entire title noted that we are “approaching” a top. Moreover, while I was not certain whether we would see the type of rally we got in the SPX, I continually noted that as long as IWM held the 150 region, we had higher targets in sight.
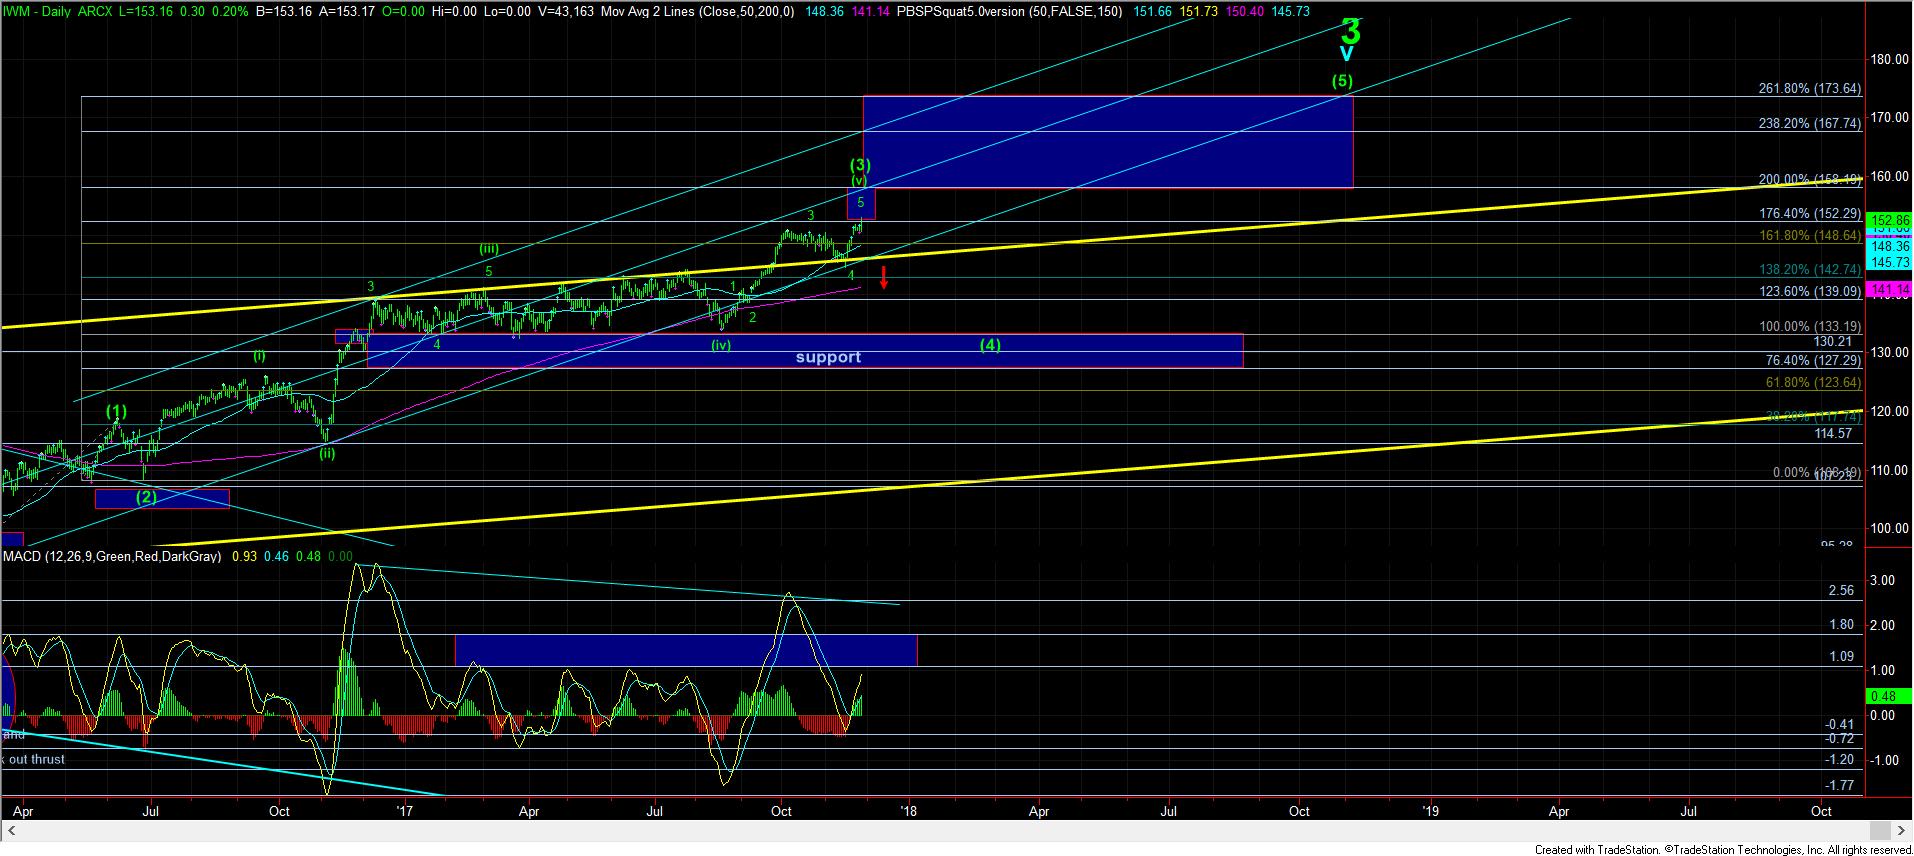
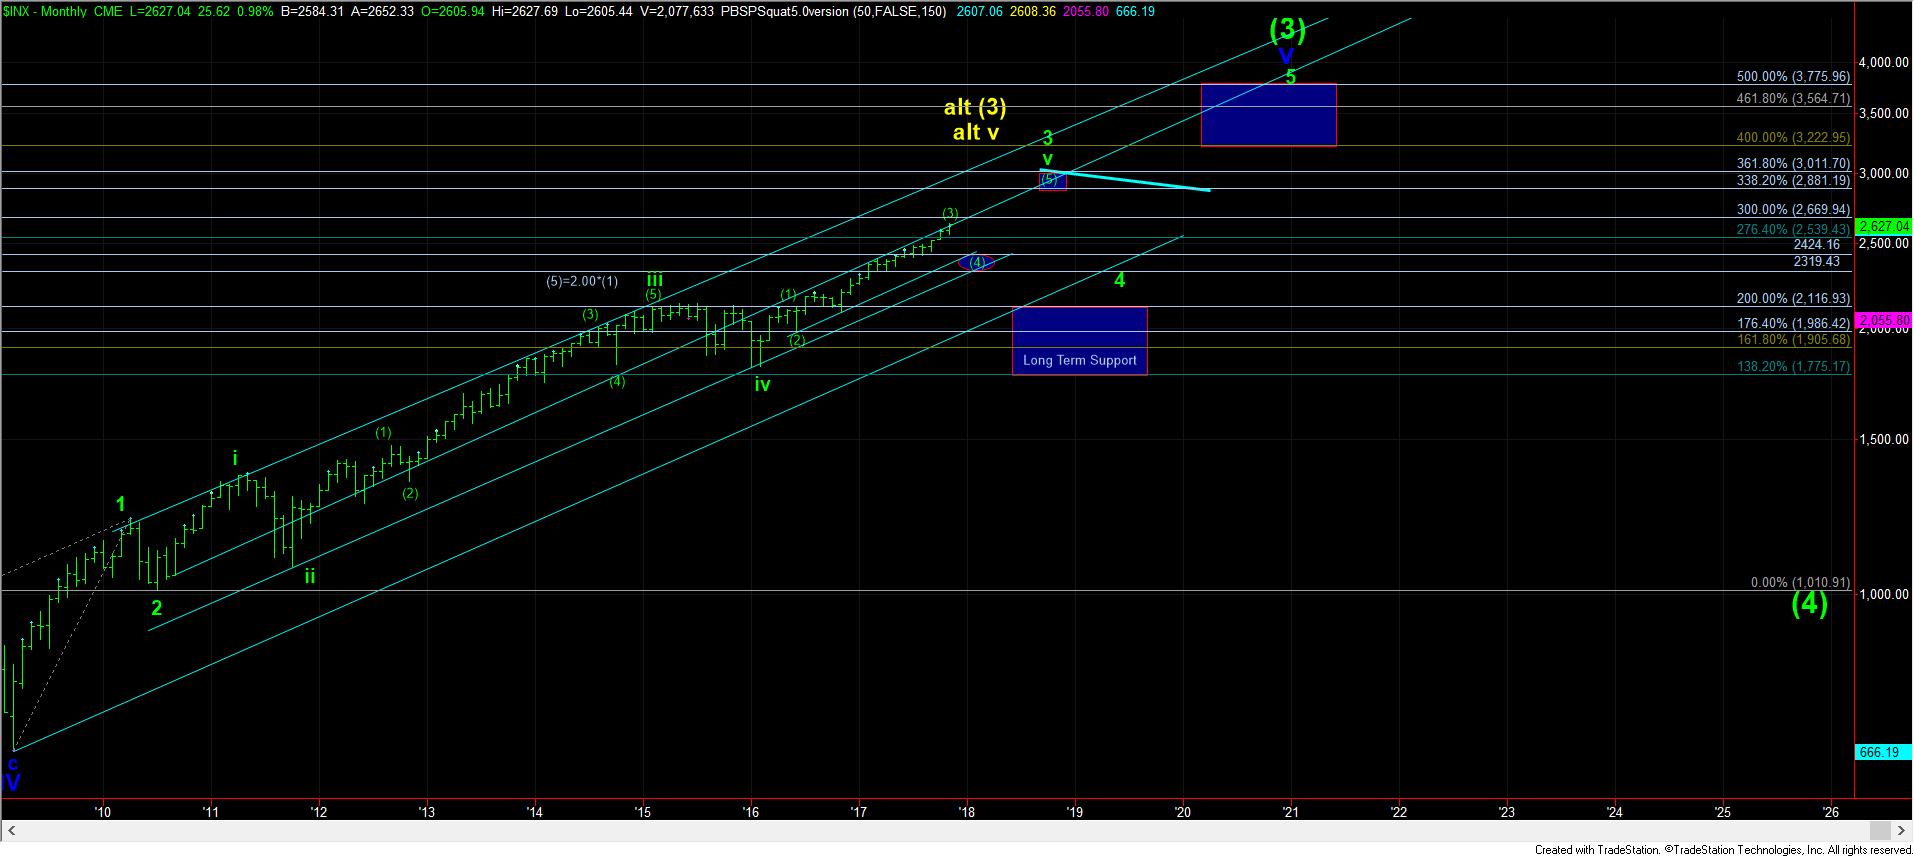
But, my bigger point about us “approaching a top” can be seen from my daily chart of the IWM most clearly. You see, markets do not grow to the sky, just as trees do not grow to the sky. We will see larger degree pullbacks in the market before we continue higher.
So, when I see a 5-wave structure coming to a potential conclusion, then I begin to “look” for a top. And, as many of you know, I have been reticent to believe the market was topping until the IWM completed its final 5th wave in its 3rd wave off the February 2016 lows.
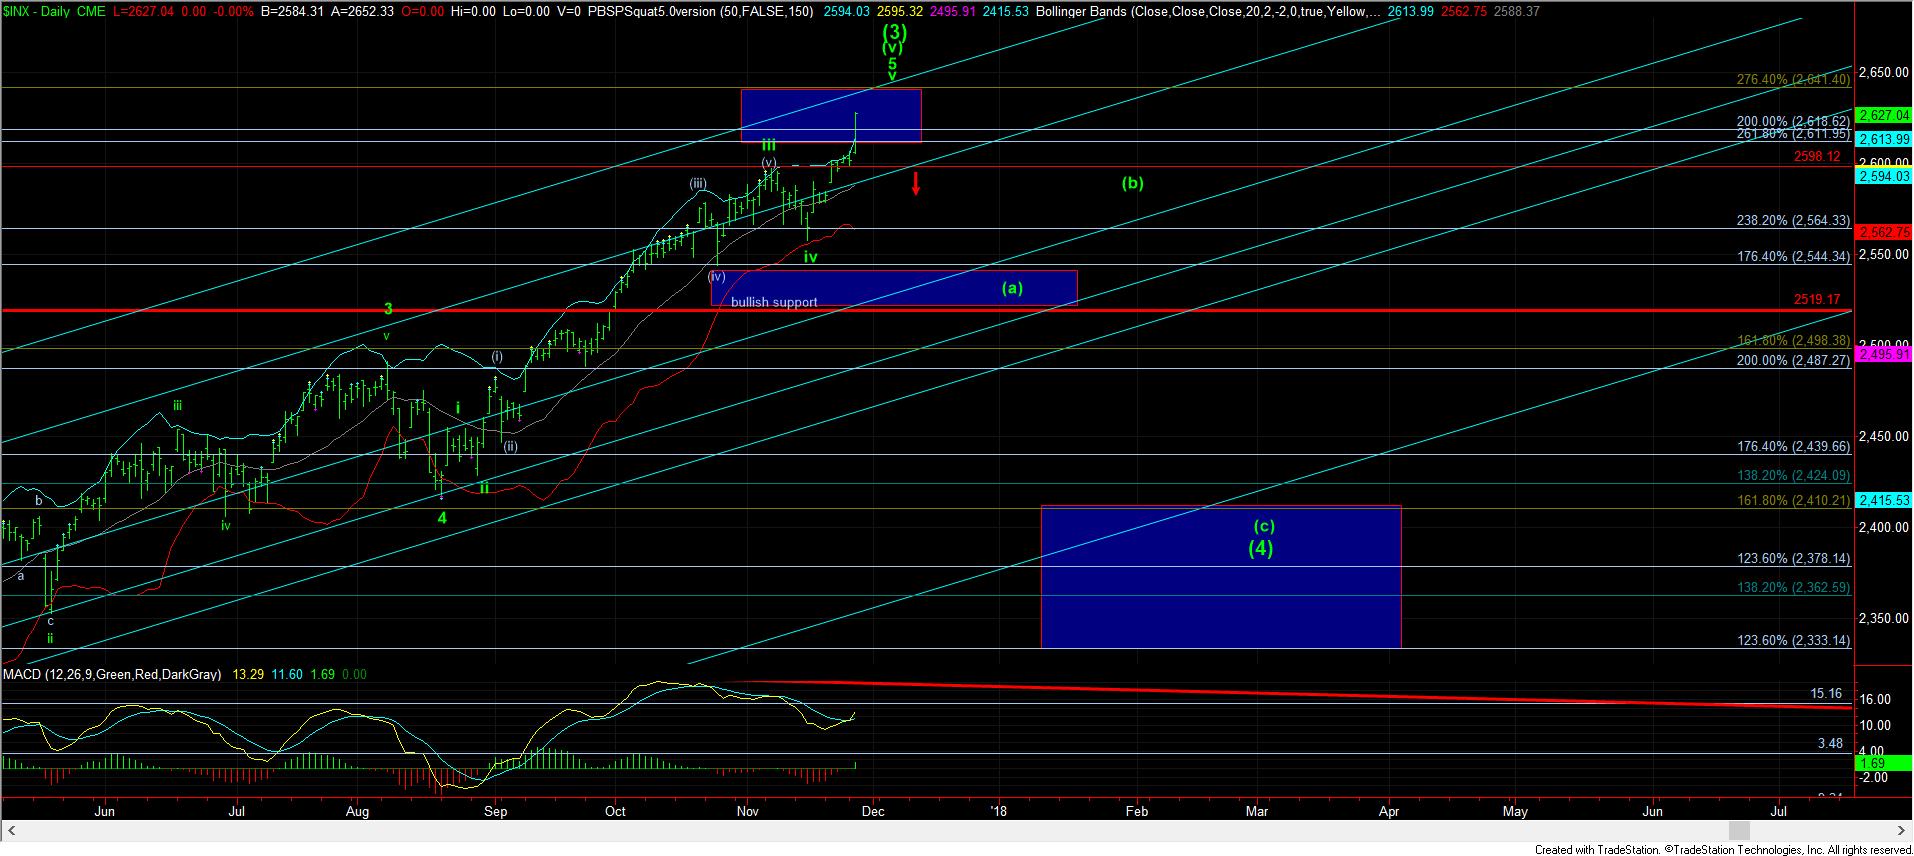
As you can see from the daily chart, we are now coming towards what is likely the final squiggles of that last 5th wave. So, for this reason, I believe it is likely that we are “approaching a top.” But, that does not mean the market has topped, nor has it confirmed a top.
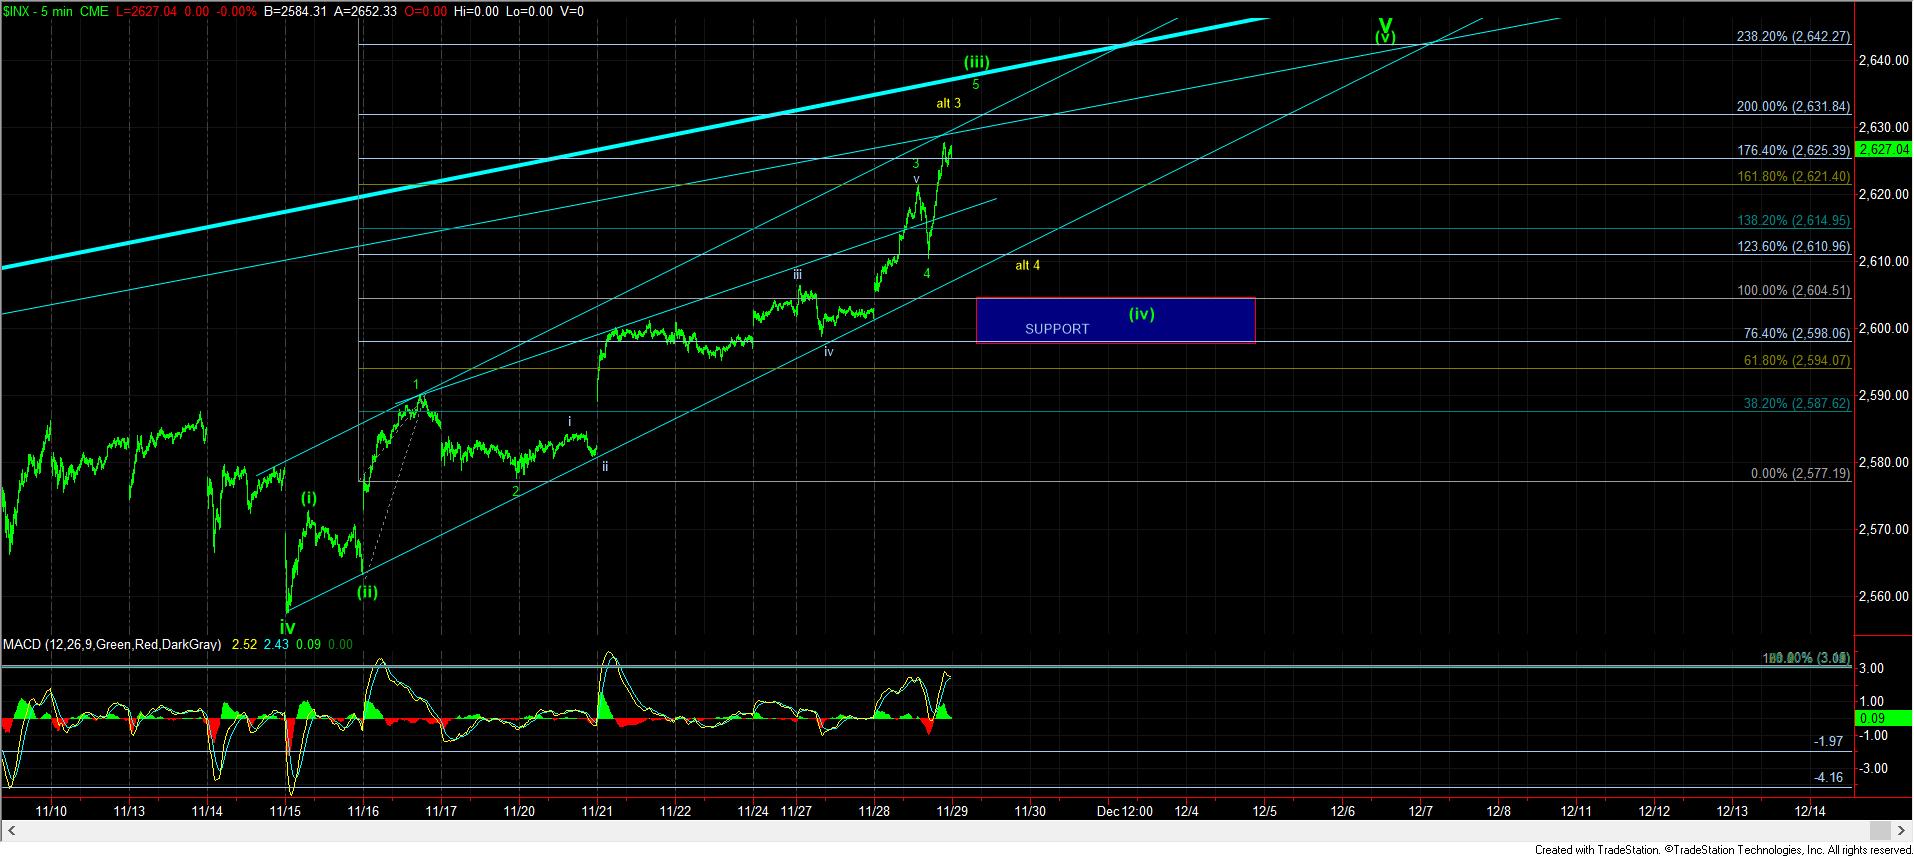
Yesterday’s rally in the SPX certainly made it align a bit better with the IWM chart, and provided us with an upper support region, which, when broken, provides us an initial signal that this 5th wave has likely completed. But, it is clear that the SPX is likely going to stretch towards the 2640 region, and may even push as high as the 2669 region, depending upon how deep wave iv pulls back. And, yes, this is higher than what we expected for wave (3) two years ago, but we have to adjust with the action of the market as it develops, which is why I had strongly urged that people do not aggressively short just yet.
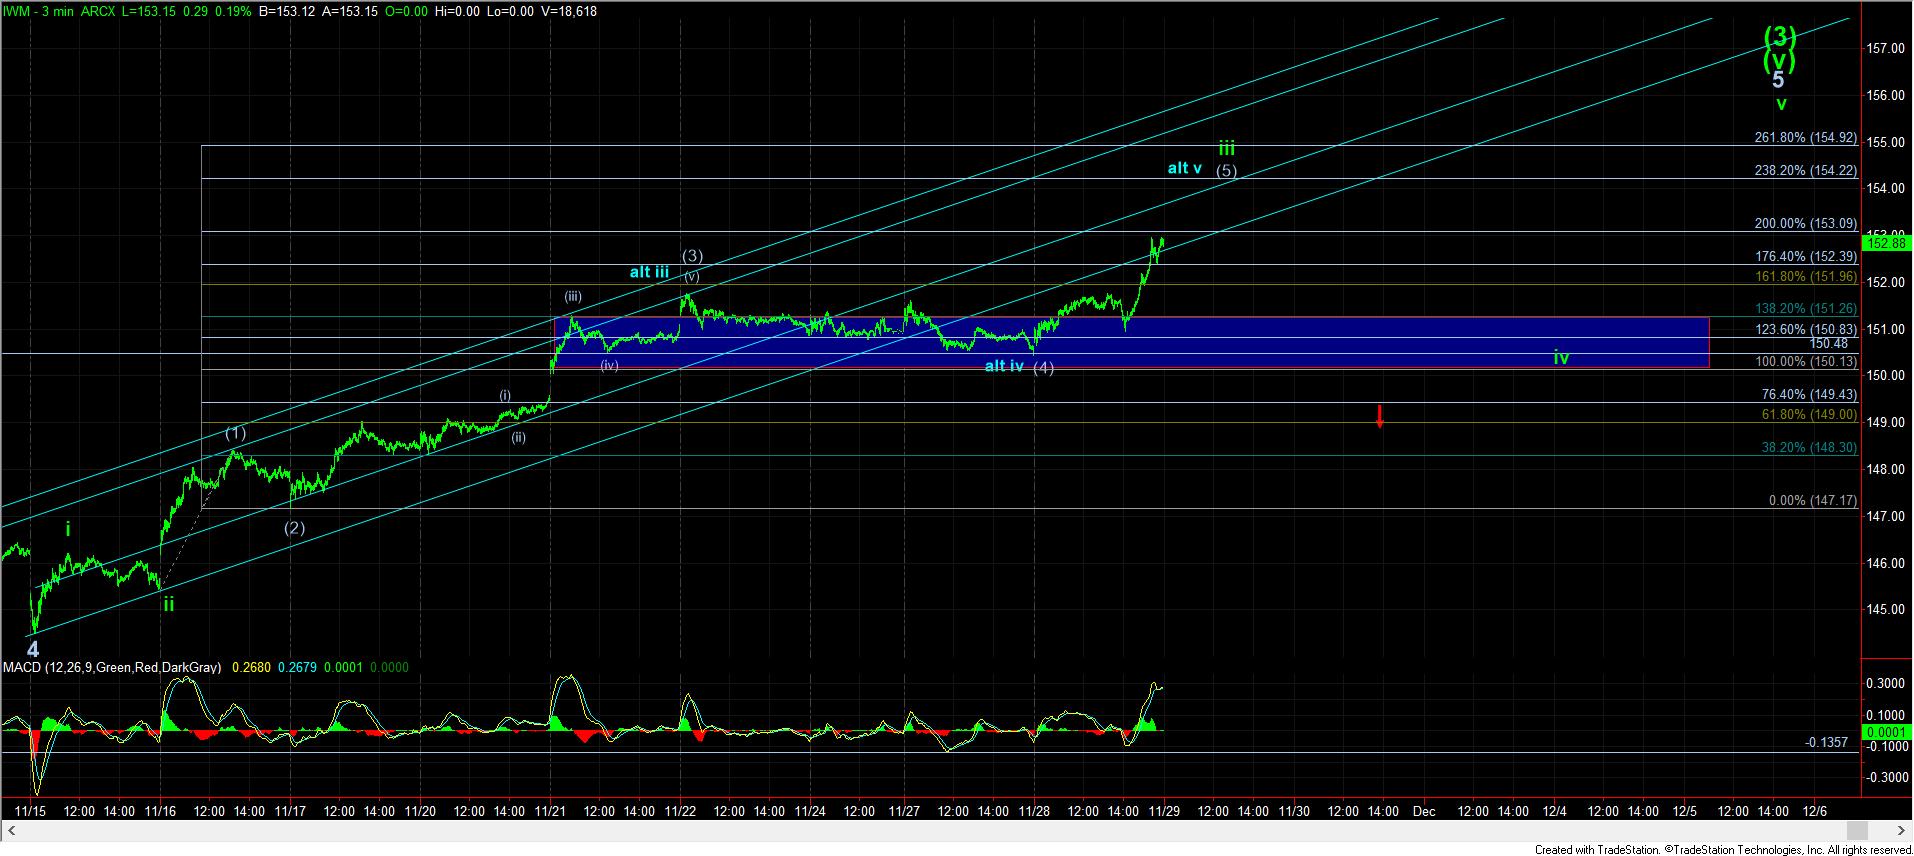
As I have noted before, our support region is in the 150 region in the IWM, and, now, we have the 2598-2605 in the SPX. When both charts break down strongly below those supports, that opens the door to the wave (4) we have been patiently awaiting.
Now, the question running through your mind is how to handle that, and many people will deal very differently with this information. The very aggressive amongst us begin to short the market. While the more conservative amongst us simply lighten up their long-side load. Based upon the survey we did last year of our 3000+ membership, the great majority of you fall within the conservative group. That means that you should likely be looking at lightening up your load. And, I would not suggest any of you even consider aggressively shorting this market until we see a break down below the cited levels above.
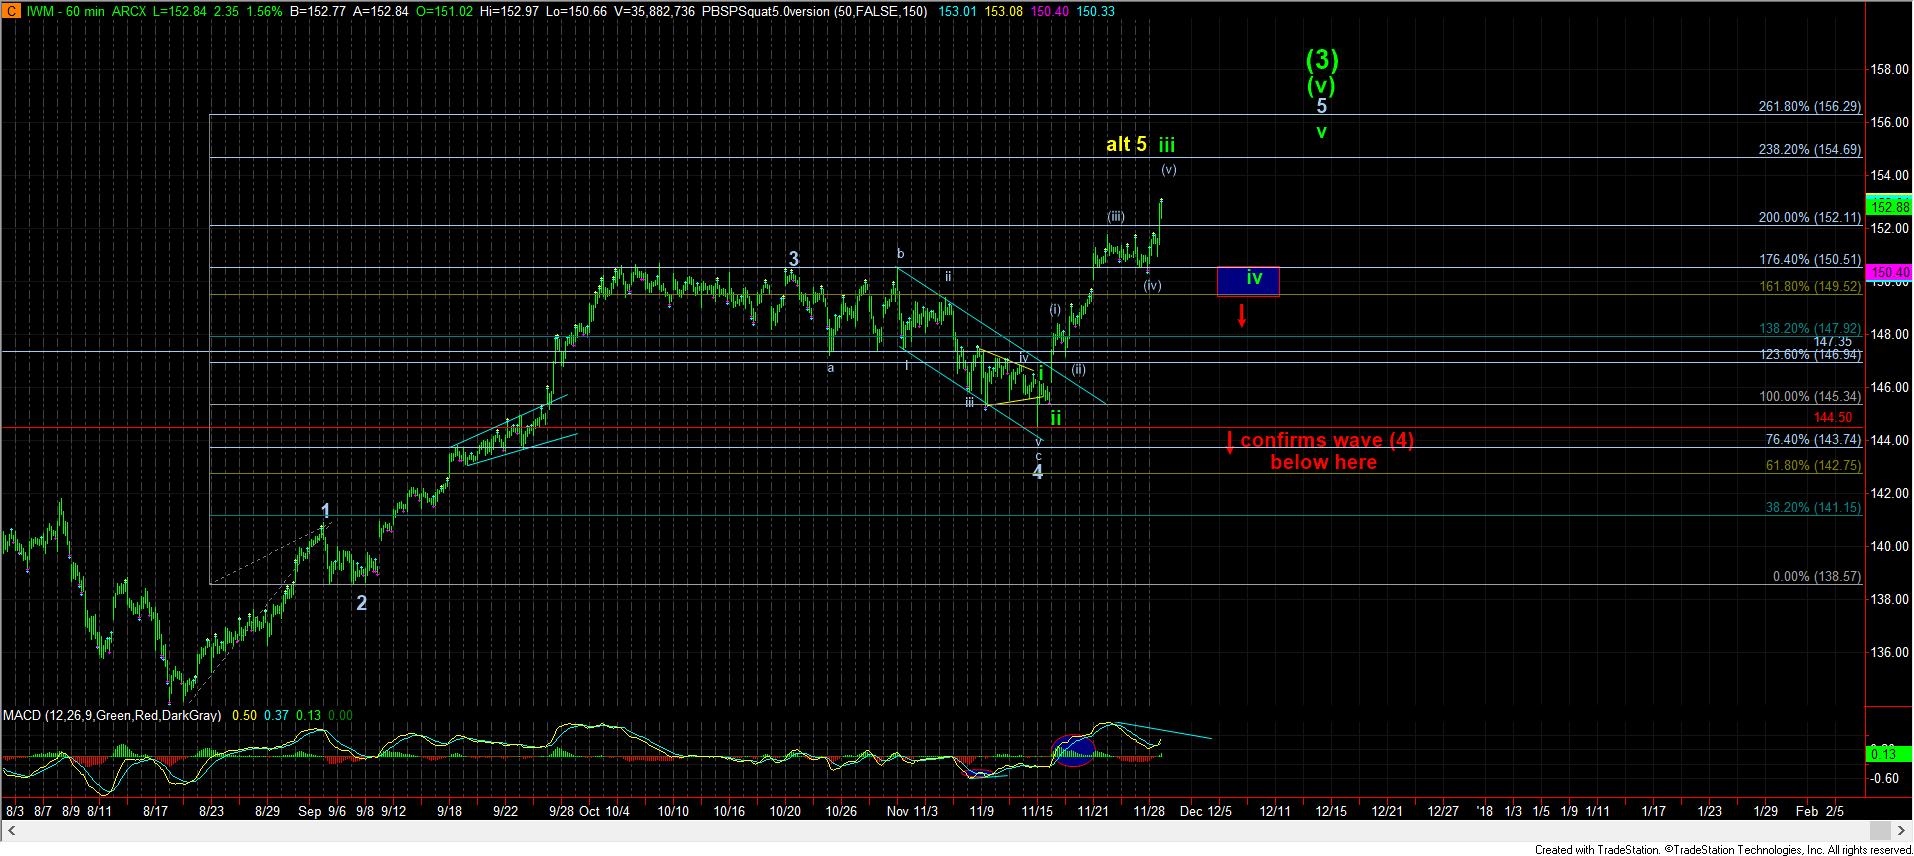
In fact, many of you may not even want to consider shorting until we break below the lows we struck a few weeks ago in the 2550SPX region and the 144.50 region in the IWM. The break down below those levels strongly confirms that we are in wave (4), pointing the SPX back down to the 2330-2400SPX, and 133 in the IWM, levels which are likely unimaginable today.
But, I just wanted to post an update this morning to put the biggest perspective on your radar.