A Lesson In Objectivity
I am presenting this update earlier than normal, since much has changed due to today’s break out.
As we came into this week, my primary expectation was that any rally would be contained within a b-wave structure within a wave [4]. Yet, the market seems to have had other ideas, and has now taken us up through the upper end of the resistance I cited even before we began this rally off the 2191SPX low.
So, what am I supposed to do when the market moves outside of standard resistance? Well, I can tell you that I take the same perspective as John Maynard Keynes:
"When the facts change, I change my mind. What do you do, sir?”
The difference is that I had my alternative count laid out well before we even began this rally, as I continued to note that we may have enough waves in place for all of primary wave 4 as we were bottoming a month ago.
So, to this end, I wrote the following update this morning as an alert:
“I want to make something very clear in this post from the bigger perspective.
When the market was bottoming just below the 2200 region, we were expecting a rally back up to the 2600 region. My initial expectation was that it would be a wave {4). But, I also noted at the time of the bottoming that there is some potential for this to be all of the correction. For this reason, I also noted that I was buying my first long positions with the cash I had available when I raised cash at the end of 2018 in the 2900 region (which I used for the TLT trade we did last year).
I also outlined before we even bottomed that a move through the 2725SPX region would provide us initial indications that the bottom may actually be in. So, even before we bottomed, I had a 125-point region in which the market can prove to me it may have bottomed. So, after the market declined 1200 points, we had a 125-point region within which we were able to maintain a primary bearish bias. But, we also outlined if the market moved through this region, then we would have to switch views. That is where we now stand.
But the main difference is we now have two 5-wave rally structures off the lows. Moreover, the 2nd 5-wave rally is hitting the .618 extension of the initial wave (1)(2) off the lows. This is not typical for a wave (4), but is much more typical for a wave (1)(2)(i)(ii) set up in a bullish structure.
Therefore, I want to make this as simple as possible for everyone. If the market is able to see a sustained break out over 2765, then I am going to adopt the more immediate bullish count, which points us to the 3200 region for wave i of 5.
However, if the market breaks out over 2765, and then breaks back down below 2700, then I am going to be looking for that dreaded lower low. That means a break down back below 2700 in this instance would suggest that we say a higher rally in wave (4) within an ending diagonal for the c-wave in wave 4, and I am going to target 2060 again.
Now, I know many of you are coming to read this with your own biases - some of which are bullish and others are bearish. I really do not want to argue with any of you regarding your underlying reasoning for maintaining your bias. But, I want to be clear that for me it is all about the structure. So, you will not hear “stories” from me about bullish or bearish perspective. I am simply looking at the structure in the most objective manner possible.”
So, with the market potentially providing us and following through on a bullish set up, I simply cannot fight it. Nothing good ever comes of that. Rather, I am going to let the market continue on its path until it proves otherwise now. What I “believe” or “want” or “feel” really matters not. What only matters is price action. And, should price action break out through 2765SPX on its way to 2860SPX, then the market is going to have to prove that is a fake-out move to me by breaking back down below 2700SPX.
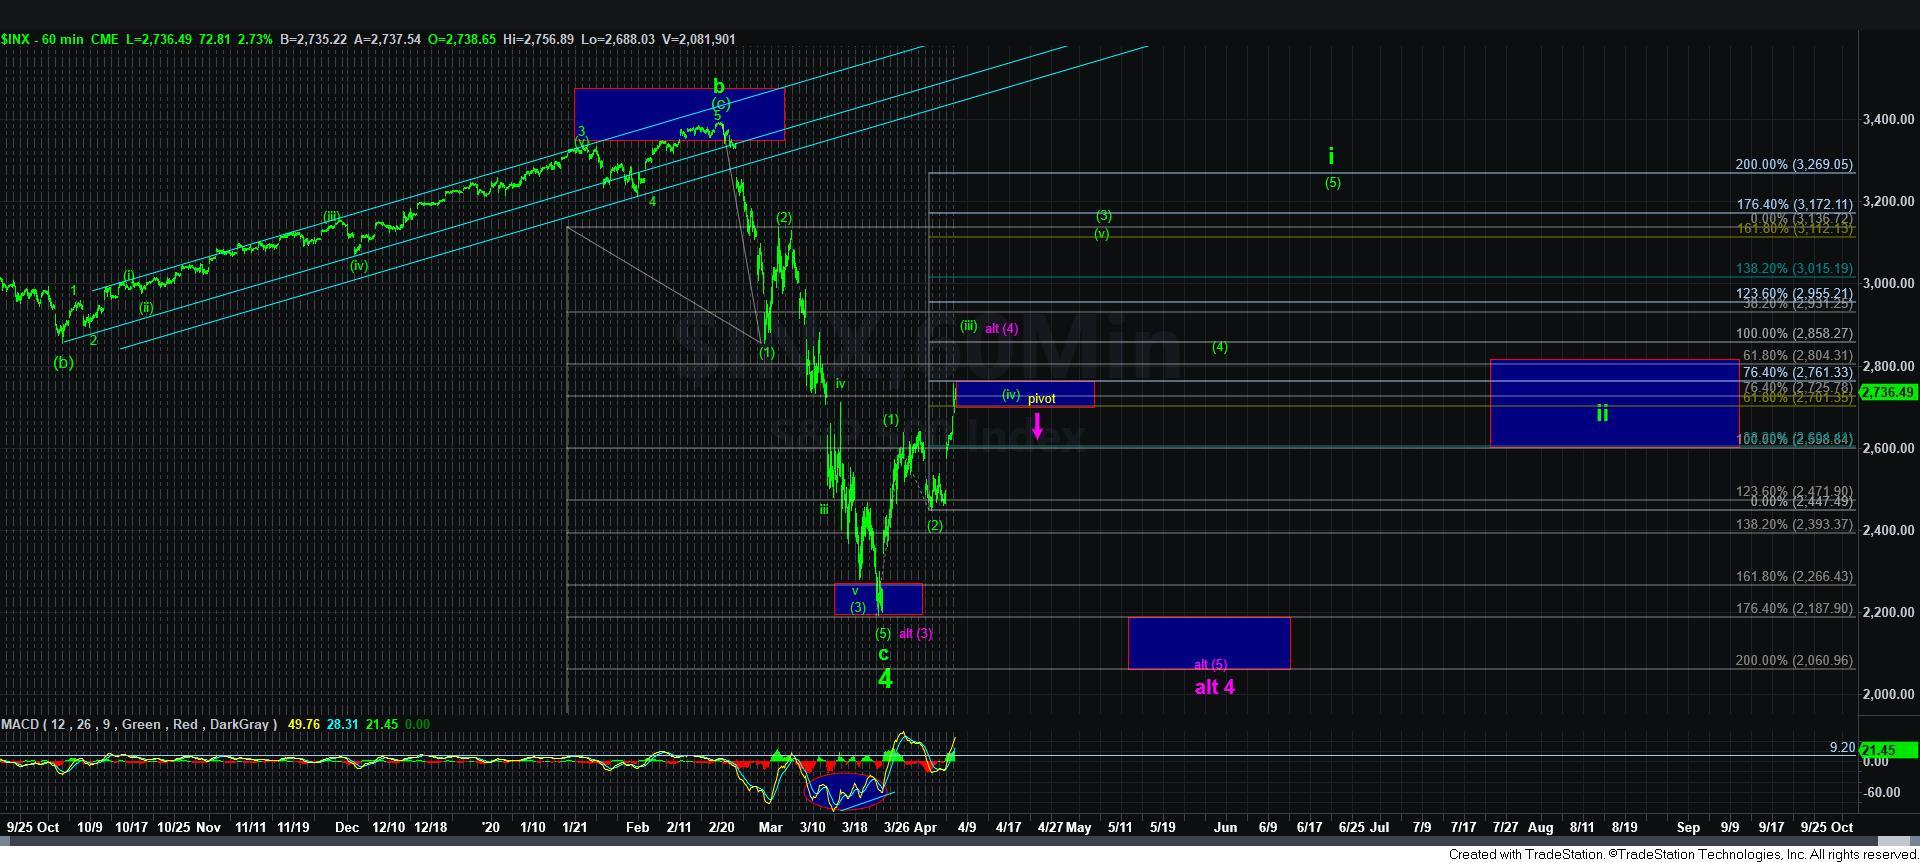
If you would please follow my thinking while looking at the 60-minute SPX chart, then this exercise in Fibonacci Pinball will be a lot easier. In the more bullish count, wave [iii] of [3] targets the 1.00 – 1.236 extensions of waves [1] and [2]. From there, we see a pullback in wave [iv] of [3] that takes us back down to the .618-.764 extensions of waves [1] and [2] – which is why I label it a market pivot. Therefore, once the market reaches the 2860SPX region – the 1.00 extension – it must not break back below the 2700SPX region (the .618 extension) on the ensuing wave [iv]. For if it breaks below that support, it strongly suggests that the impulsive count is likely going to break down.
In our case, a break down of that pivot from the wave [iii] target zone would suggest that the rally high was actually a much more extended wave [4] (presented in purple) within an ending diagonal for this c-wave of primary wave 4. Therefore, I would have to again be targeting the 2060SPX region for wave [5].
However, if the pullback from wave [iii] is clearly corrective and it holds the market pivot support box, then we will likely set up to rally towards the 3000-3100 region to complete wave [v] of [3], and we are likely well on our way to completing wave i of wave 5 as we head into the summer.
And, for one last note on the matter, Luke Miller’s Bayesian analysis methodology now quantifies the probabilities that wave 4 has completed at 67%. So, we are seeing the probabilities shift as the market seems to be poised to head higher.
So, of course, this leads to questions about positioning for wave 5.
For those that have been tracking our analysis for the last several years, you may have seen me note in our trading room that I raised cash when the market broke below the 2900 region back in late 2018. Since then, I deployed that cash into the TLT long trade we outlined in November of 2018. And, when I cashed in that trade, it has been sitting as cash.
When we were approaching the lows in March, I noted that I was buying an initial tranche of longs as per my own plan of starting to buy at what I think is the bottom of the wave 3 of the c-wave. I then will wait for the bottom of wave 5 to buy a second tranche, and I then round off my position with a third tranche at the bottom of wave ii of the next 5-wave rally structure. In our case, that would be the yellow wave ii on the 60-minute chart which is estimated to be seen sometime in late summer or the fall.
Since I have only been able to buy my first tranche if we do not get a 5th wave lower, then I will either attempt to buy it at the wave [iv] corrective pullback, with a stop just below 2700SPX, or the wave (4) within wave i, or I will simply wait for the rest of my positioning for that wave ii pullback. So, the market will give me several other opportunities to layer in for a rally to 4000+. This is my own plan and how I handle the contingency when the market does not give me a 5th wave as I initially expect it. I hope this helps those of you that are trying to position for that final 5th wave that I expect in the coming years.
As far as the micro structure right now, 2500-2550 is support, with 2765SPX our next resistance overhead. As long as we remain over support, I am now going to expect us to run to 2860SPX. It would take a break of 2500SPX to suggest that 2060 becomes a target sooner rather than later. And, again, should we rally up to 2860SPX, then 2700 becomes the most important support for the coming weeks.