A Good Start - Market Analysis for Sep 3rd, 2020
There is an old joke that asks: “What do you call 100 lawyers at the bottom of the ocean?” - with the answer being “a good start.” And, when we see a 4% decline in a single day from an all-time high, I would say that is a good start as well.
I think this is a good point to ask yourself: “what was the “cause” of this 4% decline in a single day?” And, if you are reading the pundits, it is due to a jobs report which just about met expectations. So, if you hear that giggling in the background, that is me. (smile) I really hope you are at least starting to see just how ridiculous it is to follow the financial news.
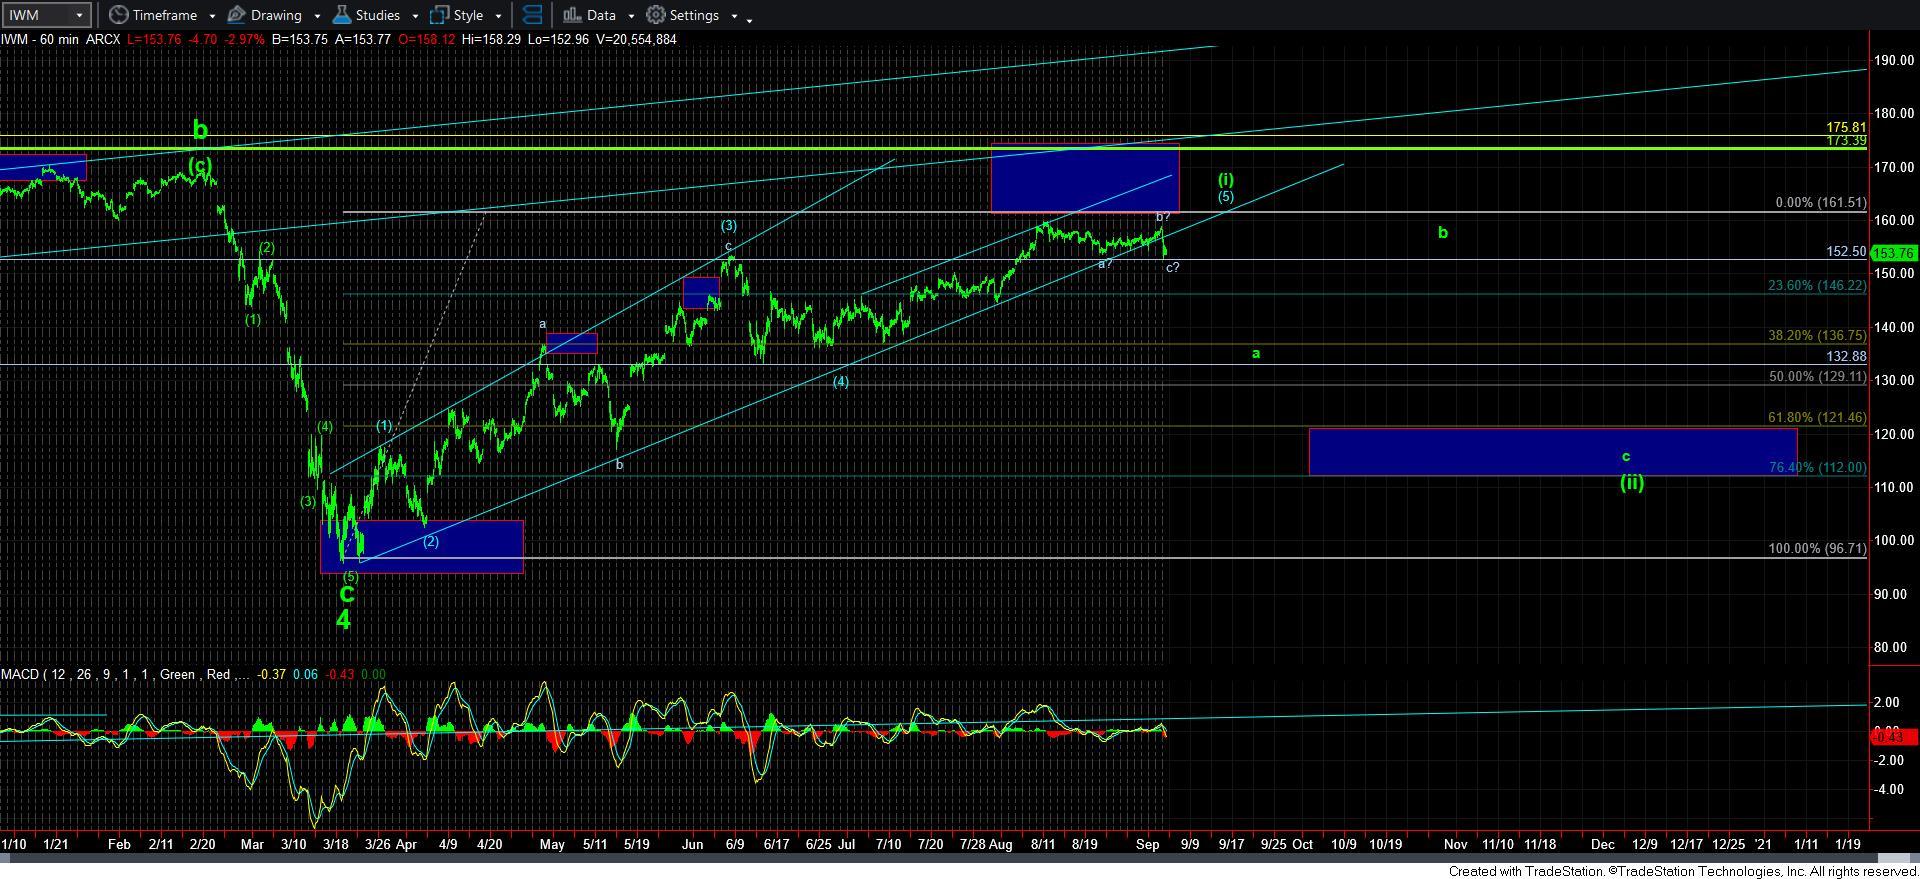
Moving onto the market, I know you want me to give you absolute certainty that the correction has indeed started, but what has been nagging me this entire time is still nagging me – The IWM. While we have broken below the supports that would suggest the market was trying to get that 5th wave higher over the last week or two, there is one back door potential which can still leave the door open to get to that higher high. And, I am going to need to lock that door before I am going to give you the “all-clear.”
When we look over at the IWM chart, you will see that there may be good reason as to why the IWM had been meandering as it has over the last month. There is potential for this meandering to have been an a-b-c sideways corrective pattern for a bigger wave 4. While we have clearly broken the uptrend channel at this point in time, I really do not consider that dispositive to us having begun the correction. So, with the a=c point being the 152.50 level, I am simply going to have to let the market break that support to put the nail in the coffin for any near term higher highs yet to be seen.
In the mean-time, I am going to assume that the top is in place for the rest of this analysis, as long as you promise to recognize that there is still some potential for the IWM to see a higher high, while not necessarily meaning that the SPX will do so as well.
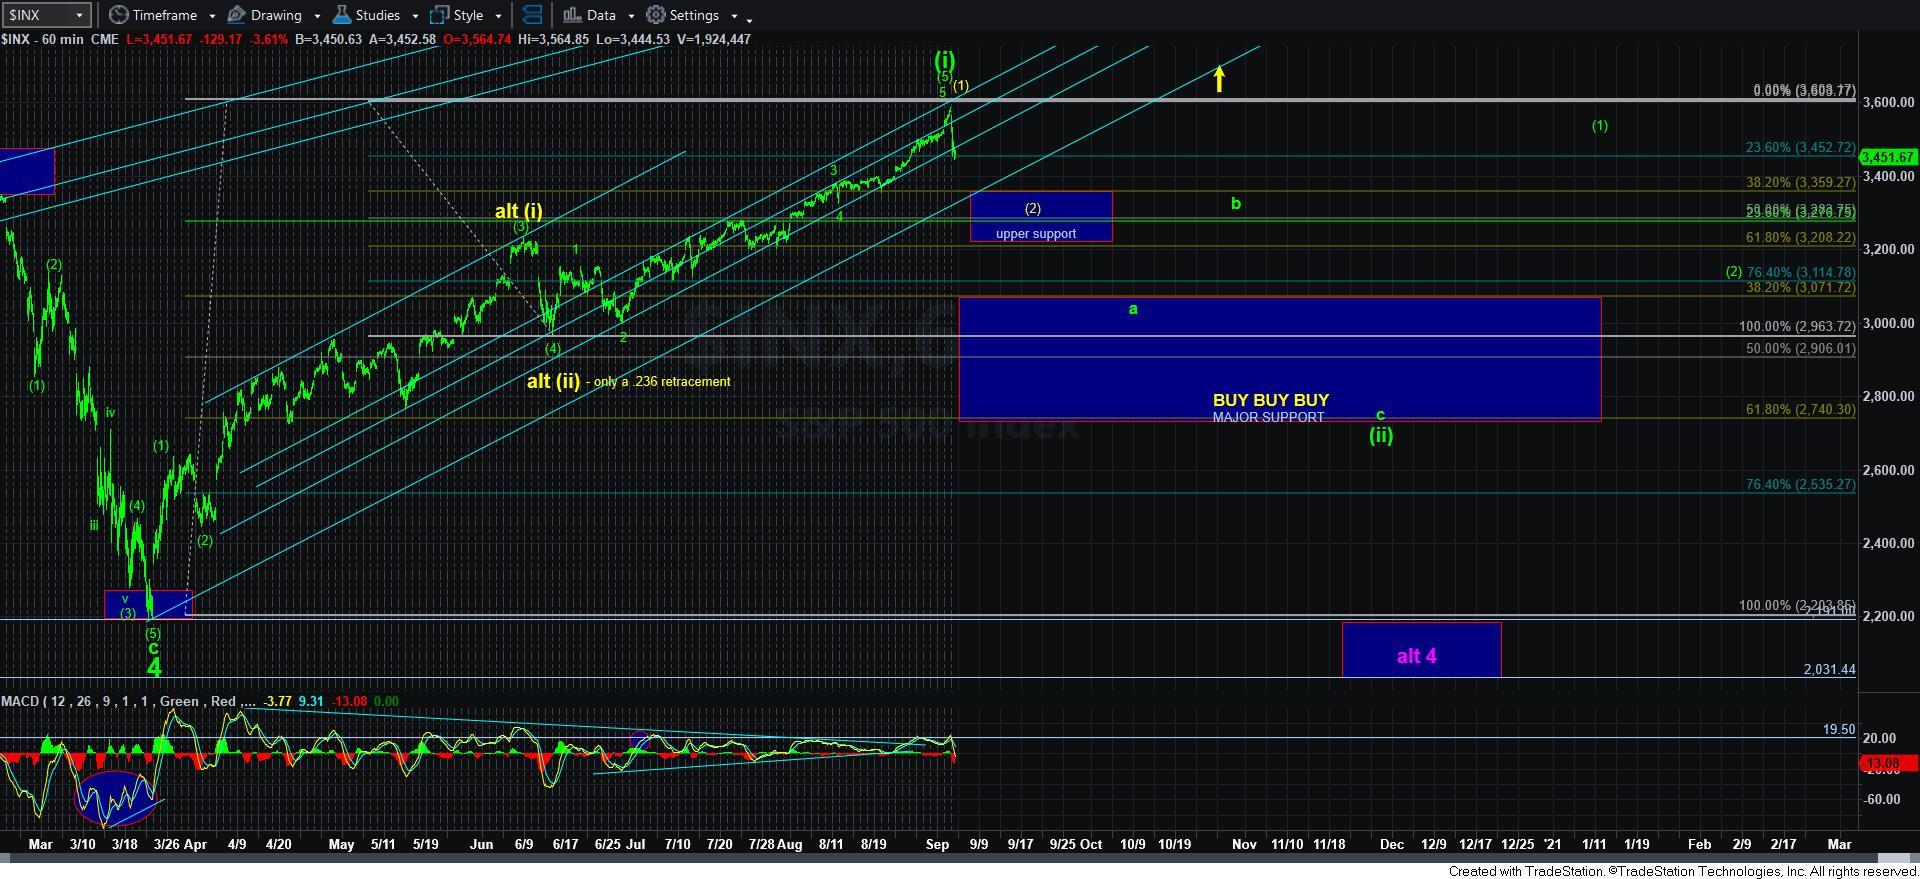
With the potential that we have now completed the 5-wave rally off the June SPX low, everyone is questioning whether we have actually begun wave [iii], rather than just completing wave [i]. My primary count remains that we have completed wave [i], but I do not maintain it blindly.
As you can see on the attached 60-minute SPX chart, I have outlined an upper support region, which NOW represents the retracement potential for the yellow wave [2] in the yellow alternative count. That region is the .382-.618 retracement of the June rally, which is in the 3200-3360SPX region. In both the primary and the alternative case scenarios, the market will likely be heading down to that region before we see any further “bullish” attempts.
If the rally off that upper support is CLEARLY impulsive, then I will have no choice but to alert you to the potential that the alternative count has gained in probability, and a break back out over the 3600SPX region will confirm we are on our way to 4000-4250 for wave [3] of [iii]. But, those are a lot of “ifs” the market has to prove, which, for now, will keep this as my alternative count, which the market will have to prove.
In the meantime, I want to refresh your recollection that as we move into a wave [ii] retracement, it is one of the corrective waves. And, while I think we have much more guidance for us on this 2nd wave relative to a 4th wave, it will not be too much easier to navigate this corrective decline than it would a 4th wave. So, as I have said in the past, attempting to navigate a corrective structure is akin to attempting to throw jello for distance, I would say that it may be a bit easier since this is only a handful of jello. (smile)
For now, since we do not yet know exactly how the market is going to trace the path to 3360, I am going to remain patient and allow the first bounce to materialize before I begin analyzing the potential paths to 3360SPX next.
Lastly, I am going to be watching that 152.50 level VERY carefully in the IWM to see if the IWM attempts an impulsive rally off that support to keep that door open for that dreaded higher high. Otherwise, should see a sustained break of 152.50, then we should all be on the same page.