A Few Additional Thoughts As The Market Grinds
here are several posts I made today that I would like to reprint in this afternoon’s market update:
“While our EW/Fib Pinball analysis can hit some crazy targets, one of the benefits of the analysis is that it provides market context. And, I have been trying to explain, there are several things we know from this context:
1 - Whipsaw will remain until the market clearly completes 5 waves down and sets up the 1-2 downside structure for the c-wave.
2 - Whipsaw will remain as there is still potential for a higher b-wave in dark green.
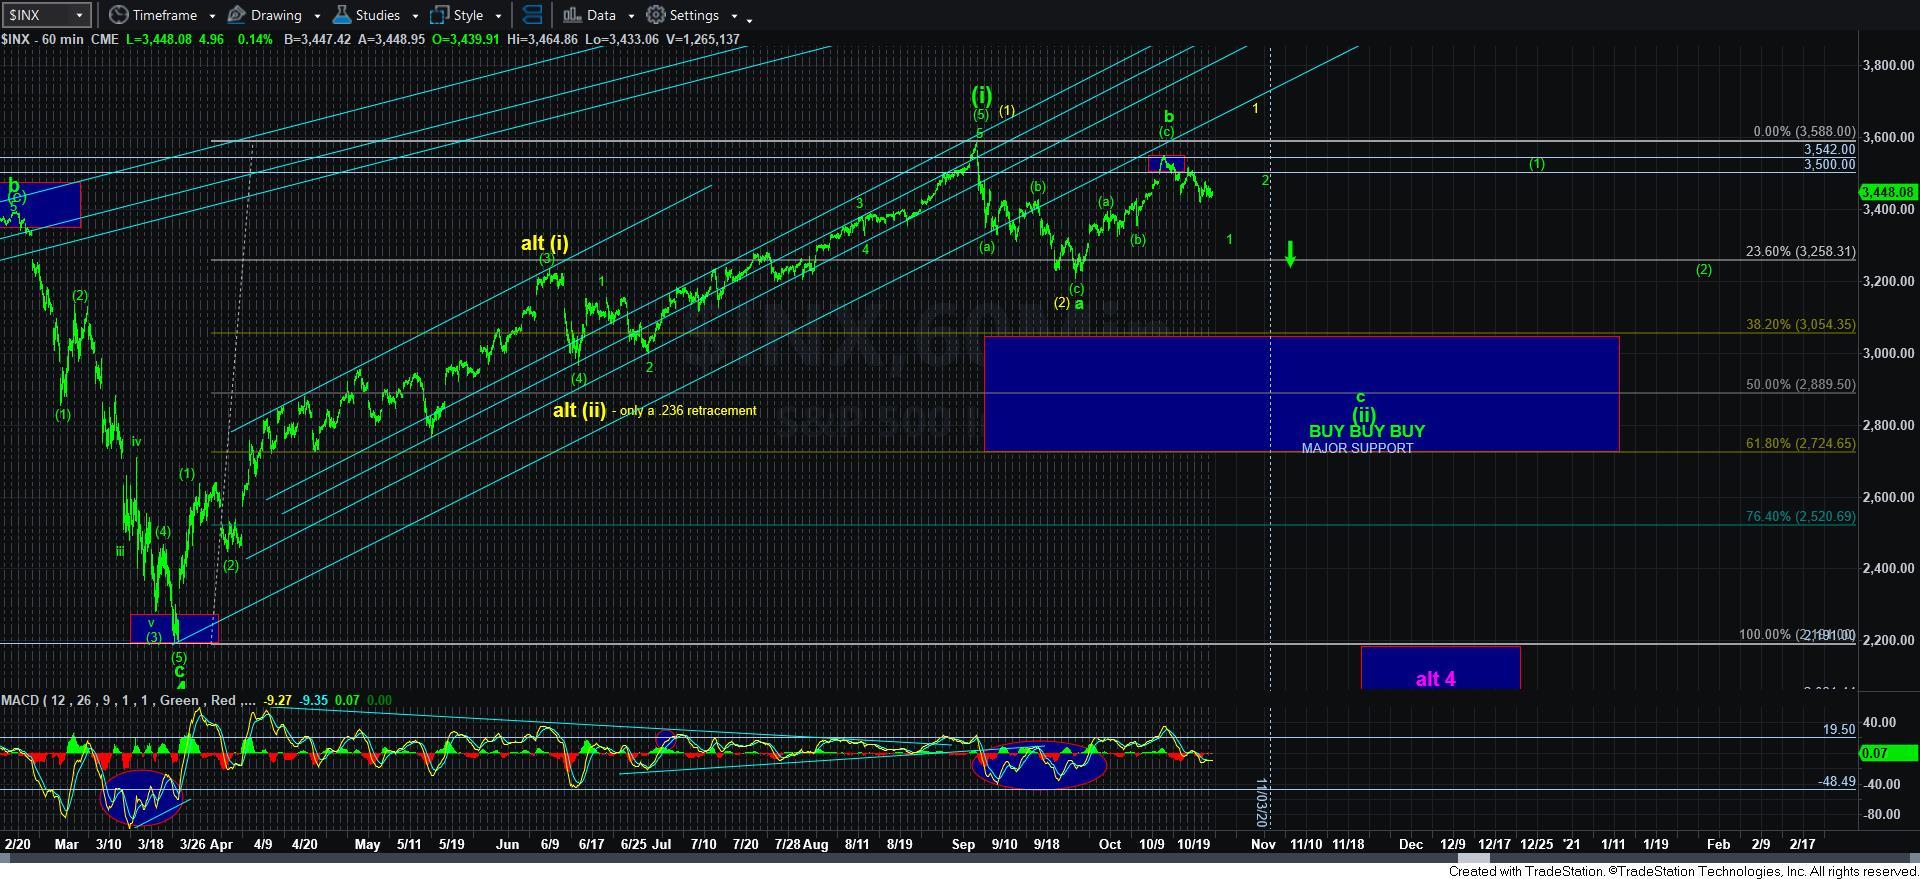
3 - We are LIKELY still setting up the c-wave down into November.
In the meantime, until the market settles out its near term structure, whipsaw will still be with us for a bit longer.”
“Folks, if you feel as though you are being whipsawed, there is a reason. All the waves are coming in 3's right now, so it does not allow for much in the way of trending moves. And, because they are coming in 3's it allows for several interpretations as to how this can resolve in this region.
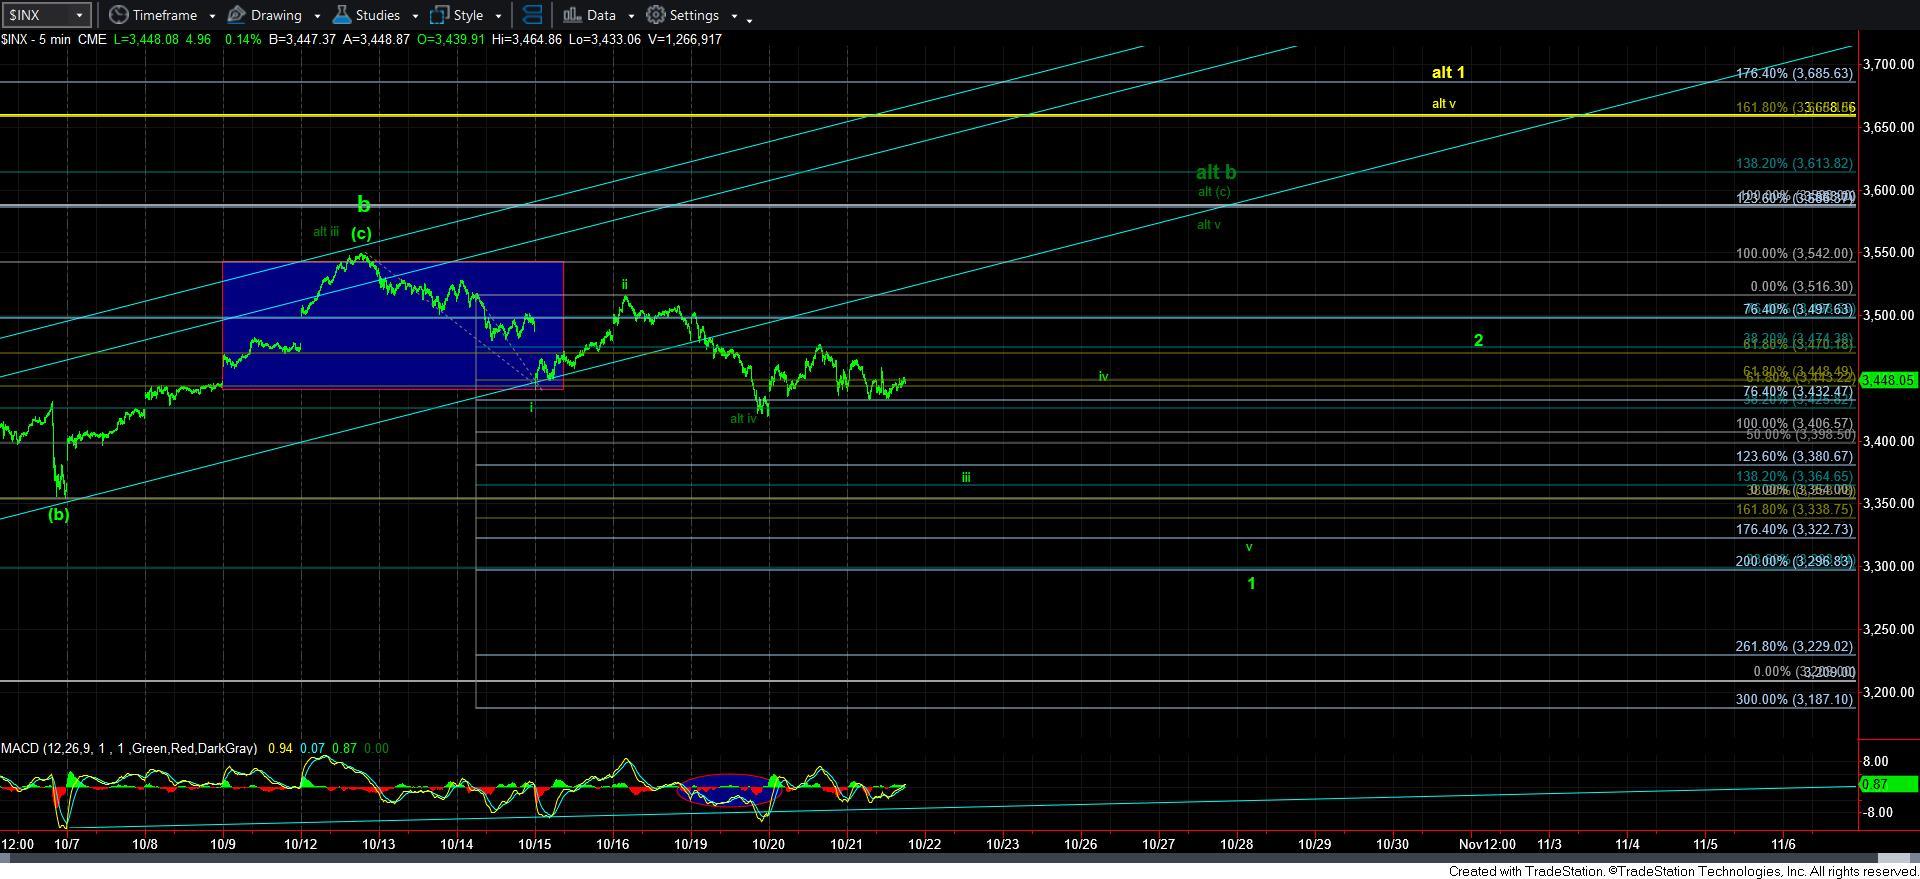
While we have been catching the smaller turns rather consistently, I still want to warn you that will not have a higher probability pattern in place until we complete a bigger degree 1-2 in green. So, as long as we hold over the 3300SPX region, that is my expectation. Alternatively, the 3's leave the door open for one more higher high in the b-wave in dark green.
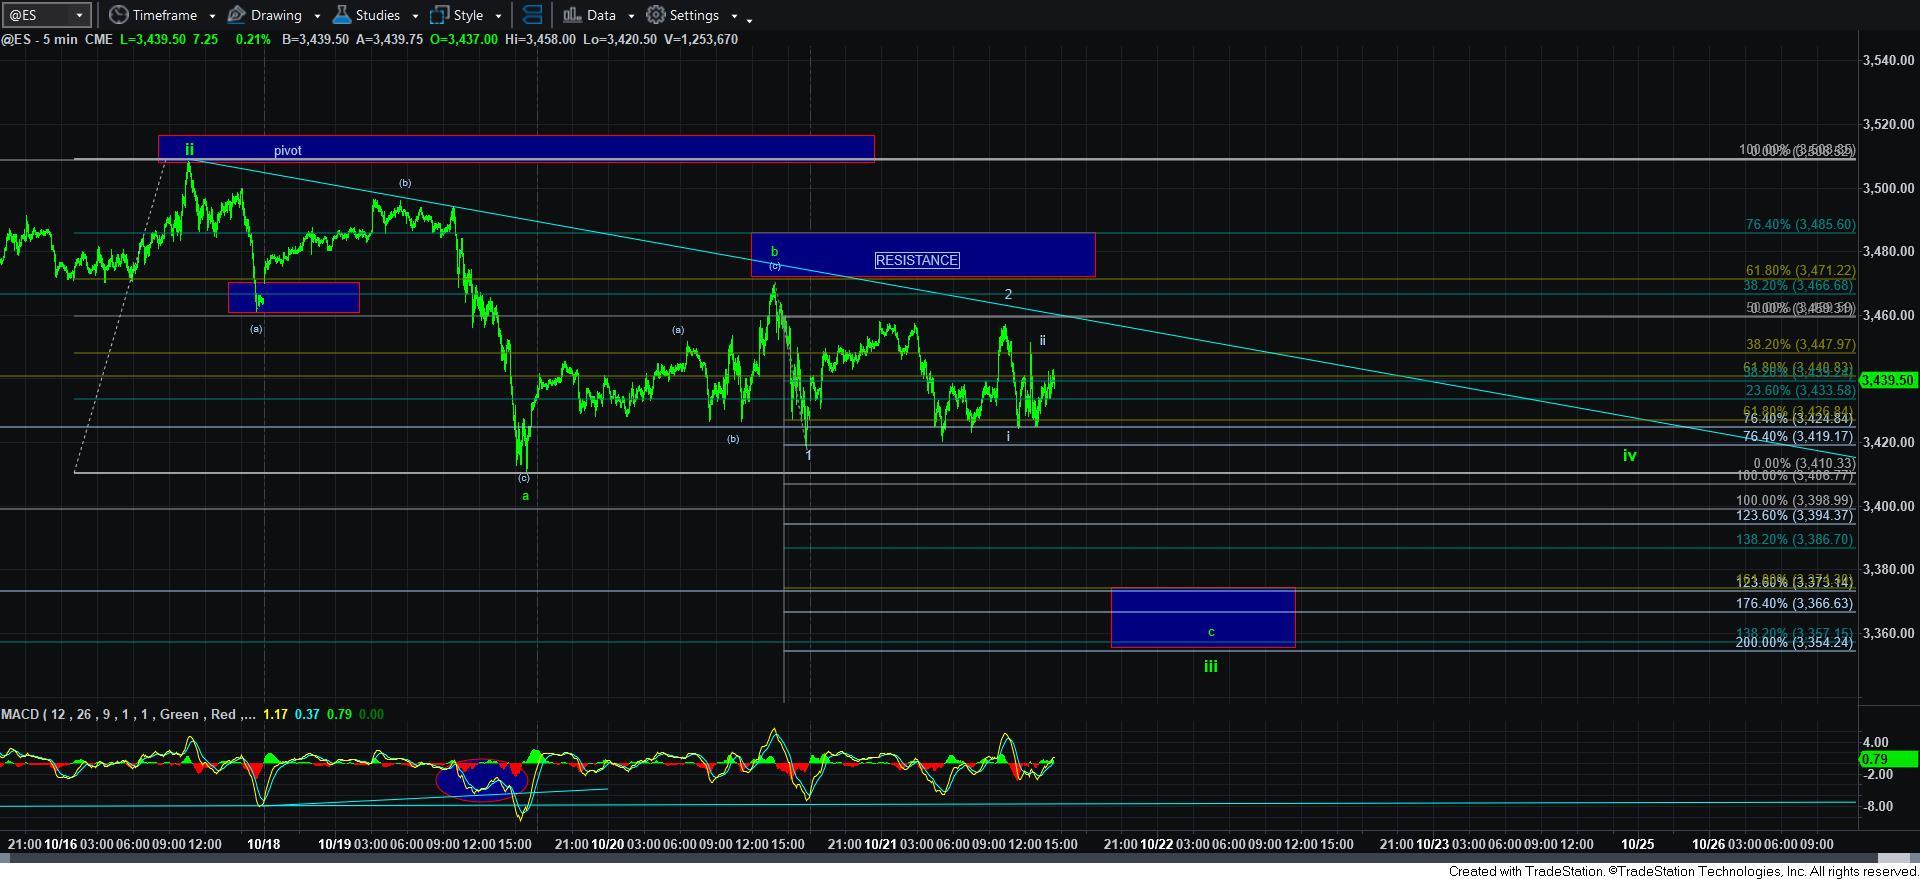
Ideally, wave 1 should take us to a target in the 3320/30SPX region, with the wave iii of 1 taking us to the 3350-70ES reigon, as you can see on the attached ES chart.
Just recognize the environment you are in if you are trying to trade this.”
When taken together, where does this now leave us?
Well, as long as we continue to respect the high struck in yesterday’s rally, we have a downside set up pointing to the 3350-3370ES region. However, if we move through it, then the resistance overhead between 3470-85ES will be quite important. You see, if we are able to move through that resistance from here, it begins to increase the probability for the dark green larger b-wave, suggesting one more higher high before the b-wave completes. For now, I see that as the lesser probability.
The other question which I have gotten asked a lot is when do we take that alternative dark green b-wave off the charts? And, I thought my analysis outlined that answer, but let me state it again. In order to have a higher probability that we have begun the c-wave down, we need to see a 5-wave leading diagonal structure complete down into the 3320/30SPX region. Until that happens, the alternative dark green b-wave is still going to remain on the chart.
So, my primary expectation remains that we will likely see a c-wave down into the 2900-3050SPX region. I have not seen anything to suggest anything pointing us to the 4000+ region before we see that drop. Therefore, I maintain my primary expectation for that c-wave decline into November. But, for now, I simply do not have a clear set up for it.