A Continued Mess - Market Analysis for Nov 30th, 2020
With the market providing us with an overlapping structure for 3 weeks now, it has not provided us with any smaller degree clarity as to its next directional move. While my preference remains to see more of a pullback, I really do not have a clearly defined set up to which I can point with confidence.
So, it reminds me of something Frost & Prechter noted in The Elliott Wave Principle:
“Of course, there are often times when, despite a rigorous analysis, there is no clearly preferred interpretation. At such times, you must wait until the count resolves itself. When after a while the apparent jumble gets into a clearer picture, the probability that a turning point is at hand can suddenly and excitingly rise to nearly 100%.”
So, with the picture rather unclear in the micro structure, and unable to clearly define yet how deep this pullback will take us, I will try to outline the details as to what we know from an EW perspective in this update.
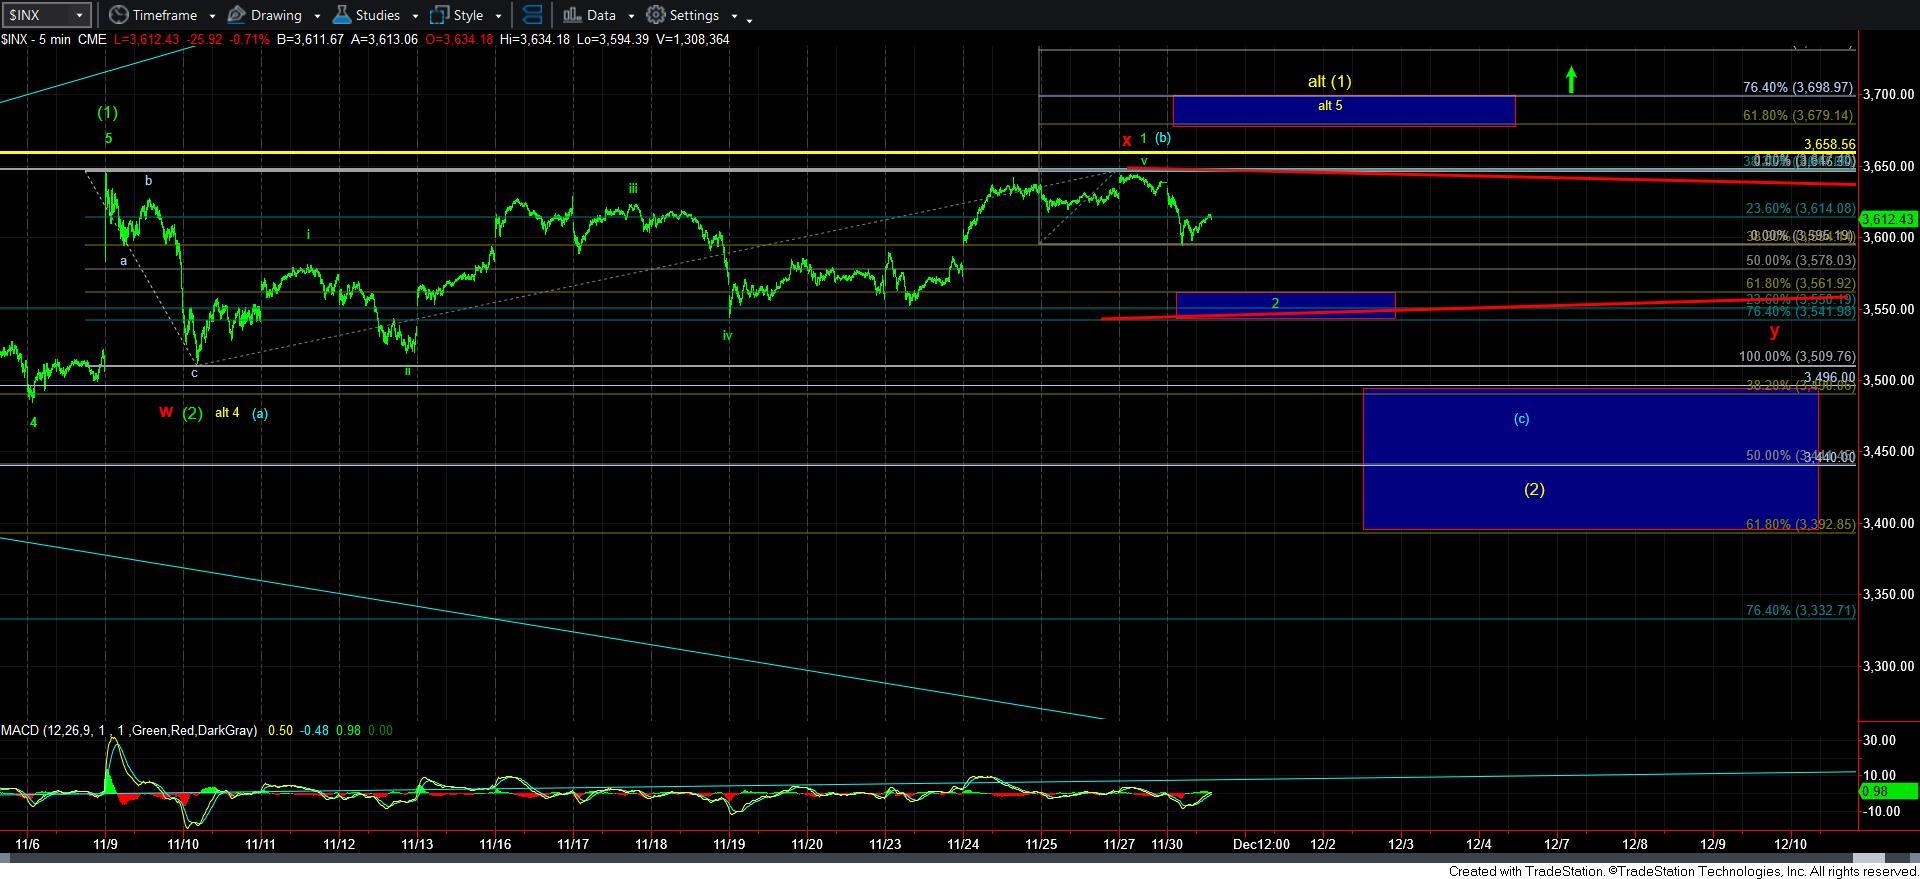
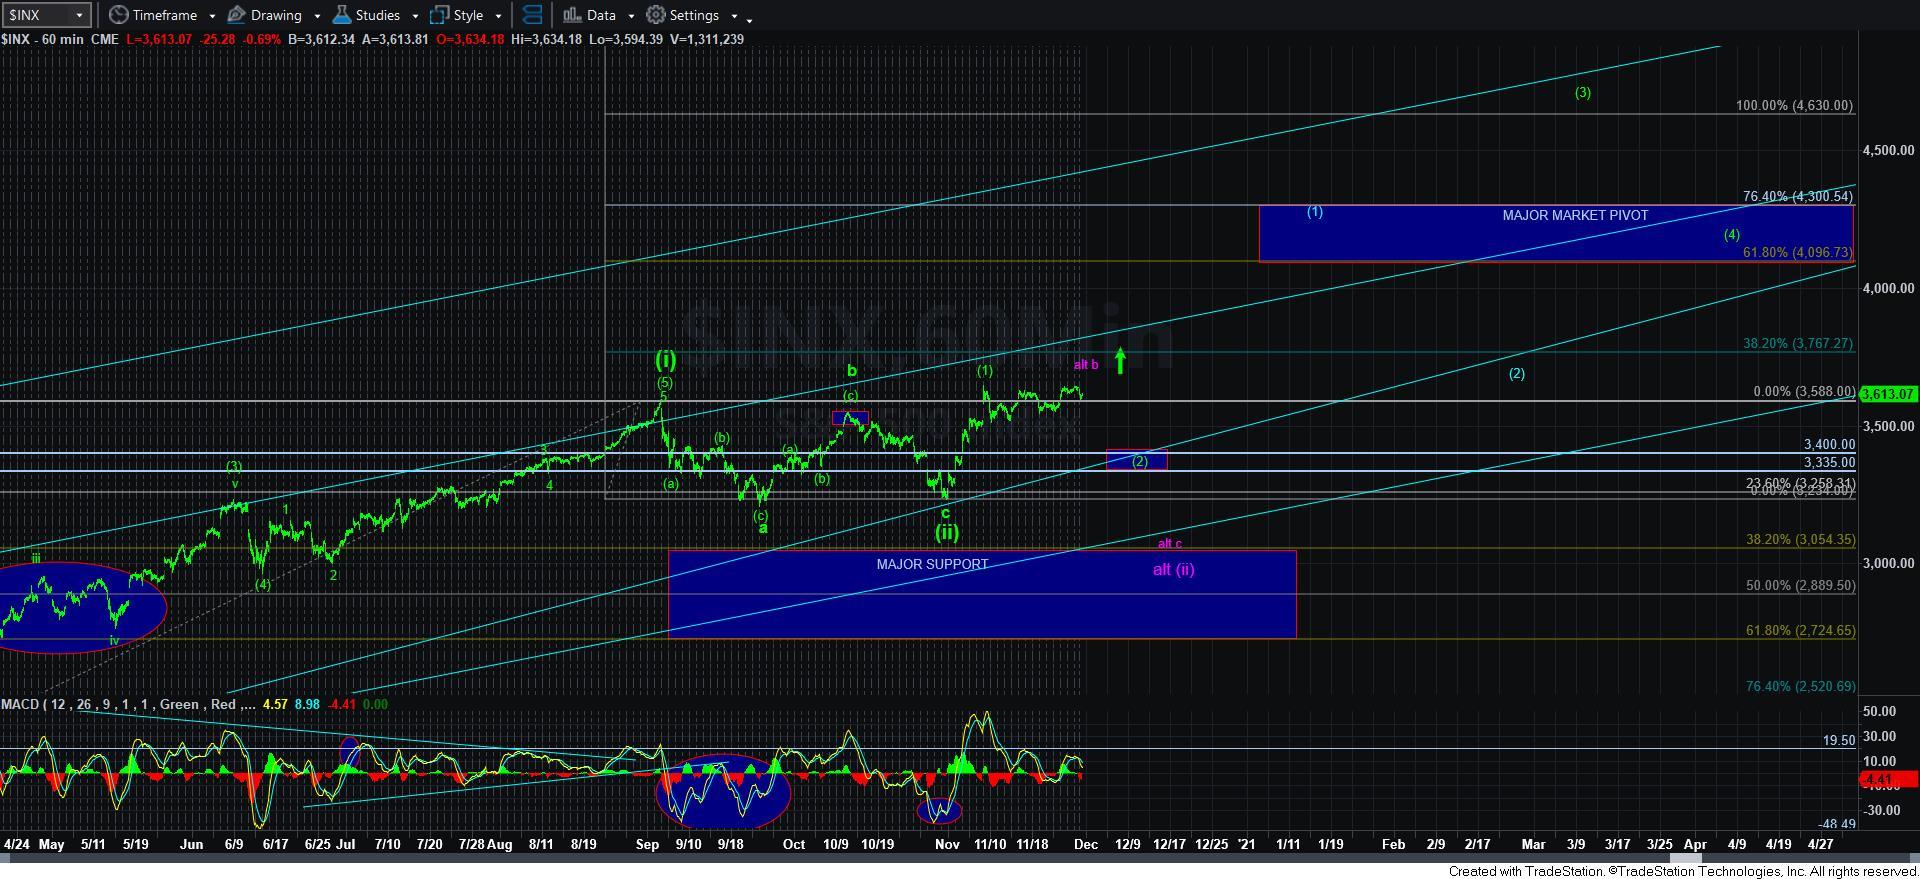
But, for those that do not desire to hear the details, I will summarize it as follows: Support is now at 3540-60SPX, with resistance now at 3680-3700SPX. As long as we remain over that support, and then break out through noted resistance, then we are likely in wave 3 of [3] of [iii], and on our way to 4200/4300SPX. Should we break below 3540SPX, then we have an initial indication of the bigger wave [2] pullback.
Now, for those that are interested in the EW analysis, let me start with the triangle to which many are pointing. As I have noted many times before, I do not think we will see a triangle in this region. You see, I have NEVER . . and I want to repeat NEVER seen a 2nd wave triangle. In fact, Frost & Prechter also note that 2nd waves are not formed as triangles.
However, there is a way we do see a triangle within a 2nd wave that can fit this circumstance, but it is quite rare. It is where we have a w-x-y pattern for a 2nd wave, wherein the y-wave takes the shape of a triangle. And, I have outlined that “generally” on the attached 5-minute SPX chart in red. But, it would mean would be stuck in the y-wave triangle for the next week or two as we consolidate within a triangle pattern over the 3540SPX support. But, again, this is relatively rare, so it is not something I am considering just yet. But, I wanted to at least address the triangle question that many have, and provide another option within that potential.
With the overlapping structure we have seen for most of November, I can view this structure as a completed diagonal. Yet, it did not make a higher high thus far, so it is hard for me to rely upon an truncated 5th wave ending diagonal. Again, this would be a rather rare occurrence. Yet, if the market were to rally over the 3680-3700SPX resistance noted on the 5-minute chart, I would have to take this 1-2 in green much more seriously, and strongly consider that we are in wave 3 of [3] of [iii]. But, again, as it stands right now, I cannot consider this a high probability.
The other potential is that the market has not yet completed wave alt [1] or 1, and still needs to push higher towards the 3680-3700SPX region to make a higher high. But, again, I do not have a lot of confidence in that pattern either, as there is nothing within the structure to suggest this is a strong likelihood. But, there are other charts that are suggestive of one more push higher before a real pullback is seen. So, I am certainly keeping this on the radar screen for right now.
There is also potential that today’s high represented a [b] wave within the wave [2], and that is outlined in blue on the 5-minute SPX chart. I cannot say that I have a lot of confidence in that potential either since the market has not dropped off the high within a clear 5-wave structure. While it can certainly develop as an ending diagonal, that is not what I would consider a high probability at this juncture.
So, as you can see, the market has left us with a significant lack of clarity in the micro structure. Again, my preference remains to see a standard pullback to at least the 3400-3500SPX region at this point in time (which is the blue box as slightly raised to account for an [a]=[c] potential in blue), I do not have a clear pattern just yet upon which I can rely with a higher probability. Rather, I can simply restate my preference for a standard pullback until the market proves otherwise with a break out over the 3680-3700SPX resistance point.
I am quite certain that the market will eventually provide us with clarity in the coming days/weeks, but I simply do not have anything upon which I can sink my teeth and suggest as a higher probability pattern expectation. Rather, I am going to maintain a primary expectation for more of a pullback to take shape until the market proves otherwise.
So, while I will attempt to answer your questions, I am sorry to tell you that the market is simply not providing me with any smaller degree answers just yet. Simply stay focused on the fact that this a bull market which likely has several more years to run, and focus on the individual stocks on your “buy” list during this consolidation/pullback as the market sets up its next bullish rally to 4200/4300SPX into 2021, on its way to the 5000 region as we look towards 2022.