A Break Can Be Treacherous
I wanted to send out an update to the entire membership about this, as the market is at a very precarious posture.
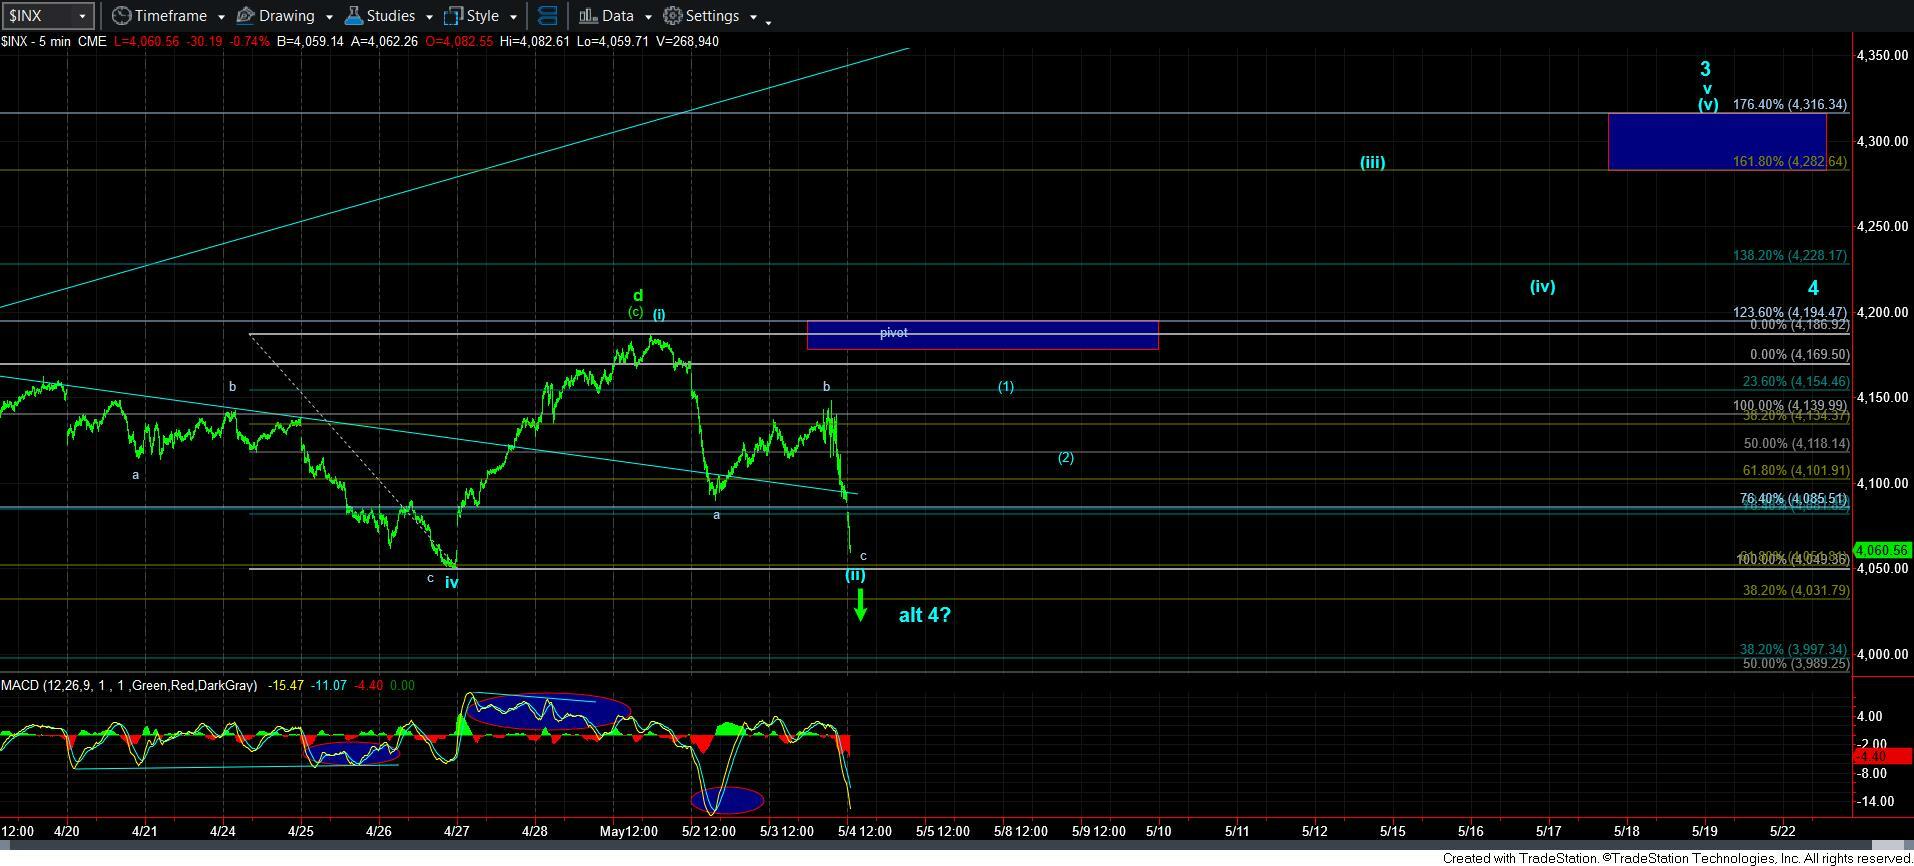
As long as we hold over last week’s low, then I can still maintain a (i)(ii) structure noted in blue on the 5-minute SPX chart.
However, a break of that level will open the door to a number of issues.
First, it clearly opens the door to the e-wave of the (b) wave triangle in green.
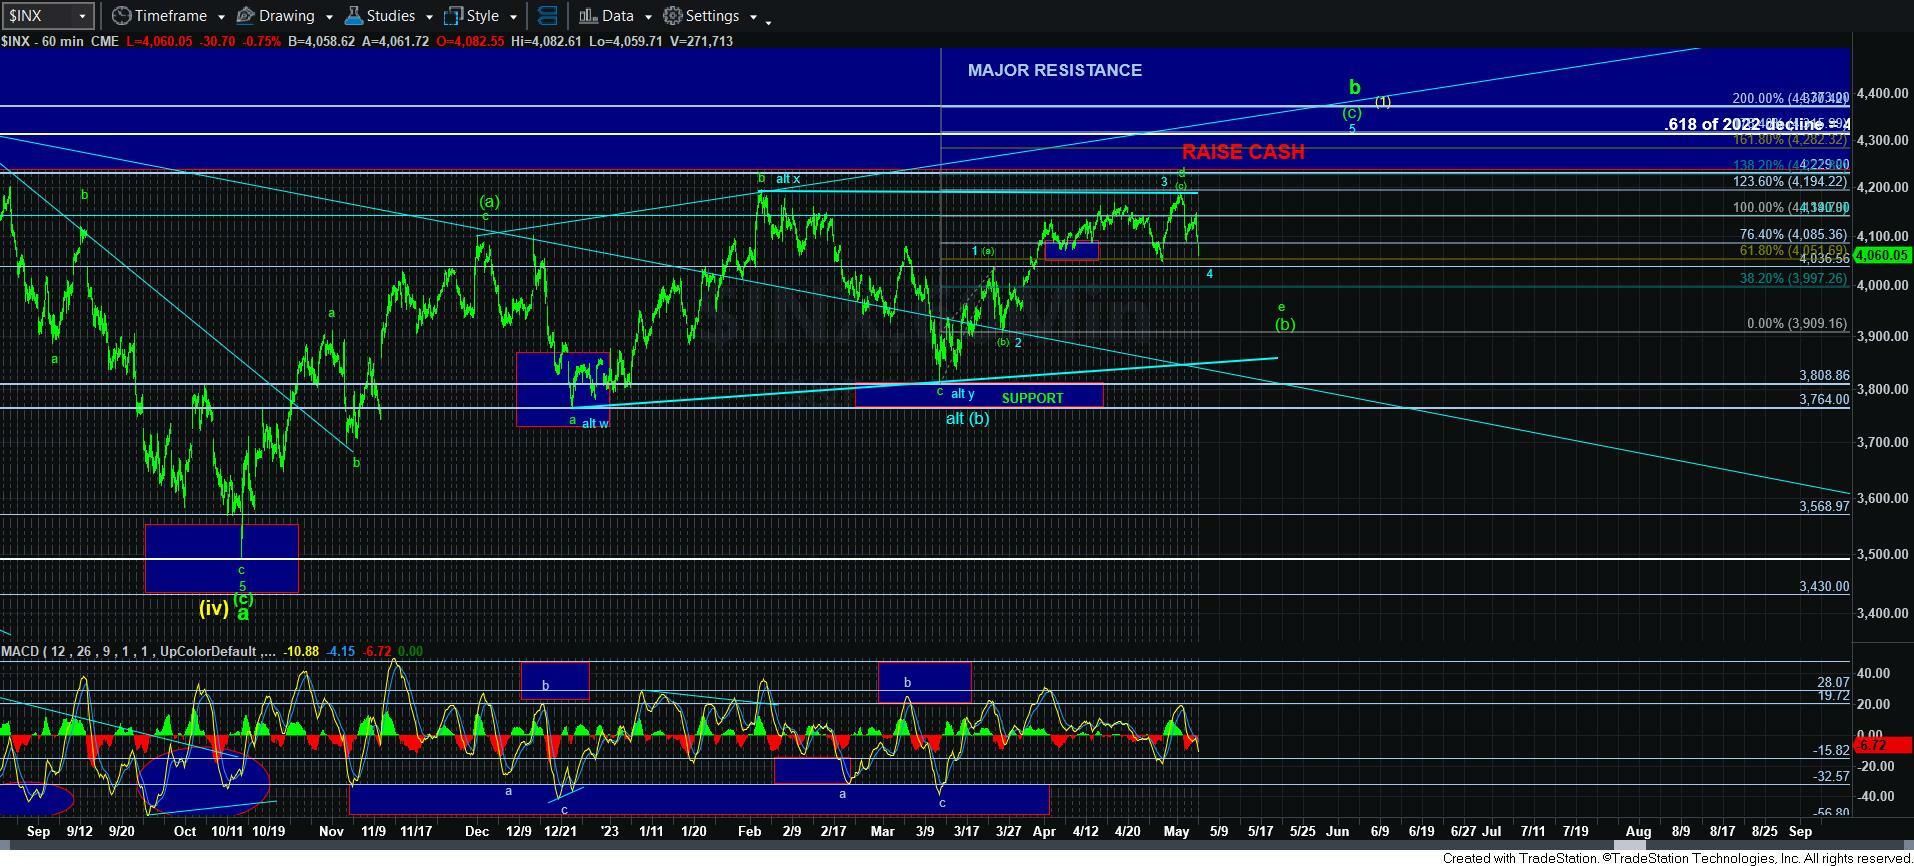
Second, it MAY also suggest that the [c] wave to 4300+ may take shape as an ending diagonal, with a drop to the 4030/40SPX region and strong reversal being a 4th wave pullback in that ending diagonal, which is outlined on the 60-minute chart.
This makes trading any upside VERY treacherous and something I would probably avoid for now, at least until the market clarifies its intention in the near term. But, I would assume that pressure will remain down if we break 4049, unless the market holds 4030/40 and sees a strong reversal back up.
But, remember, any such reversal may not be a 5-wave structure and it will be very difficult to tell if it is a corrective bounce in the e-wave of the (b) wave, or the start of a 5th wave high in the ED in blue.