A Bounce Was Due
With the market dropping down to our secondary support region yesterday, I noted that it was reasonable to expect a bounce to develop in the near term, which is what we got today and should not come as a surprise:
“Ultimately, it means I think it to be reasonable to expect a bounce in the near term, which could very well just be a b-wave, as presented in green. Also, it is reasonable to assume it can rally back up towards the bottom of the trend channel before it turns back down in the c-wave lower.”
Now, I want to address an issue with which I have to deal as an analyst. And, if I am dealing with it, I think it to be appropriate that I at least present it to you.
While the market closed with a bounce off the day’s low yesterday, the overnight action saw a further drop which is not seen in the SPX cash index. So, as an analyst, I struggle with whether I should account for it. This evening, I am going to provide a bit of a hybrid in its treatment. Allow me to explain.
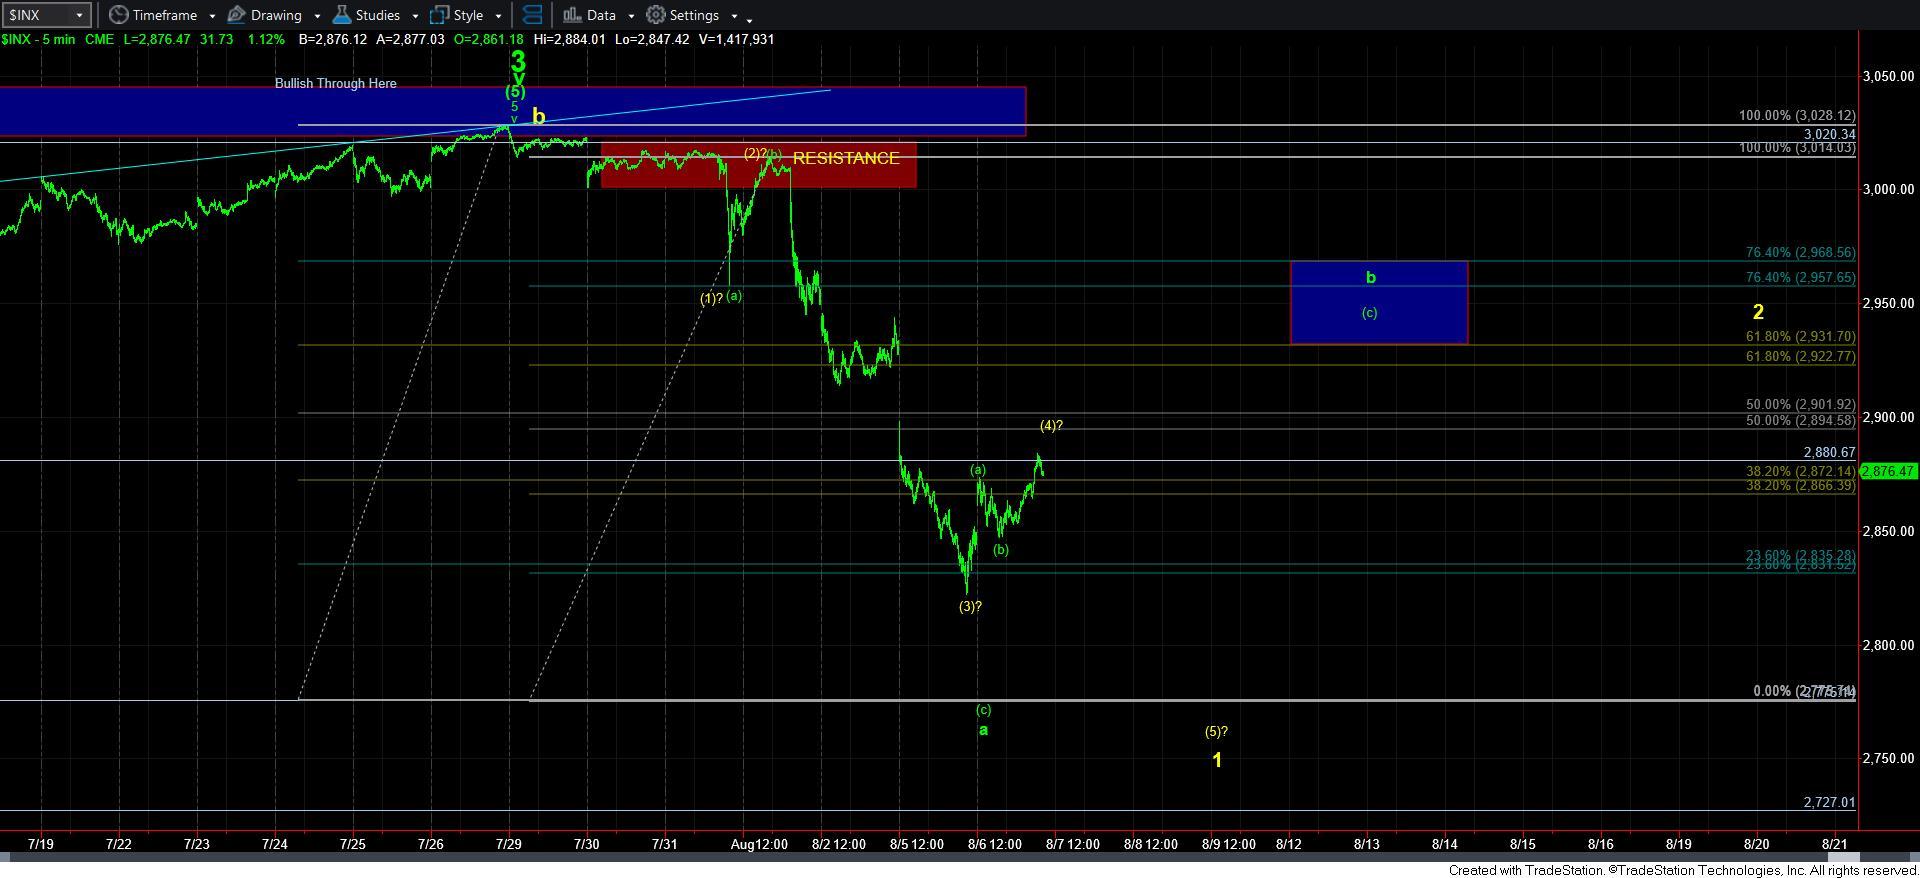
Clearly, we have enough waves in place to consider the a-wave as completed, especially since we are still considering the green count our primary count. Moreover, I am going to include the overnight action in my assumption as to where the a-wave completed, which would be in the 2775SPX region. Therefore, the retracement box for the b-wave noted on the chart is based upon the overnight action.
However, if I view the actual cash SPX low as wave (3), and this bounce as wave (4) in the yellow count, then the a=c for this wave (4) is in the 2900SPX region, with c-.764*a in the 2886/87 region. So, should this region between 2886-2900 hold as resistance, and then break us lower below the level struck in the futures last night, I would have a rather solid 5-waves down off the all time high, albeit quite extended. That would again make me consider the yellow count potential much more seriously.
However, if the market can continue higher as shown in the green count, I would like to be able to count this second surge at the end of the day as wave 1 of the [c] wave of the b-wave bounce. While there still may be further machinations within this b-wave rally for which I have not accounted, you will have to excuse me for that as b-wave are quite variable, and can take many unexpected twists and turns as the market provides its corrective retracement.
Again, the green count must be our primary until one of the others gives us a strong indication as to why we need to adopt them. And, unless I see a CLEAR 5 waves off the recent all time highs, I simply cannot abide by the yellow count with any form of high probability.
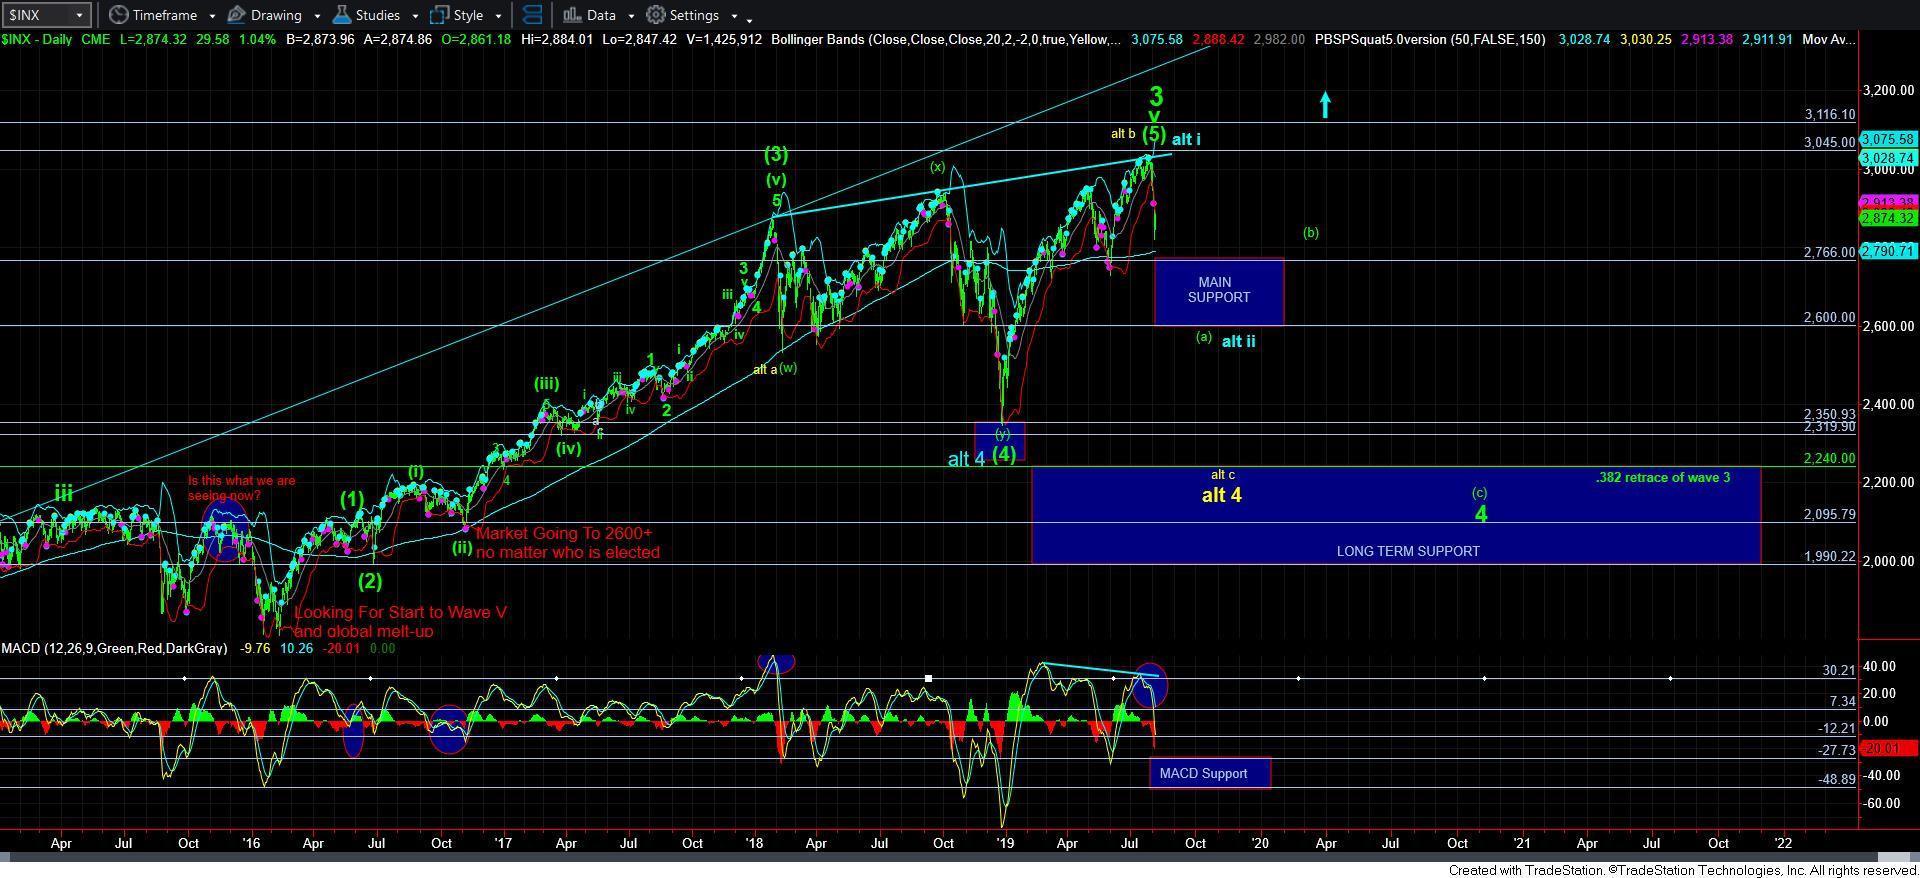
As far as bullish counts are concerned, I have a very hard time just yet adopting the blue count noted on my chart. But, it is also something that is in the back of my mind for consideration.
Yet, along the lines of bullish potential, I provided an update on IWM today which I think should be repeated:
Everyone is so shell shocked by this market's ability to come back, it makes you more fearful of missing upside than the potential downside that is still present. Now, mind you, I have been trying to keep everyone focused on the fact that we do not believe this bull market is done, and likely has several more years to run, with an ideal target of 3800-4100SPX. So, I have been harping on looking for sales for that last rally.
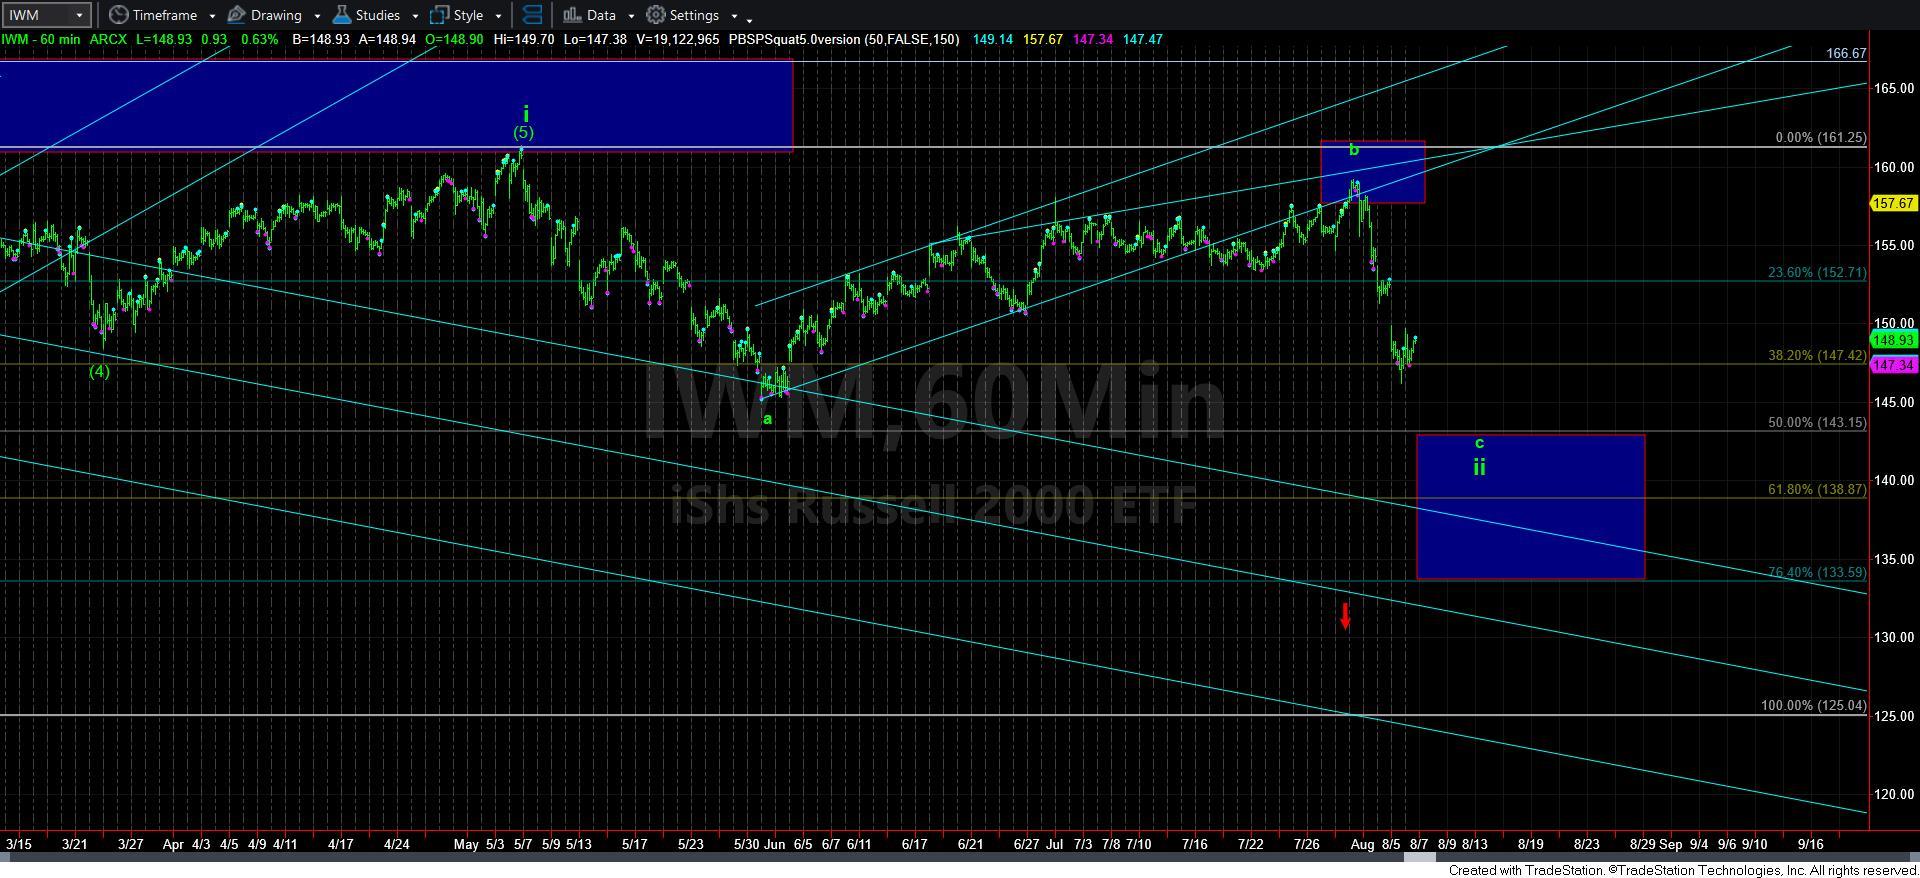
With that said, the only index chart I can make out a strong argument for us starting a major potential rally sooner rather than later is the IWM - as I have been noting for some time. So, if we are able to take out last week's high from this posture in impulsive fashion, a full 5 waves overhead is pointing to at least the 215 region. For those counting, that would mean a 35% rally from the point of break out. I can personally wait for that to happen simply because I think we have strong potential to see lower across the market. But, if that should happen sooner rather than later, this is going to be my game plan.
Now, to add a bit more color to this potential, I want to note that if the market can now drop down to the 143 region on the IWM with this being a wave (4), I would consider going long the IWM. You see, that would represent a 5-wave downside structure off the b-wave high, which would provide us an a=c right into the .500 retracement of the rally off the December lows. How this will resolve in the SPX is unclear, but I have to go with what would seem rather clear in this chart. And a long at 143 with very tight risk parameters would be reasonable based upon this structure.
As far as the SPX is concerned, I simply cannot come up with a reasonable count which mirrors the IWM. But, if the IWM does develop in the more immediate bullish posture, I will clearly re-evaluate my larger perspective.
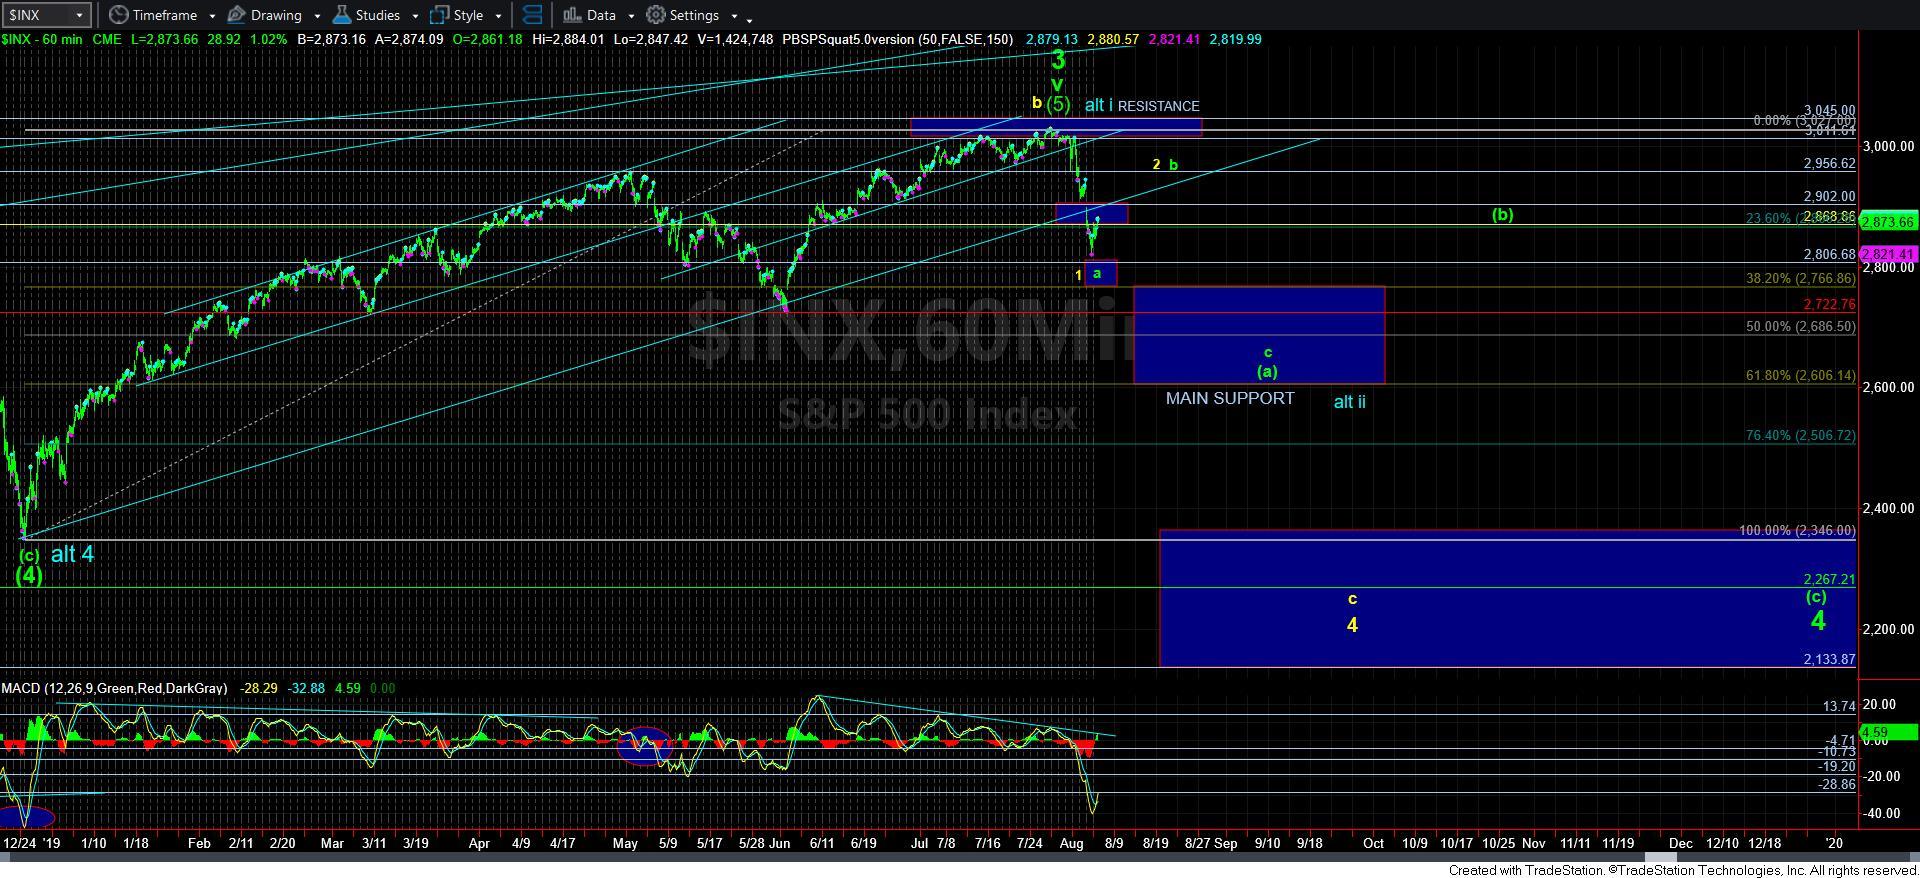
For now, unless we see that lower low tomorrow, I will be looking for us to set up a rally back towards the blue box overhead before we are ready to see another bout of selling deeper into our support box below on the 60-minute chart. Once the next rally tops out, we can probably set more narrow parameters as to where we expect the next drop to take us.
For now, I do not think we have completed this drop, but rather have only begun it. This means we will likely see higher levels before the next larger degree decline will be ready to take hold.