A Bit More To Consider
I want to add a bit to Garrett’s analysis from today.
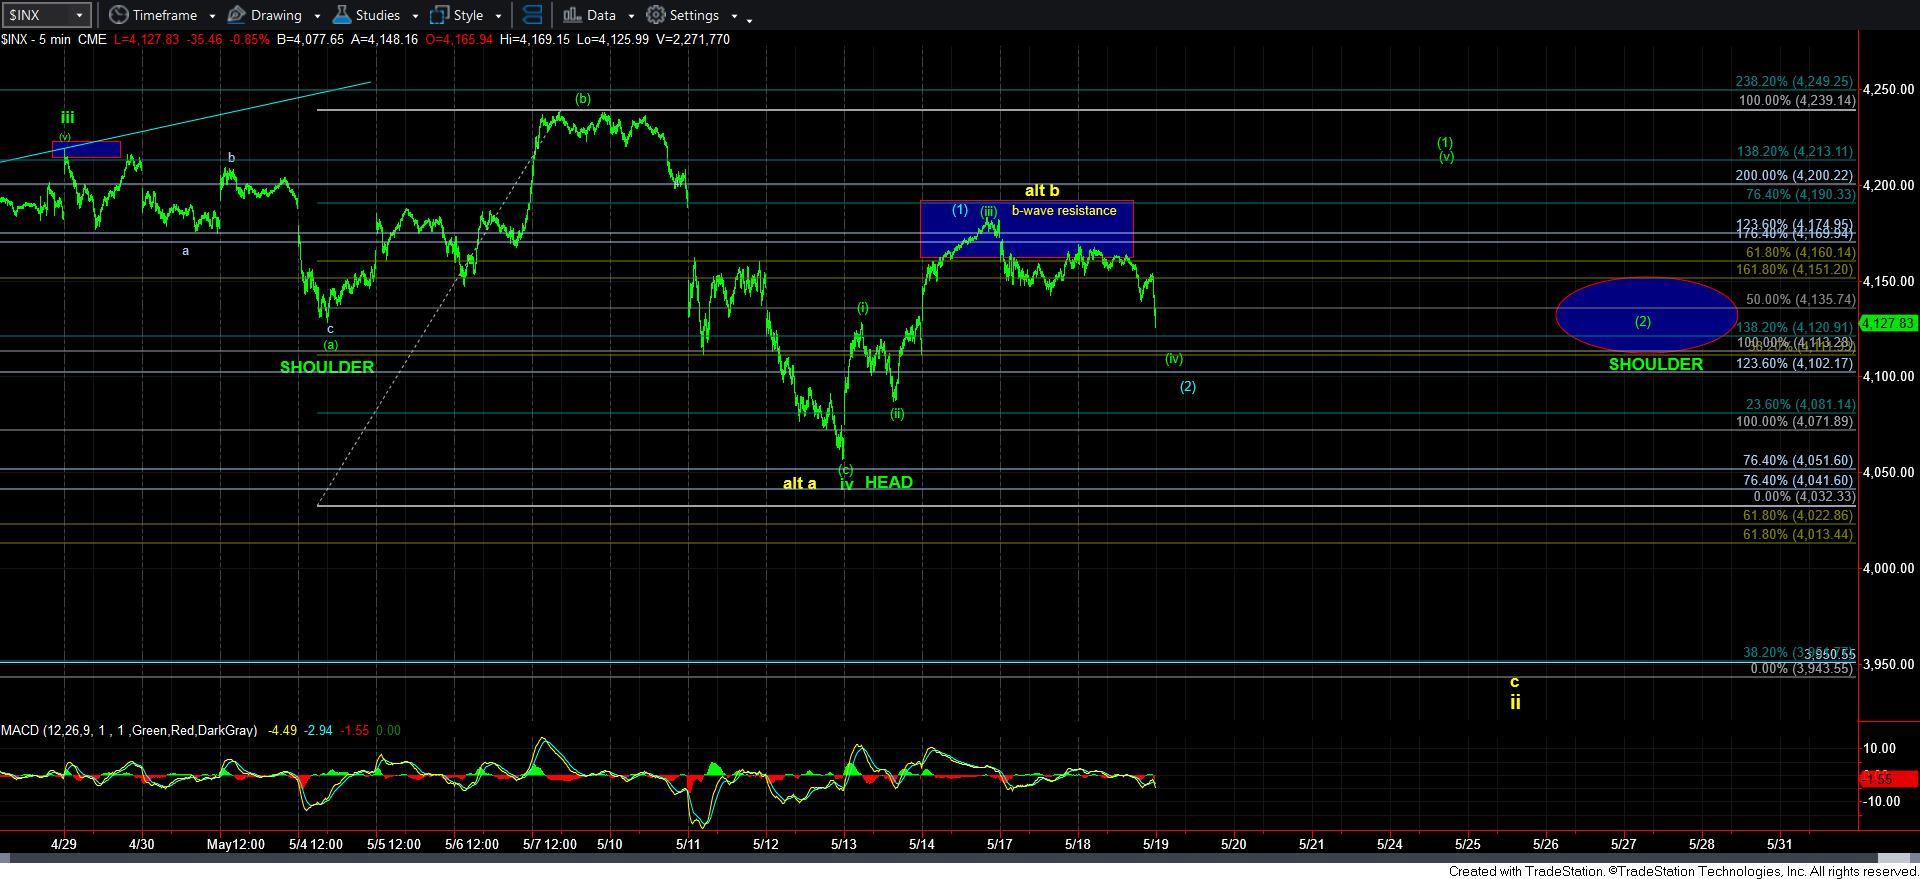
As you can see, I have added Garrett’s count of a potential ending diagonal for wave v of 3, which is now in blue on my 5-minute SPX chart. But, as you can also see, there are two other potential counts I am tracking as well, with the yellow count back in consideration as well. So, let me discuss the other two counts, as Garrett has already covered the potential ending diagonal.
First, I want to note that this region has become quite murky.
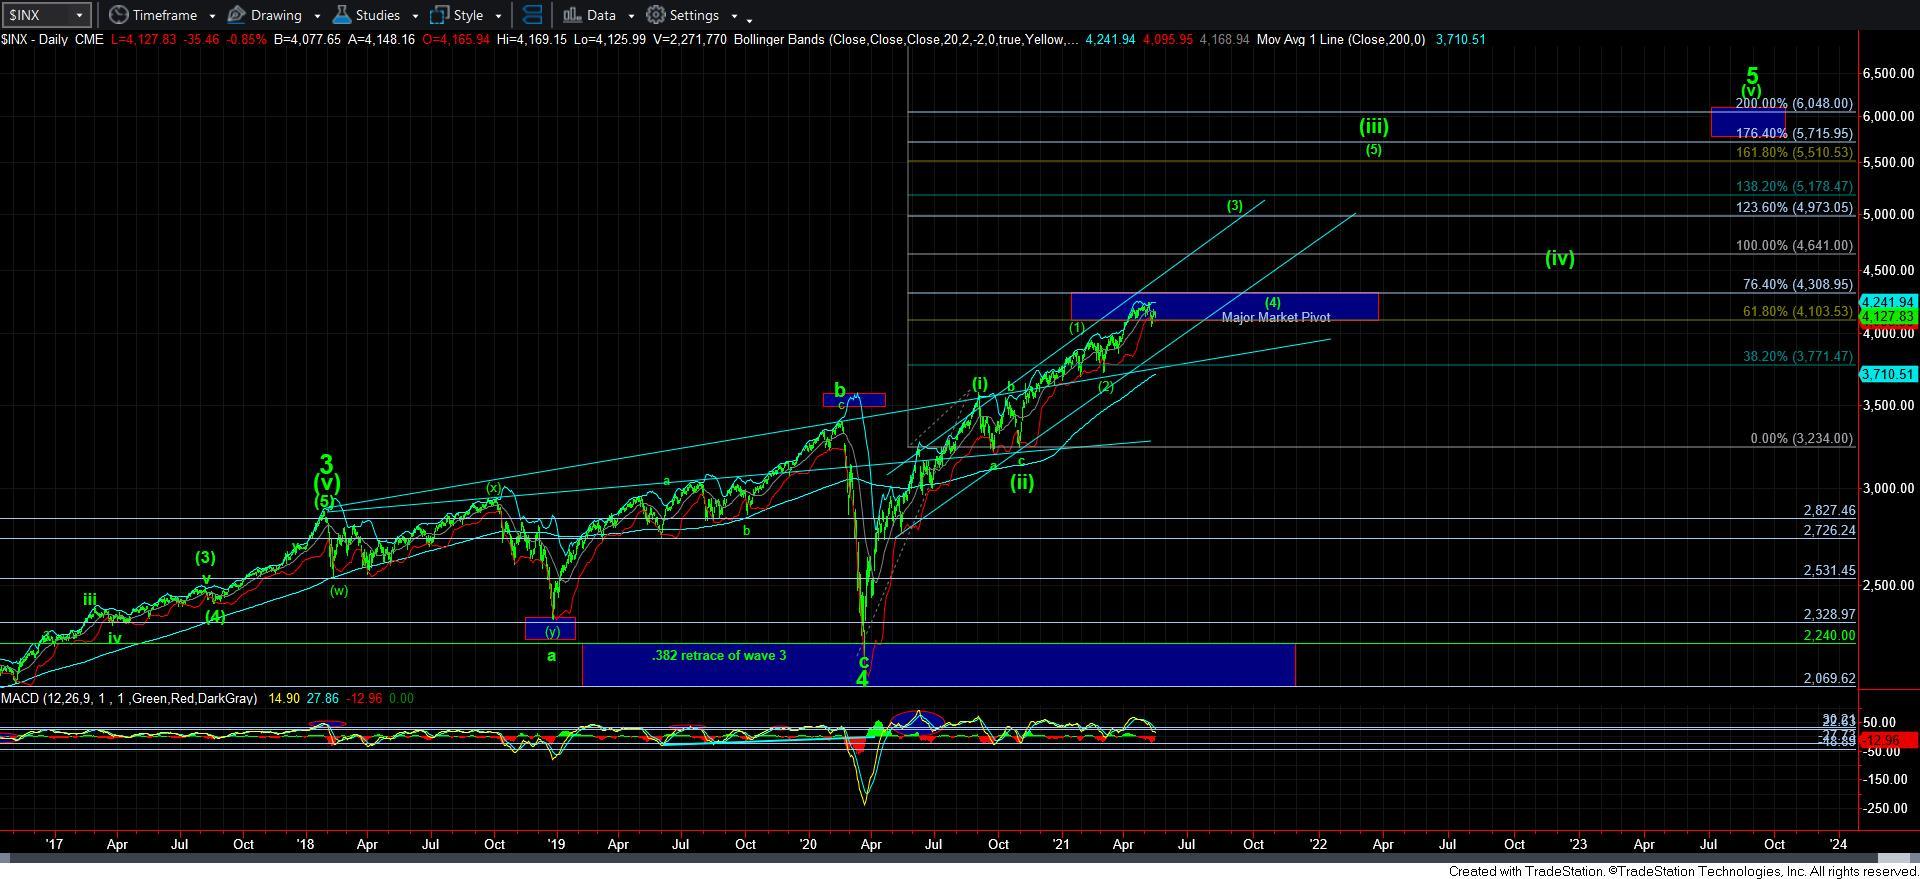
So, let’s start by zooming out to the daily SPX chart. As you can see, I am still viewing us in a larger degree 3rd wave structure. And, if you think that this action cannot happen within a 3rd wave, I have included the daily chart so you can see that this is really a blip when you zoom out to the larger time frame. So, if you are getting frustrated with this action, please take a step back and recognize how far we have come and how quickly we have gotten here. To see some consolidation is not unreasonable. So, everyone please take a step back and gain a bit of perspective.
Yet, that does not mean that we will have a solid micro-count at all times. As Frost & Prechter have noted:
“Of course, there are often times when, despite a rigorous analysis, there is no clearly preferred interpretation. At such times, you must wait until the count resolves itself. When after a while the apparent jumble gets into a clearer picture, the probability that a turning point is at hand can suddenly and excitingly rise to nearly 100%.”
And, with three potential counts I have to track, I think we are in a region where we have to allow the smaller degree wave count resolve itself before we can provide better clarity in the smaller degree time frames.
So, in addition to Garrett’s ending diagonal pattern, I am also considering a leading diagonal for wave [1], which makes this pullback a wave [iv], with a higher high being wave [v]. There is not much more downside room to be seen if this is the correct count, and I suspect that if this is the markets intention, we should begin a rally to a higher high in wave [v] of [1] by tomorrow.
Lastly, allow me to say a few more words about the yellow count. I still do not like it for all the reasons I have noted over the last several weeks. Moreover, if I have to assume this is a c-wave down in wave ii, it is going to have to provide us with bigger downside follow through this week because the current structure in the SPX smaller degree structure is not projecting to the ideal c-wave target. So, again, while I still cannot completely discount the potential for this count, I still have to view it as the lower potential out of the three counts we are tracking from a probability perspective, at least based upon what I am seeing.
So, while I cannot provide you with a more definitive understanding of where the market resides at this very moment in its smaller degree structure, I have to at least be honest with you to tell we are going to have to have a bit more patience while the market makes the smaller degree structure a bit more clear. For those that have followed my work for some time, you would already know that I will never provide you any false sense of security because the last thing I want to do is to place you in a position where you are taking more risky trades. As it stands today, I am still bullish in the larger degree, but the smaller degree structure is still leaving too many doors open for me to provide any strong assurance as to how the current smaller degree structure is going to progress. I would imagine the next day or two will likely clarify it.