A Bit More Clarity
It only took a day for the market to provide us with a lot more clarity than we had yesterday. So, let’s go through what we know and the levels we have to watch very carefully in the coming days.
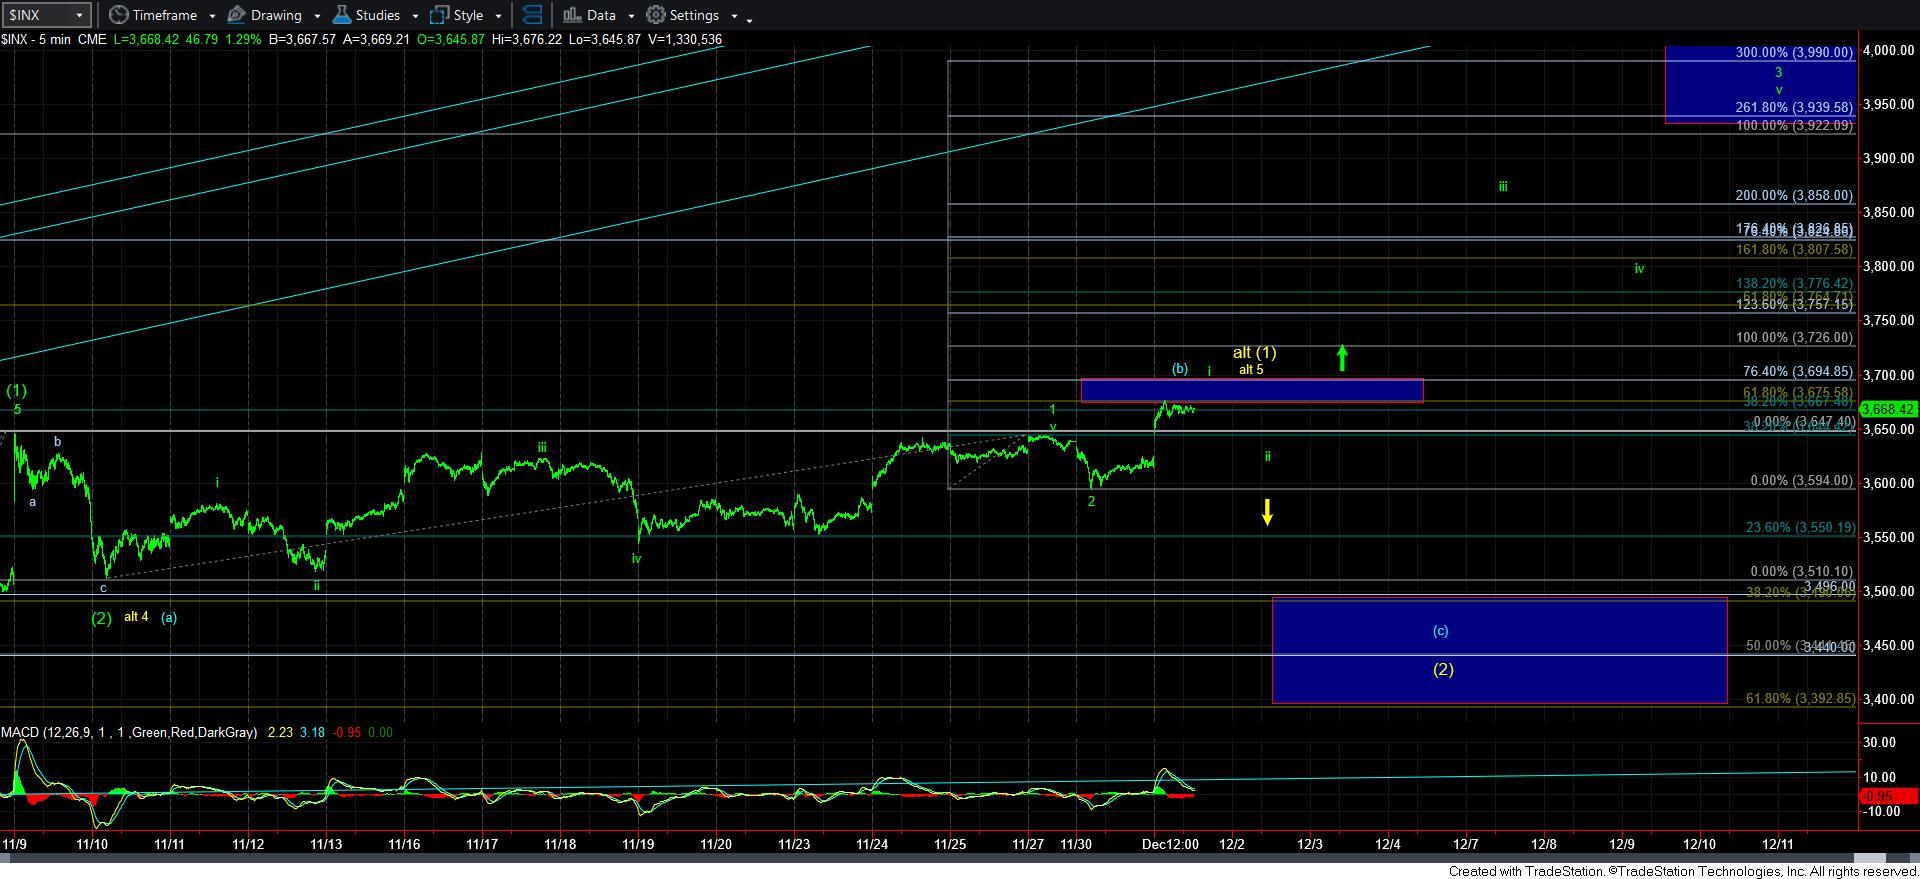
With the market moving up to the resistance box I highlighted yesterday, it has now set up its next break out pattern. The question is if it will trigger.
As we are hovering at the bottom of the box right now, the market looks like it needs a micro 5th wave higher to complete the rally off yesterday’s low. And, how the market pulls back from this box will tell us all we need to know.
You see, in the most aggressively bullish potential, we have a [i][ii], [1][2], 1-2, i-ii potential pattern setting up, as highlighted on the 5-minute SPX chart. That means that if the market pulls back correctively tomorrow in a wave ii, and holds over the low struck yesterday in the 3594SPX region, and then follows through with a break out through the resistance box, that is a strong indication that the melt-up phase of wave 3 of [3] of [iii] is in progress.
But, that does not mean we do not abide by our risk management outline provided to us by our Fibonacci Pinball structure. So, should the market break out in the coming days through the resistance box overhead, then you can set your stops just below the box – around the 3670SPX region – and just let the market run. Of course, we will continue to adjust stops as we follow the market higher. But, take note that it is providing us with relatively tight parameters should we break out over 3700SPX sooner rather than later. So, if this pattern does follow through, then we should not break back below 3670 as we begin our rally towards the 4200-4300SPX region next.
However, the market has yet provided us with any reasonably standard type of pullback since we bottomed back in March. And, there are still two potential paths with which the market can still take us down to the support box below, as presented in blue and yellow. But, clearly, this means that the resistance box MUST hold, and we must break down below 3594SPX to signal that this has become much more likely.
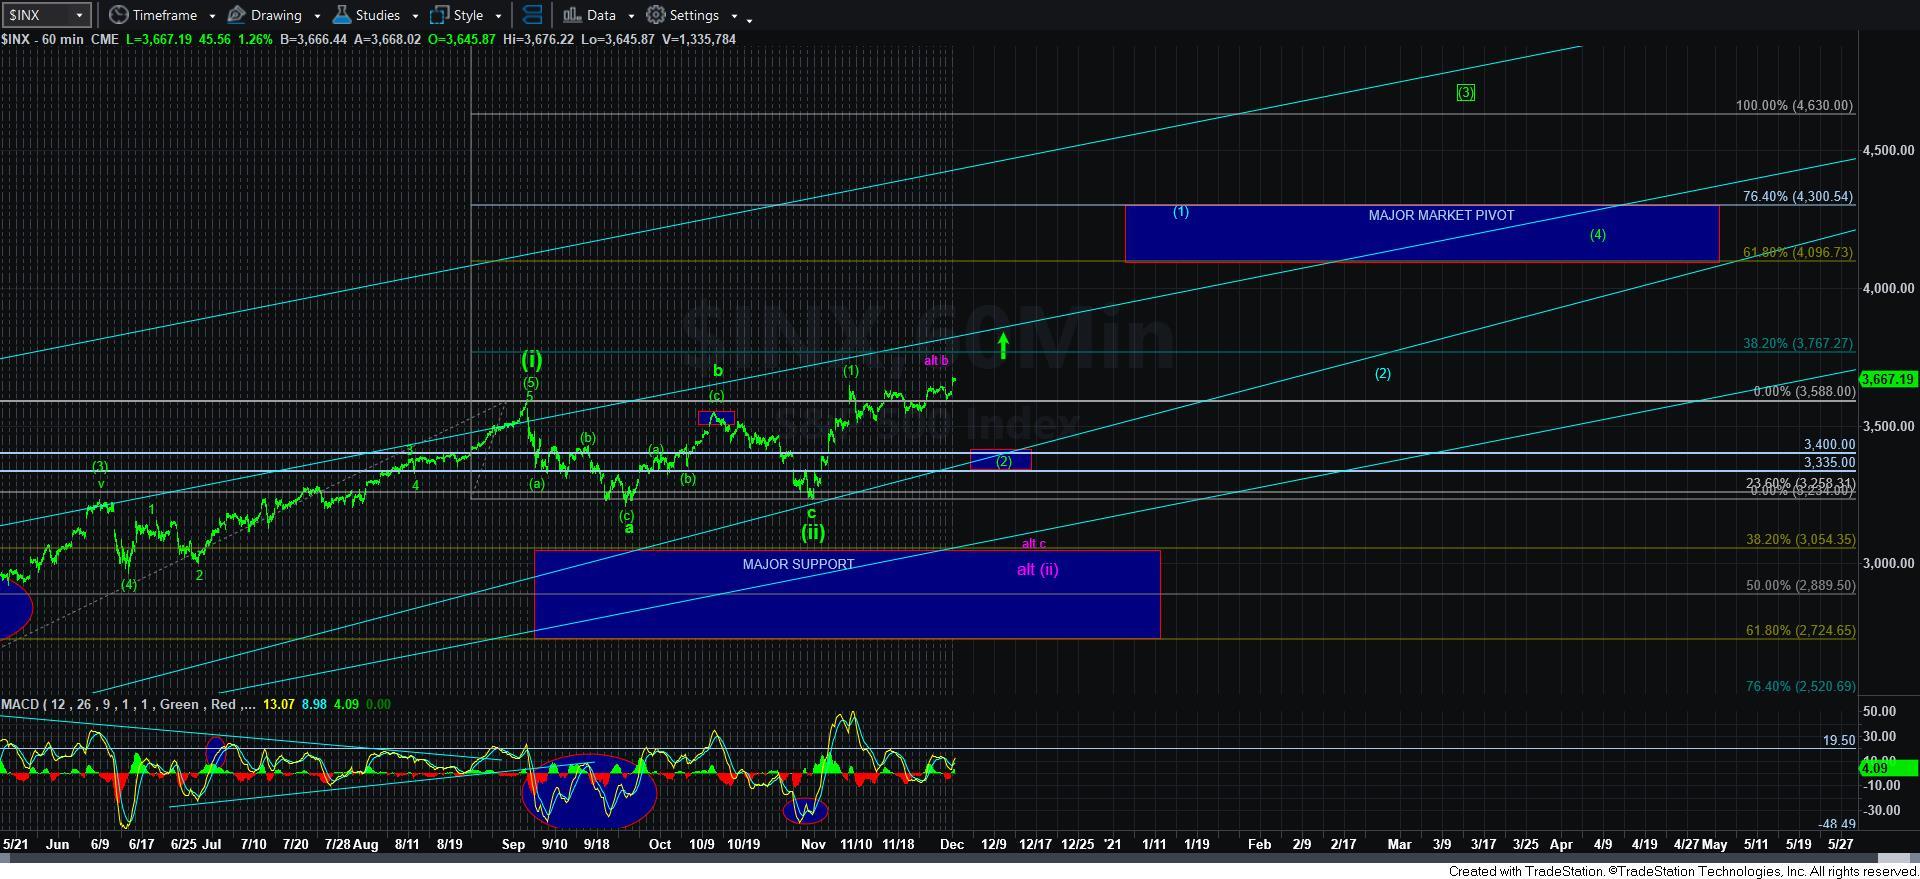
In the meantime, I want to highlight something very important that occurred today. The NQ has finally broken its deeper pullback set up that I have been tracking. That places another dagger in the heart of the purple count that I have had on the 60-minute SPX chart, and makes that even less likely in my humble opinion.
And, lastly, I have added a proposed path for the wave 3 of [3] on the 5-minute SPX chart, but please realize that it is a bit pre-mature, as we have not yet broken out in wave iii of 3 just yet. But, it should give you some idea of what I would expect in a break out. Take note that I would expect wave iii of 3 to become a strongly extended wave in order for us to reach the ideal targets we have much higher.
So, the market has now provided us with very clear parameters on both sides of the market. To summarize, staying over 3594 and breaking out over 3700 points us strongly higher in the heart of the 3rd wave and provides us with MAIN support at 3670/75SPX, which we will raise as the market continues higher. However, if the market breaks down below 3594SPX, then we will likely see more of a standard pullback for wave (2) with the support box below as our primary target.
Ultimately, I expect us to rally to 4200/4300SPX as our next major rally target, but without any real pullbacks yet to be seen, I am going to let the market prove to me that it wants to go there sooner rather than later. Yet, while I certainly would prefer to see a standard pullback, if the market breaks out over 3700, I intend to only be looking higher at that point, at least as long as we remain over 3670SPX.