6810SPX Is Our New Support
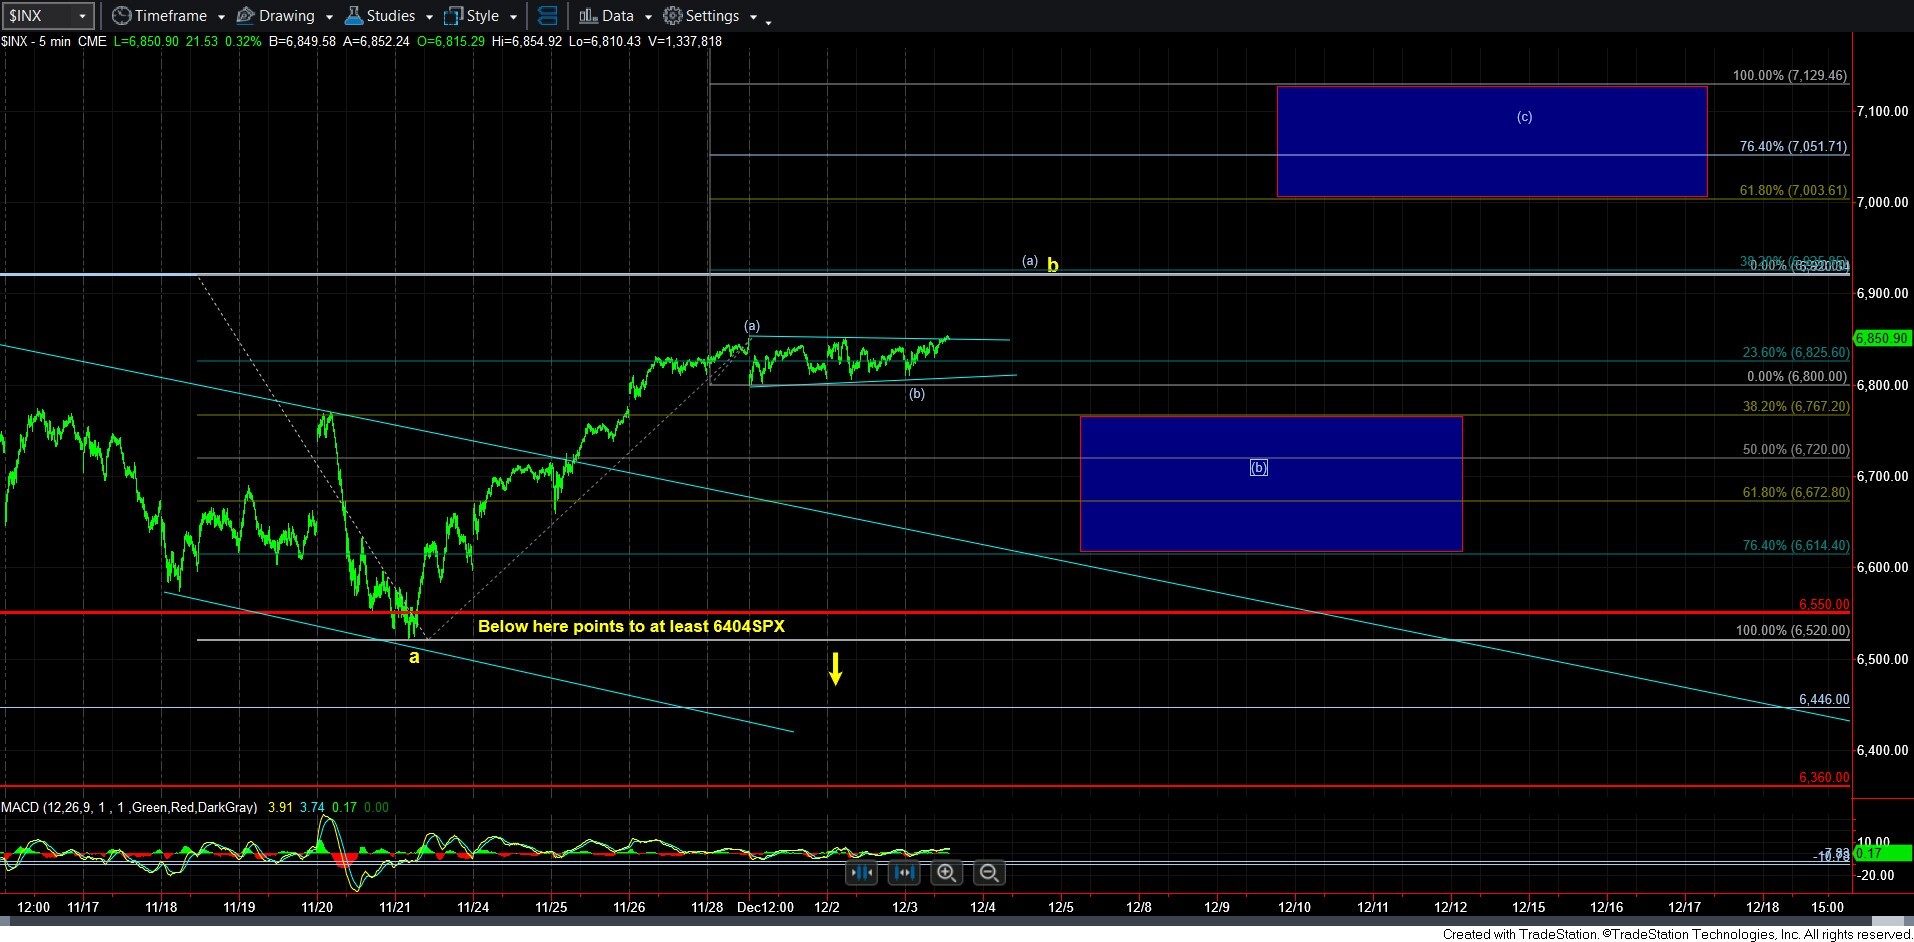
As the market has been grinding sideways now for days, and as I said in an alert I posted not too long ago, I think everyone, along with their grandmother and their grandmother’s dog can see the obvious triangle in the SPX. And, if we completed the e-wave or the c-wave of that triangle, then 6810SPX is our new micro support level.
The question now is what does this triangle represent? Keep in mind that triangles are most often seen in 4th waves and b-waves. So, is this a 4th wave triangle or a (b) wave triangle in our case?
As it stands now, I think it is large enough to consider it all of the (b) wave, which would then put us on a course to the target box overhead on the 5-minute SPX chart. However, it is just a 4th wave triangle within a bigger (a) wave structure, then we will likely break back below 6810SPX before breaking out to new all-time highs.
Again, I would lean towards this being a (b) wave, but I cannot completely dismiss the 4th wave triangle potential as well. But, as long as we are now over 6810SPX, I have to look higher.