5th Wave Follow Through
Today, the market followed through in the set up with which it left us at the end of yesterday. But, the most important point to recognize is that this is likely a 5th of a 5th of a 5th wave. That points us to a topping structure.
Within this evening’s update, I want to highlight something I posted early this morning:
I want to add a note this morning. It is not often that we see various markets pointing towards a full ripeness for a potential reversal. We are seeing that now. While that does not mean the market MUST reverse, I will note that the probabilities are high that we can see such a reversal in the near term.
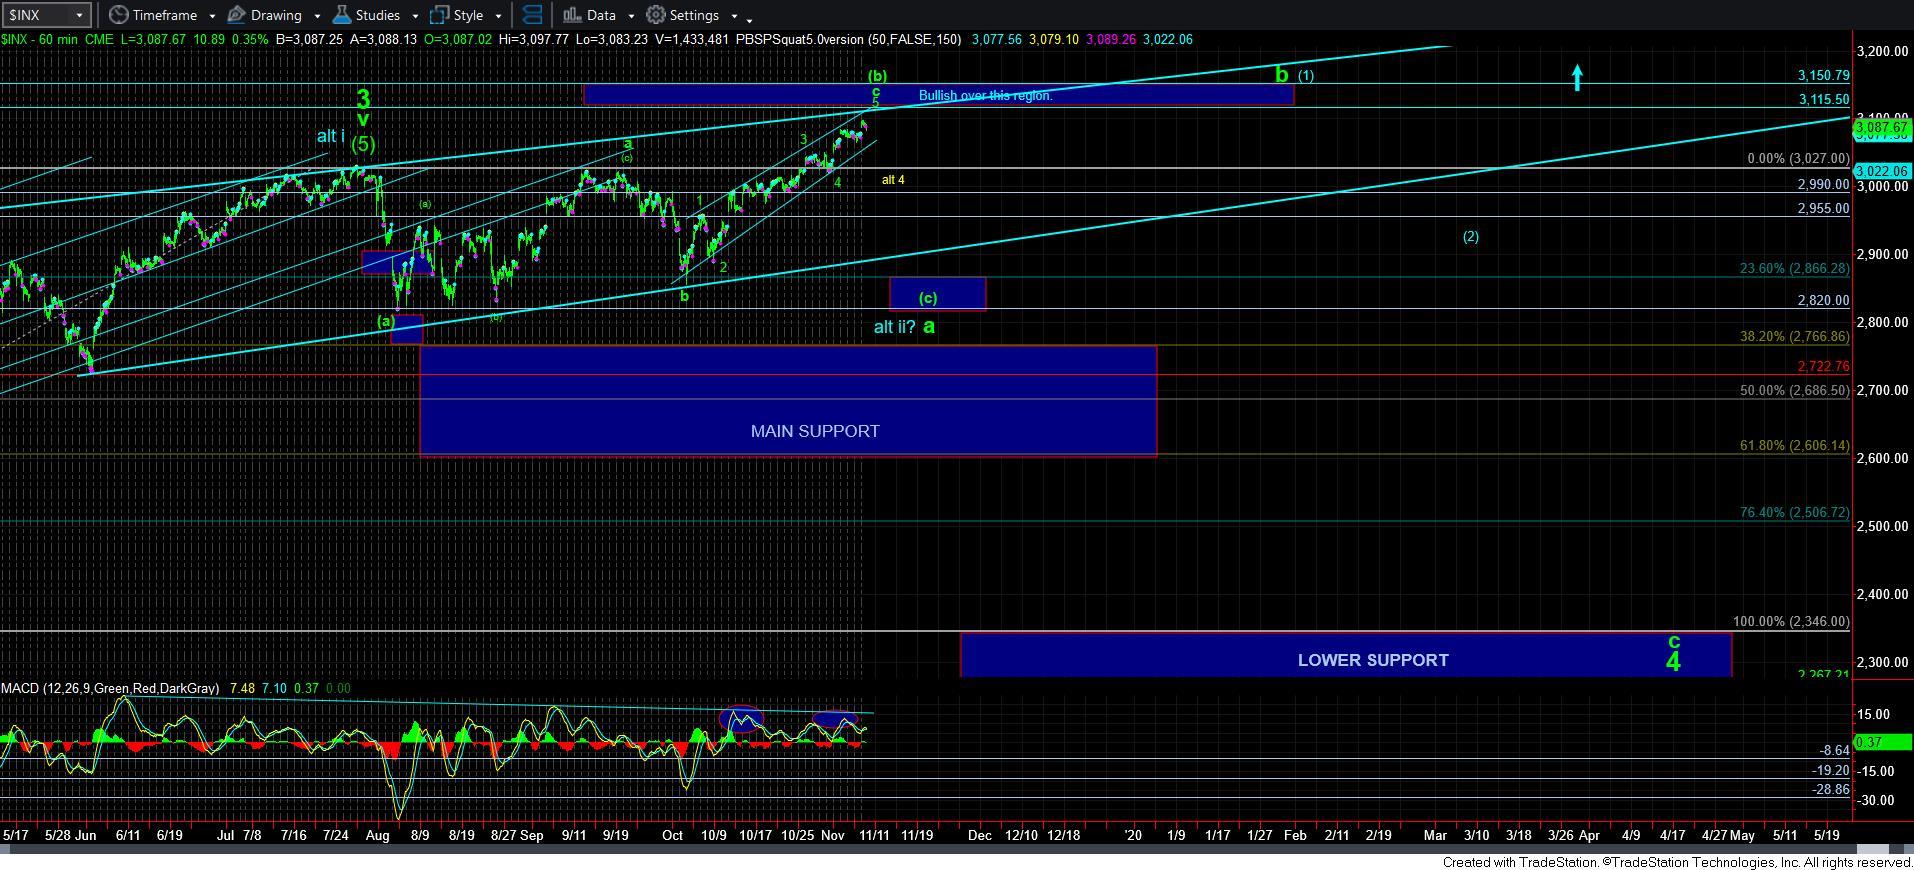
The IWM chart that we have been tracking as a larger b-wave has reached its point of (a)=(c). It is also completing a 5-wave structure for this (c) wave.
The NQ has now completed 5-waves up in a c-wave into its 2.00 extension – the standard target for a 5 wave structure. Moreover, the rally off the august low was a clear 3 waves structure (labeled as an a-wave), making this a c-wave 5-wave structure.
In the SPX, as I noted over the weekend, if we take into account the lower low seen in the futures back in August, the a=c resistance for the SPX is in the 3110SPX region, with us now just shy of that resistance with a 5-wave c-wave also seemingly completing, with all the negative divergences one would expect to see on the 60-minute time frame.
I also want to add to this potential what our Bayesian analyst, Luke Miller, noted in his write up this morning:
“Longer-term interpretations continue to point more towards a prolonged bearish leg lasting many months – of which fits the profile of Avi’s green. Bottom line: Bayes and Avi agree on the potential for a prolonged bearish market beginning imminently and continuing into next year . . . this is in probability terms the “end of the line” for a strong turn down in the markets. . . “
I have also highlighted the NAAIM money manager survey at being at high levels of bullishness, along with low put/call ratios we are seeing in support of the same.
So, I want to reiterate that the probabilities have lined up that the market is topping out in the near term, and quite full in wave counts to the upside. While it does not guarantee that the market is going to turn down as we expect, it does mean that the probabilities have risen to the point where they are well on the side of making it reasonable to expect that it will occur.
Overall, I am still looking for the market to break below 2990/3110 support to confirm that a larger degree decline has begun.
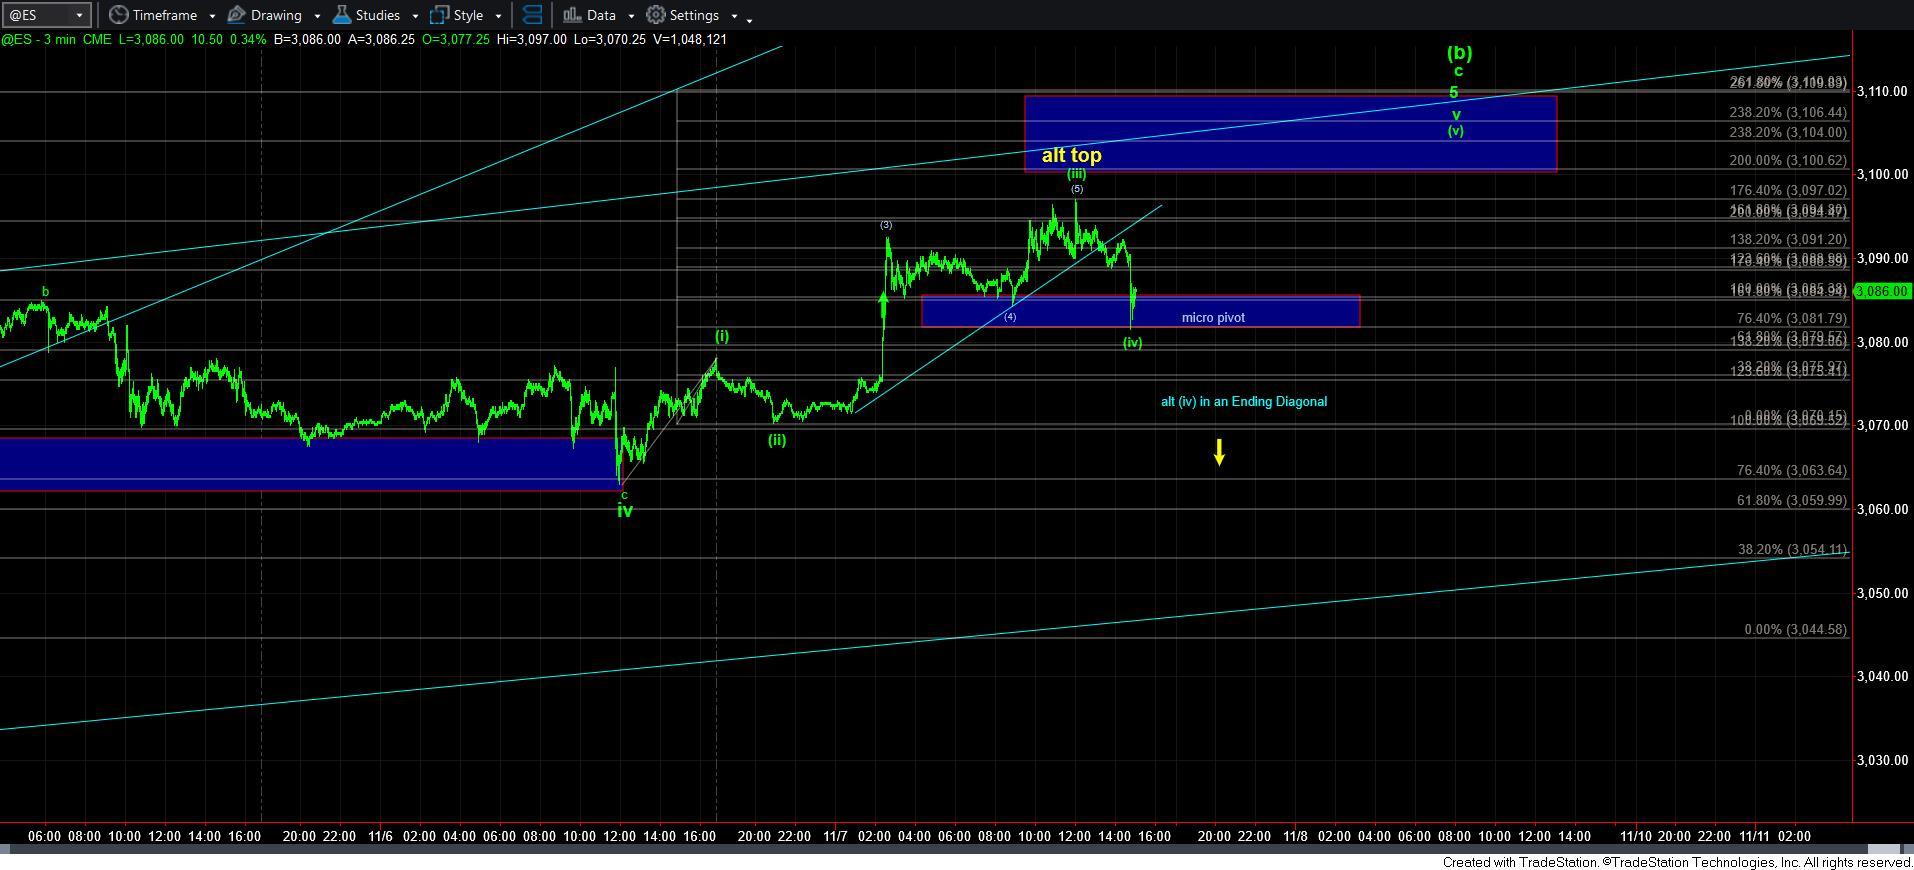
At this point in time, the micro structure still suggests we can see just one more push higher high in wave (v) of v of 5, as you can see from the 3-minute ES chart. Ideally, the spike low struck just now should be the bottom of (iv), but we can even go a bit deeper if this morphs into an ending diagonal. It would take a break down below wave (ii) to provide us an initial indication that the market has topped, as a 4th wave cannot drop deeper than a 2nd wave.
Additionally, I want to modify my main topping signal outlined above. I am now viewing the 3020SPX region as the support which must be broken in a sustained fashion to signal that we have struck the top to this rally off the October low. And, if we do so with a clearly impulsive wave structure to the downside, then I will be setting our sights on the low 2800’s again. But, let’s take this one step at a time.