4th Wave Whipsaw - Market Analysis for Jan 25th, 2022
Yesterday, the market topped out exactly at our resistance, and then dropped overnight. However, while the structure of the drop began relatively impulsively, and pointing us down to a lower low, we came back up through our micro-pivot, which signaled that the market was not ready to head to lower lows. Instead, it added another layer of complication, and potentially keeps us within a larger 4th wave structure.
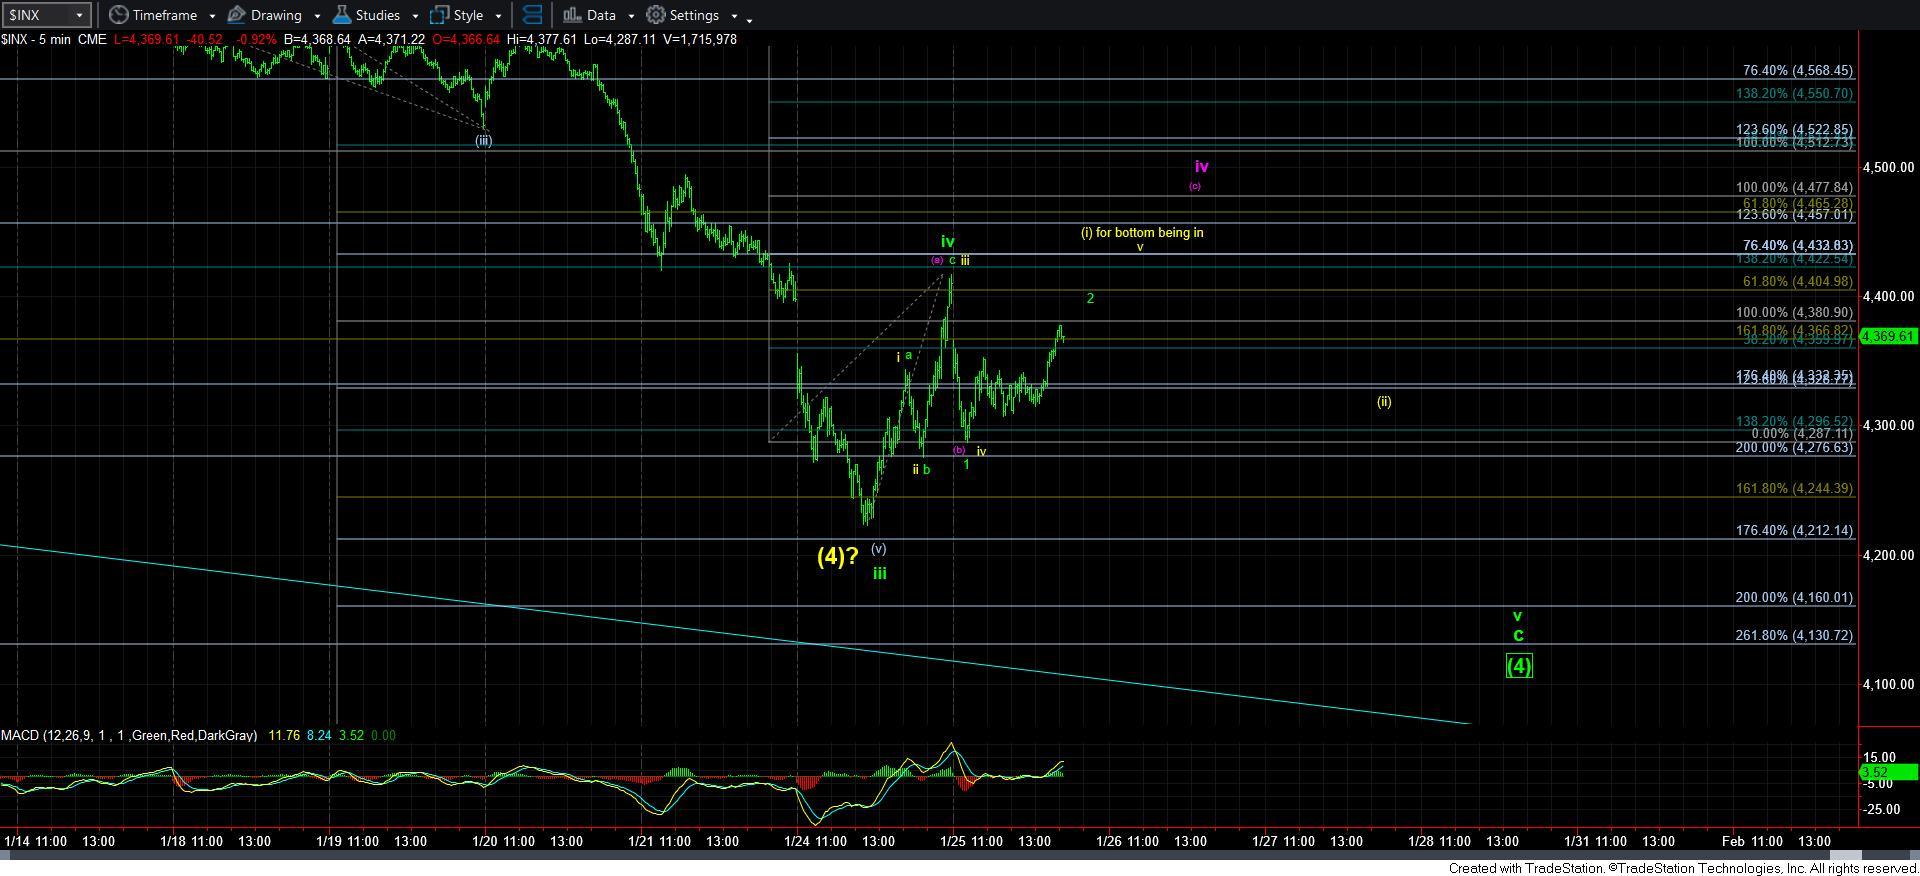
I want to take a moment to remind you that 4th waves are corrective waves within the 5-wave Elliott structure. Therefore, they are quite variable by nature, and provide much whipsaw. Therefore, I have added a larger wave iv structure, which I have outlined in purple on the attached 5-minute SPX chart.
But, due to the overlapping structure in the market, there are several other paths we are forced to track. So, right now, I am forced to track a total of 3 paths, presented in green, yellow and purple.
Let’s start with the green. That tells us that wave iv was struck yesterday, and today’s decline was wave 1 in an ending diagonal to complete wave v. But, diagonals are not terribly reliable, so I would need to see us break down below today’s low to suggest that is in progress.
The other potential is the bigger wave iv in purple. That suggests that yesterday’s high was just the [a] wave of wave iv, this morning’s pullback was the [b] wave of wave [4], with today’s rally being the [c] wave of wave [4]. That would have an ideal target at the [a]=[c] region of the 4478SPX region.
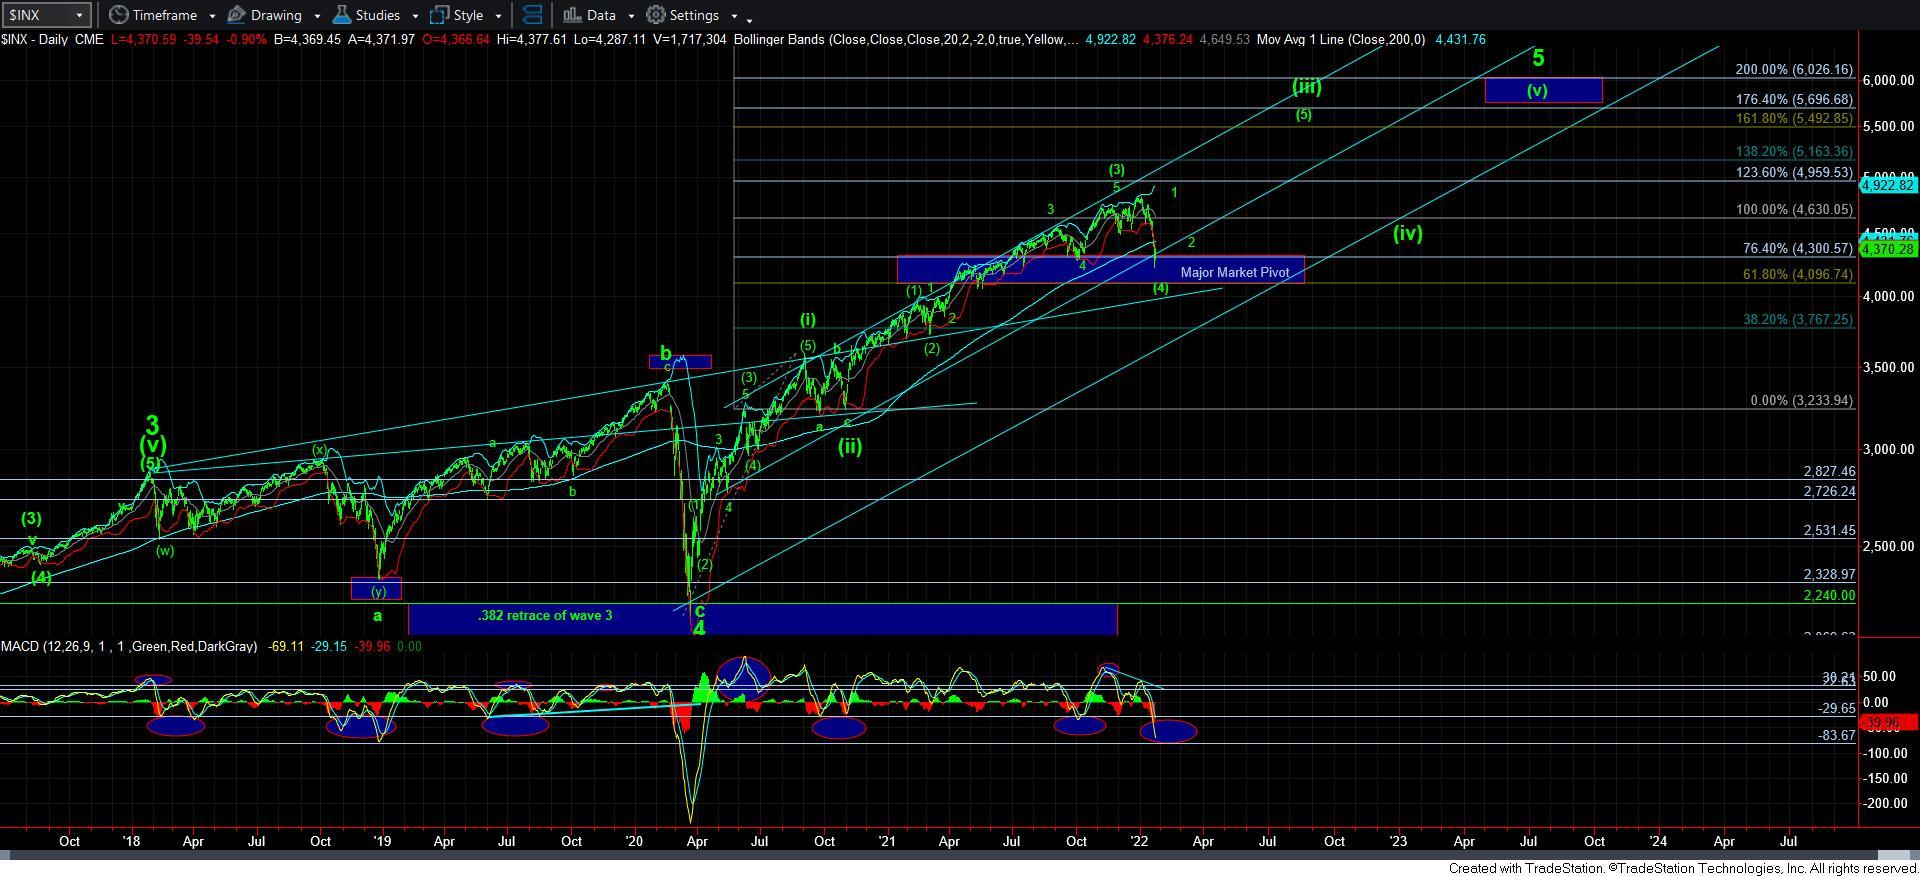
And, in between these two resides the yellow count, which would suggest the larger degree wave [4] has completed and we have moved back into the next bull phase, pointing up to 5500SPX. However, I must warn you about this. This would only take shape as a leading diagonal, as presented in yellow. Moreover, the wave iv in that LD is really much deeper than we would normally see. And, it is hard to view a market this badly oversold starting off the next rally with a leading diagonal. While it is certainly possible, I do not think it is highly probable until the market proves a few things.
First, in order for me to assume this rally is wave v of wave [i], as shown in yellow, then we really should make a higher high over yesterday’s high, but not exceed the 4434SPX region. You see, that would be the point at which wave v is equal to .764 the size of waves i-iii. So, if this is going to prove itself, then we should make a marginal higher high not to exceed the 4434SPX region, provide us with a corrective pullback thereafter in wave [ii], and then rally over the high of wave [i]. If we were to see that over the coming week, then I would likely be convinced that the low is in place, and we are rallying back up to the all-time high to complete wave 1 of [5] of [iii], which will ultimately be pointing us to 5500SPX.
Now, if this is truly a 4th wave still, there may even be some machinations that I am unable to foresee. And, that is why I always say that trying to outline a path in a 4th wave is akin to throwing jello for distance.
In the meantime, I have to say that the greater probability seems to suggest a lower low to be seen in wave v, but the only question now is if the path is through a rally to 4478SPX, or if we break down below today’s low sooner rather than later and point us to completing wave v.
For now, I would say that the market is treacherous, and it may be best to allow the current region to resolve before getting aggressive on either side of this trade. In the bigger picture, I believe the market is trying to complete wave [4] within our larger degree market pivot, and once we have better assurance that wave [4] has completed, we can begin to more confidently prepare for wave [5] to take us to 5500SPX later this year or into early next year.