4 Not Over Yet
With the market being unable to hold micro support, it was pretty clear in the overnight action that this 4th wave is still continuing. The question now is how it resolves.
While trading impulsive waves are often like printing money, I have said many times that trying to track the exact path of a corrective wave is akin to throwing jello for distance.
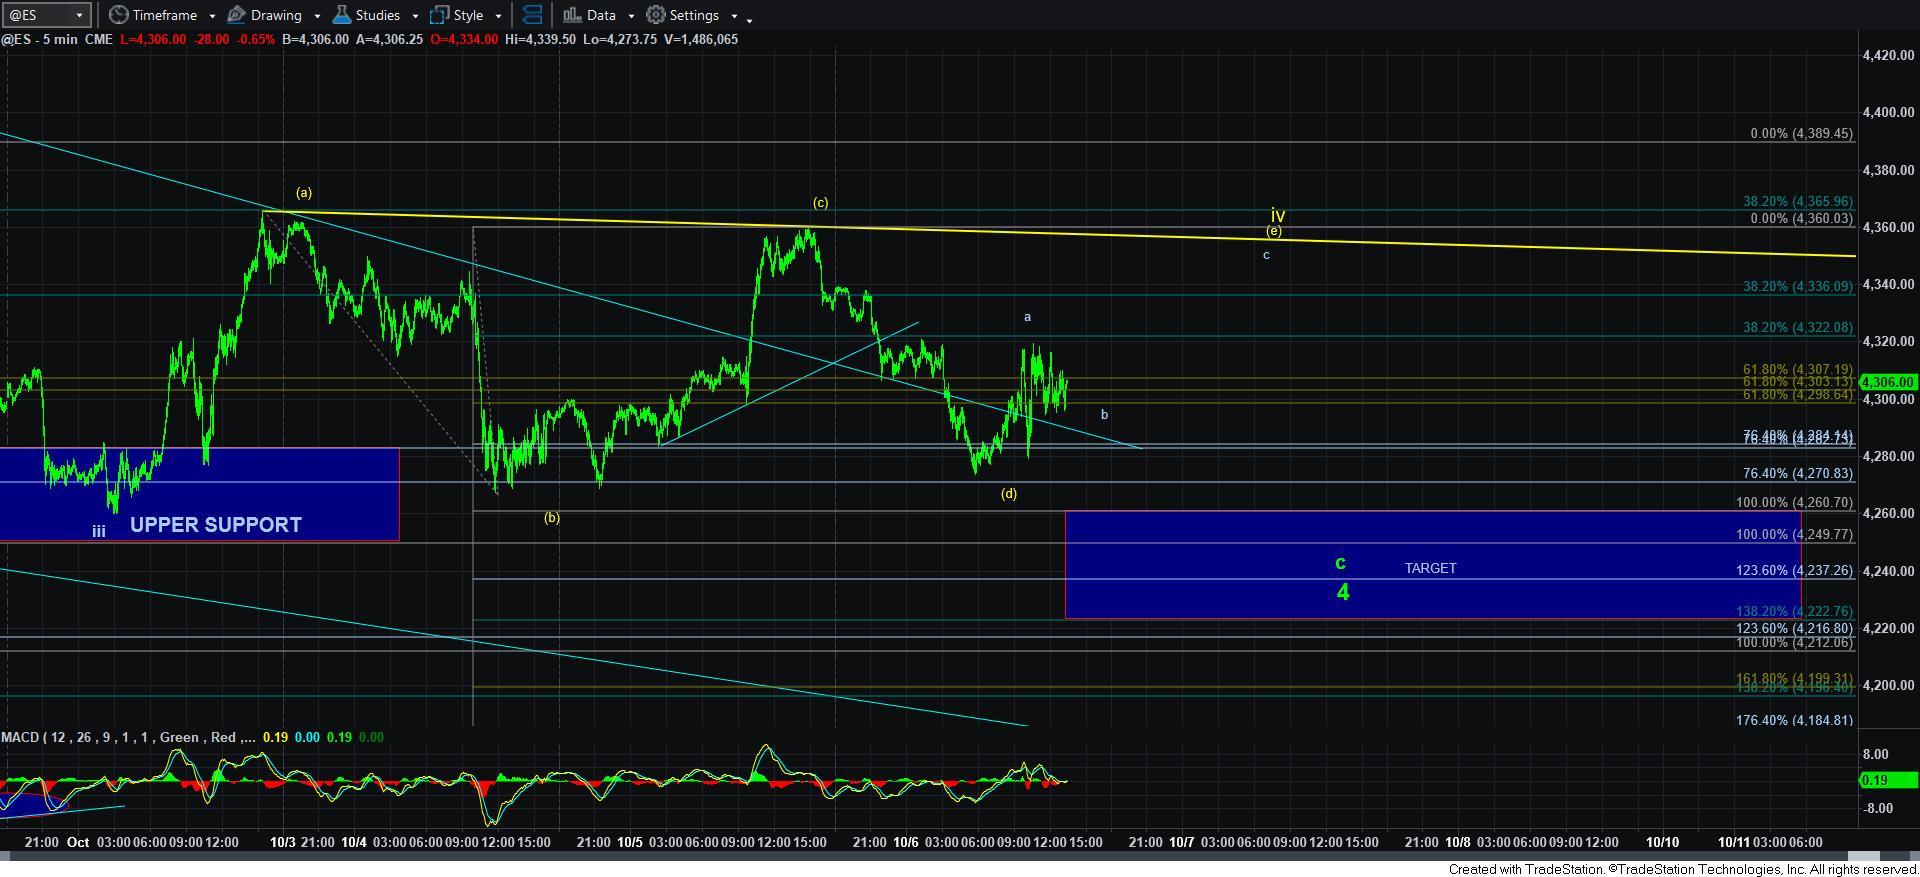
With the inability of yesterday’s rally to complete 5-waves up, and the inability of the overnight structure to continue lower to complete 5-waves down to a lower low, the market is stuck in the middle with 3-wave structures. Most often, when we are rangebound with 3-wave structures, it means we are forming a triangle. And, as of right now, that seems to be the most reasonable view.
One of the things we know about triangles is that there is at least one complex leg within the structure. Since each leg thus far has been rather straight forward, I surmised this morning that this [e] wave within the triangle may become quite complex. Again, thus far, this seems to be playing out.
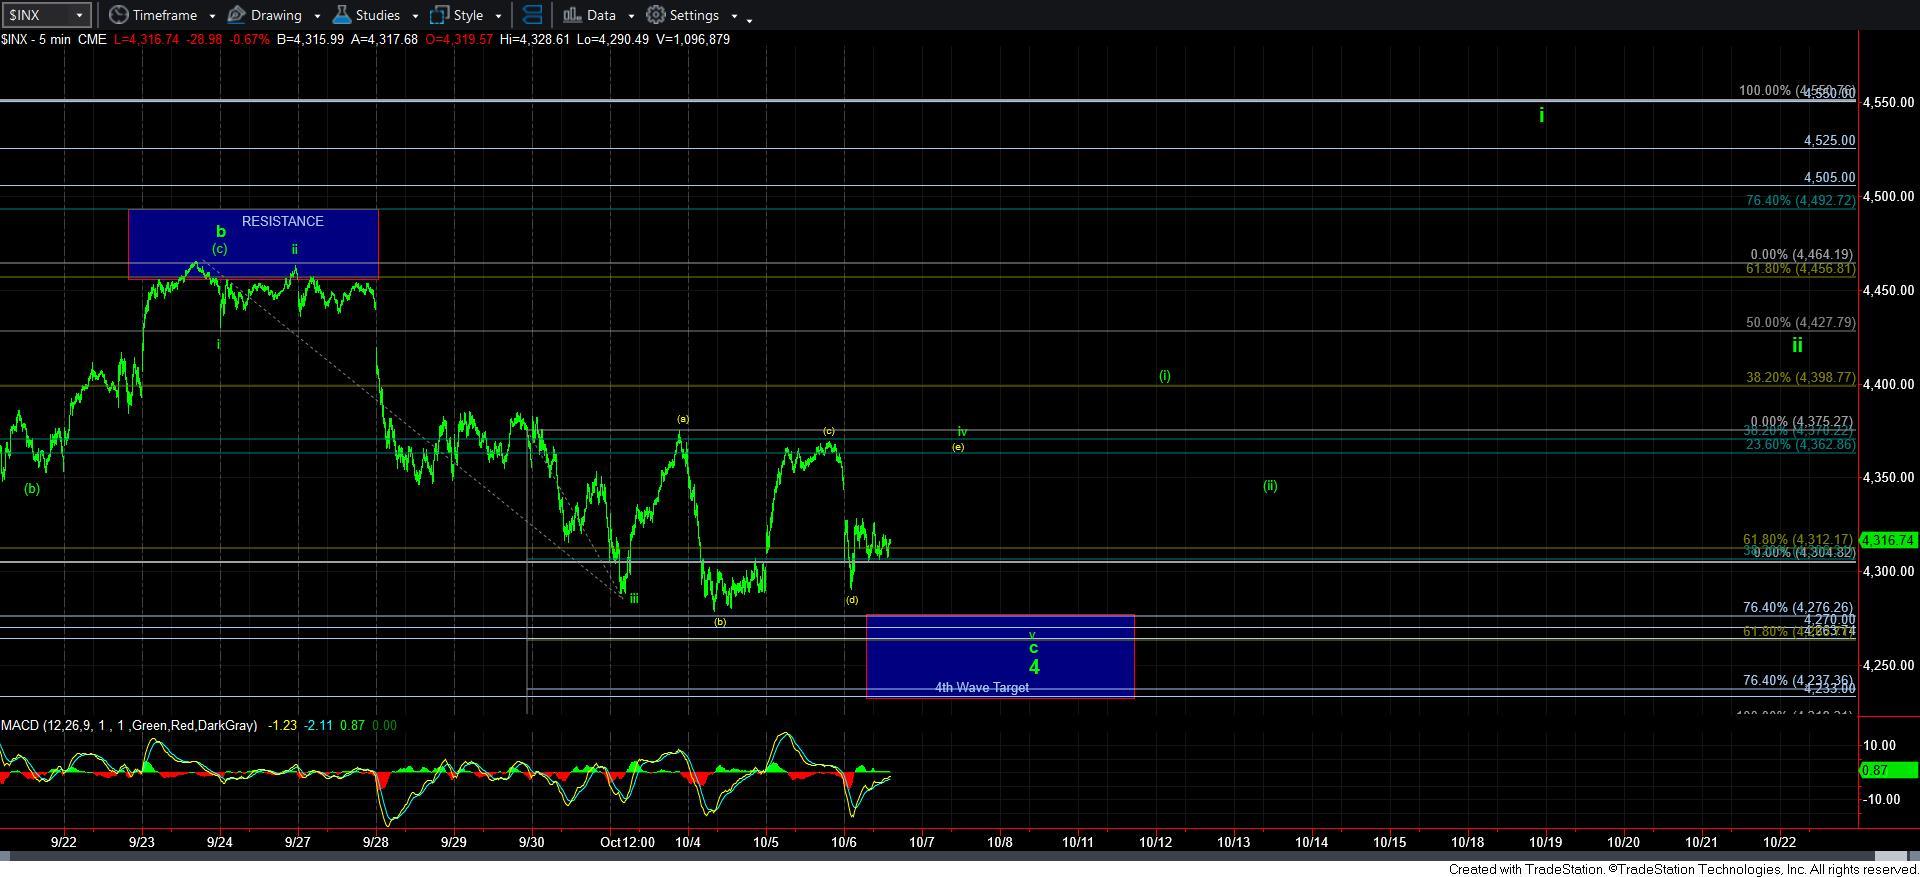
Next what we know about triangles is that they occur in a 4th wave position or in a b-wave position. In the current market structure, it makes much more sense we are in a 4th wave triangle. Therefore, it means that we are setting up for one more spike down to complete the 5th wave of this c-wave. Moreover, it is not unusual to see a spike down after the 4th wave completes, followed by a strong reversal. So, again, stay on your toes. This is not over yet.
The next thing we know is that wave 5 is often .618 times the size of waves 1-3 (with sometimes seeing an extension as far as the .764 extension). Therefore, I am assuming that this c-wave of wave 4 can complete between 4230-65SPX.
So, what we know from the current action is this:
1 - Wave 4 is not likely completed.
2 – We likely still need to see a lower low before we can even begin to consider wave 4 completed.
3 - If the market should complete a wave iv triangle over the next day or so, it would suggest we will head down to the 4230-65SPX region to complete wave 5.
4 – An impulsive reversal off the next low is our signal that wave 4 is done, and wave 5 to 4900SPX has begun.
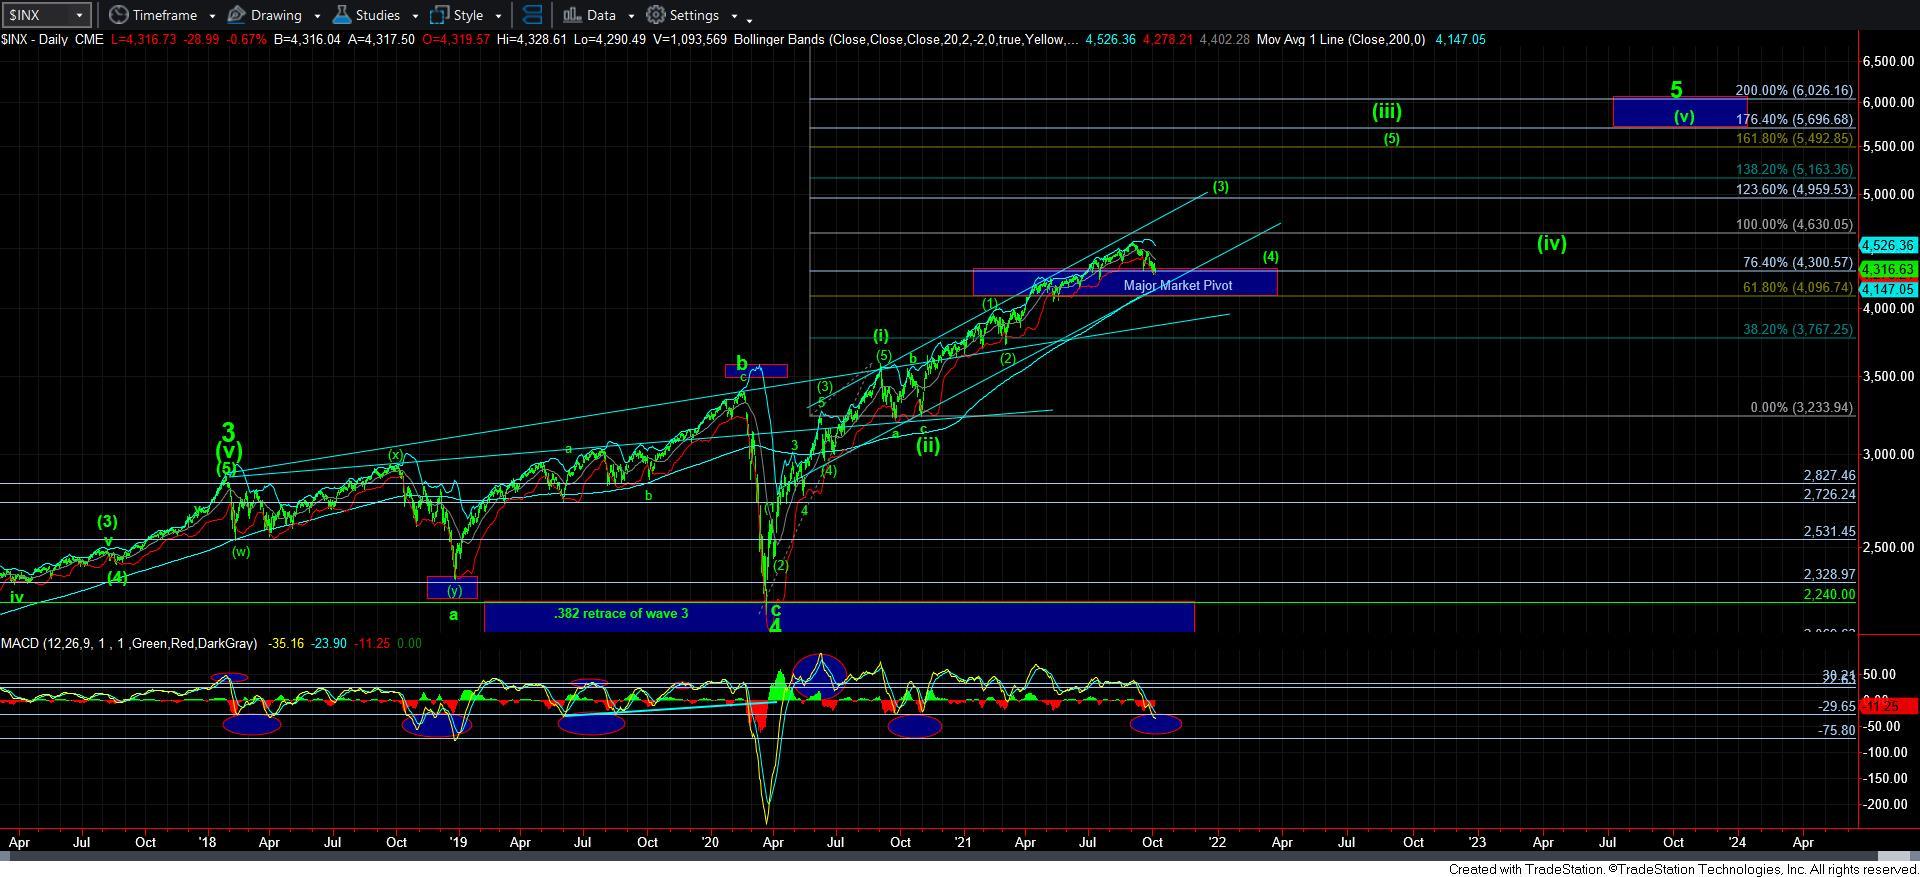
As far as other factors to focus upon, take note that the SPX MACD on the daily chart has dropped even further into the standard support zone. We are now more sold off than at any other point in time during this entire rally since it began in March of 2020.
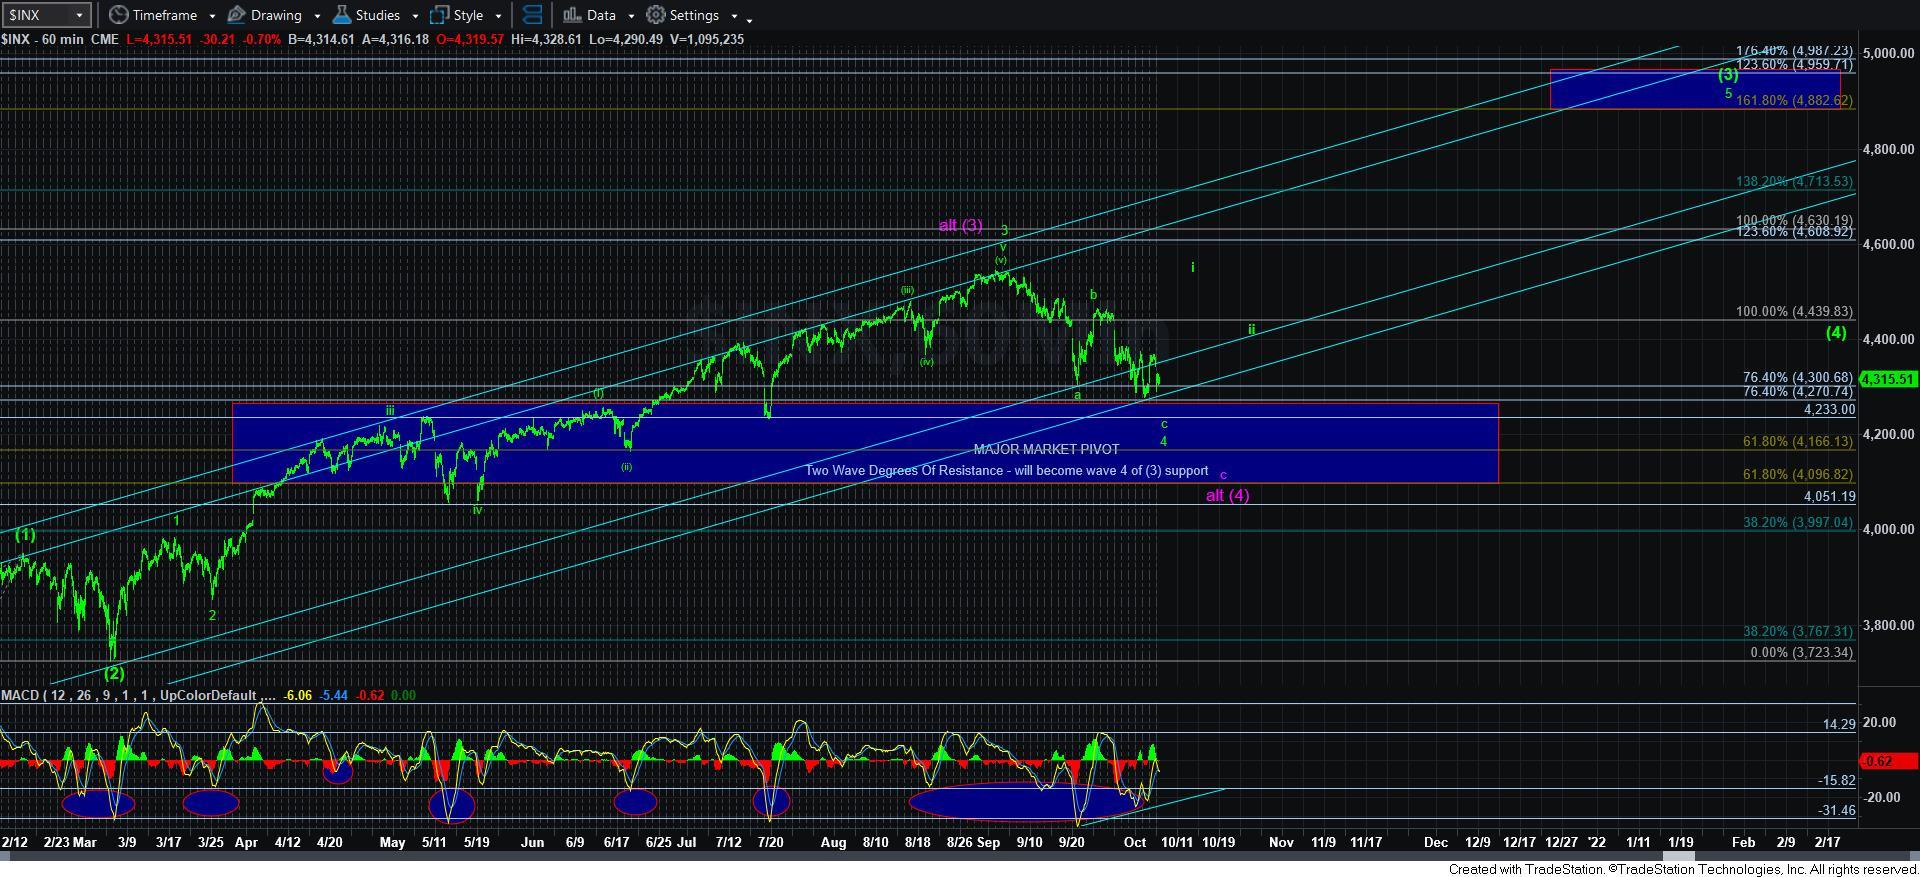
Lastly, some of you have asked me about the purple alternative count, so I thought I should take a few words to elaborate.
I really do not like it because wave [3] came up shy of the 1.00 extension of waves [i] and [ii]. But, if the market drops into the 4050-4100SPX region from here, then I will have to more strongly consider that potential count. It would mean we are one wave degree ahead of where I believe we are at this time. But, it would also mean that the next rally would be wave [5] of [iii], meaning that the minimum upside target for the next rally would be 5160SPX, the 1.382 extension of waves [i] and [ii]. But, again, this is not anywhere near my preferred view at this time.
Overall, I still view us in a bottoming structure, which when completed, will begin our next multi-month rally phase to 4900SPX. Right now, I have no clear indications that this bottom has yet been struck.