3100ES Is Still Important Short Term Support
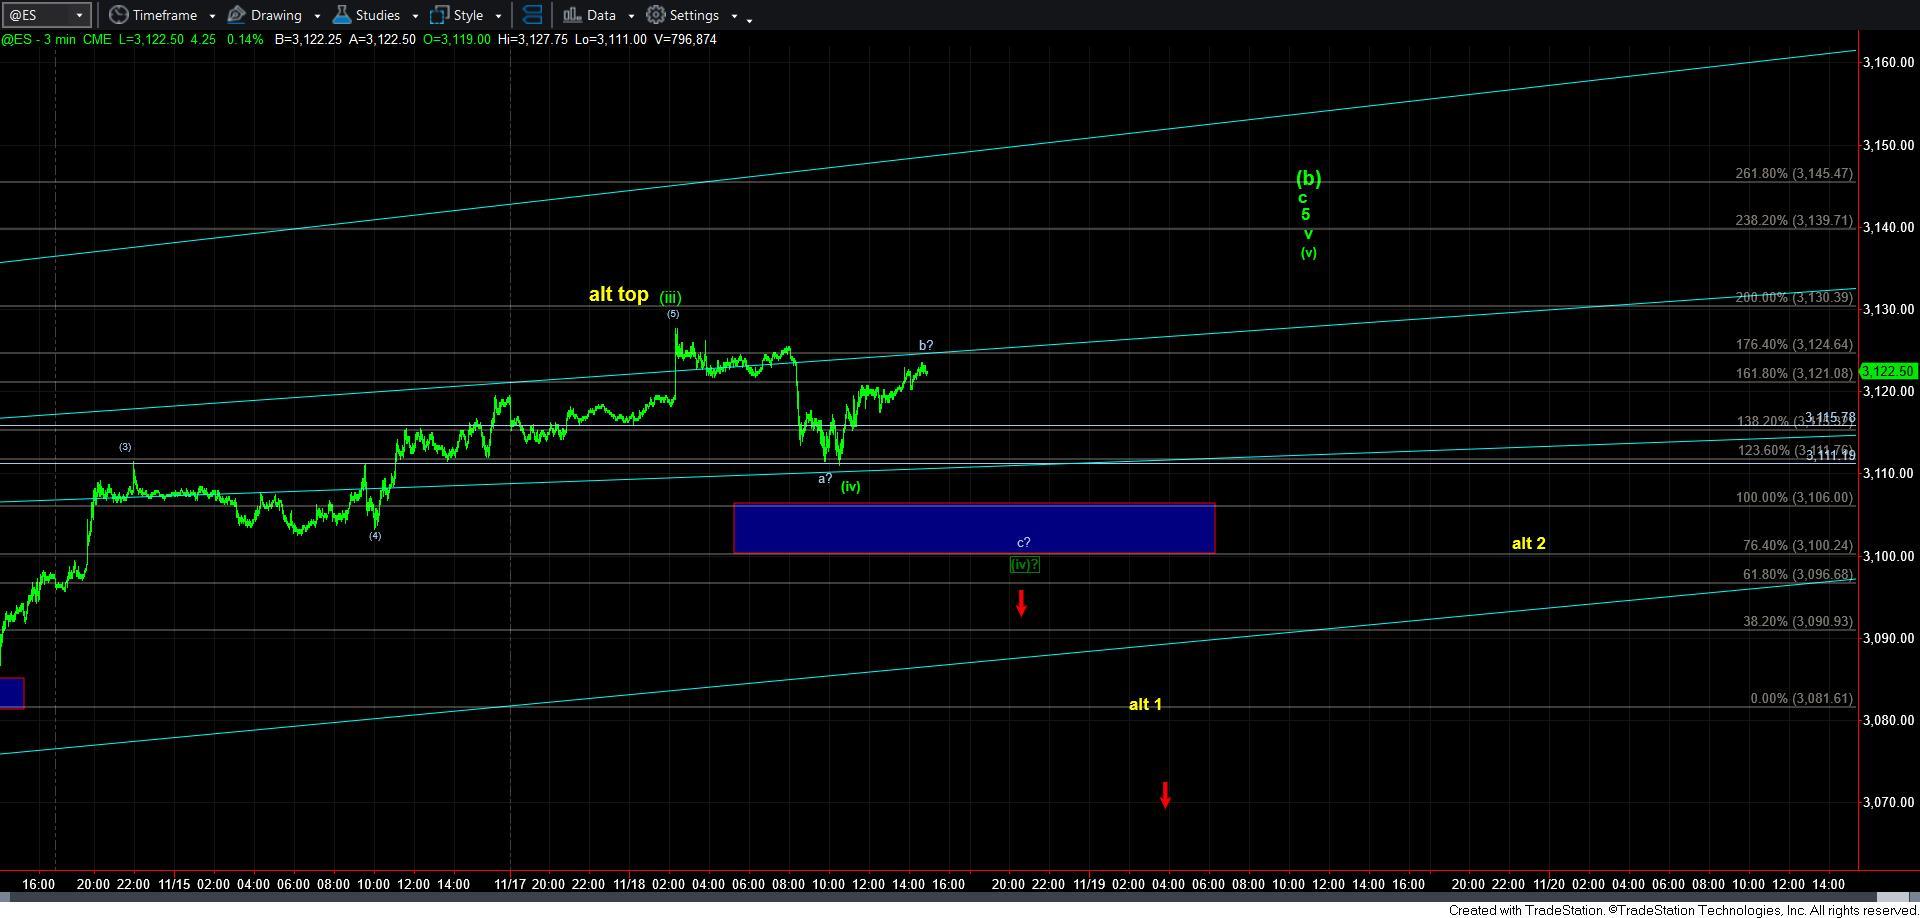
With the market still remaining over 3100 support, we still have no indications that the top has been struck, despite the market being quite stretched up here.
So, until we actually see a break down below 3100 (which I still want to see this week), I am viewing the market as trying to complete wave (iv) and (v), as shown on the ES chart. While wave (iv) may have completed at the low today, we can even drop down again and strike the 3100-3106ES support before we rally up in wave (v).
Alternatively, should we see a direct break down below 3100, then we can track the potential for 5-waves down towards the 3075 region. But, again, until we actually break support, the market can still stretch even further, just like we experienced in January of 2018.
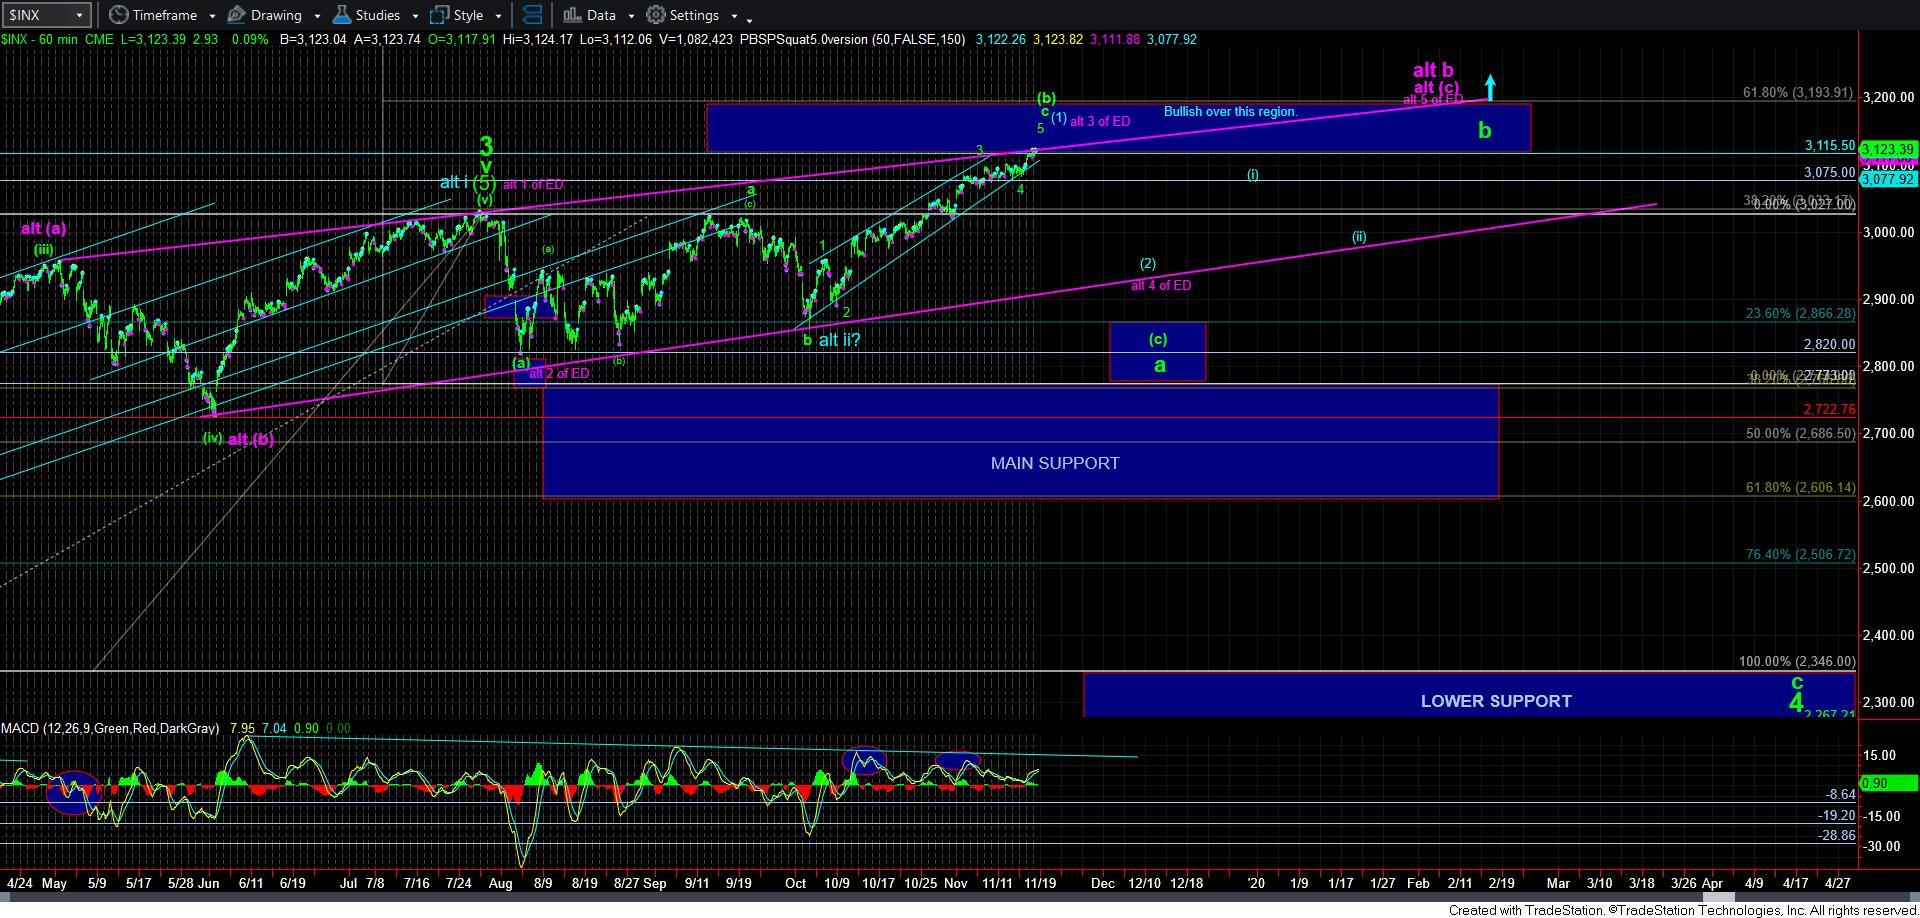
Now that I repeated myself yet again, I would like to move on to an added point of clarity to my larger degree charts, wherein I outlined the potential ending diagonal that many of you are following (noted in purple on my charts).
While there are some that are tracking it as a 5th wave to the top of wave 3, based upon the timing proportions with the initial segment of the rally off the December lows which I addressed in my update last weekend, that does not seem the most reasonable count to me. So, I want to explain a bit further how I would count this diagonal – assuming it does prove itself.
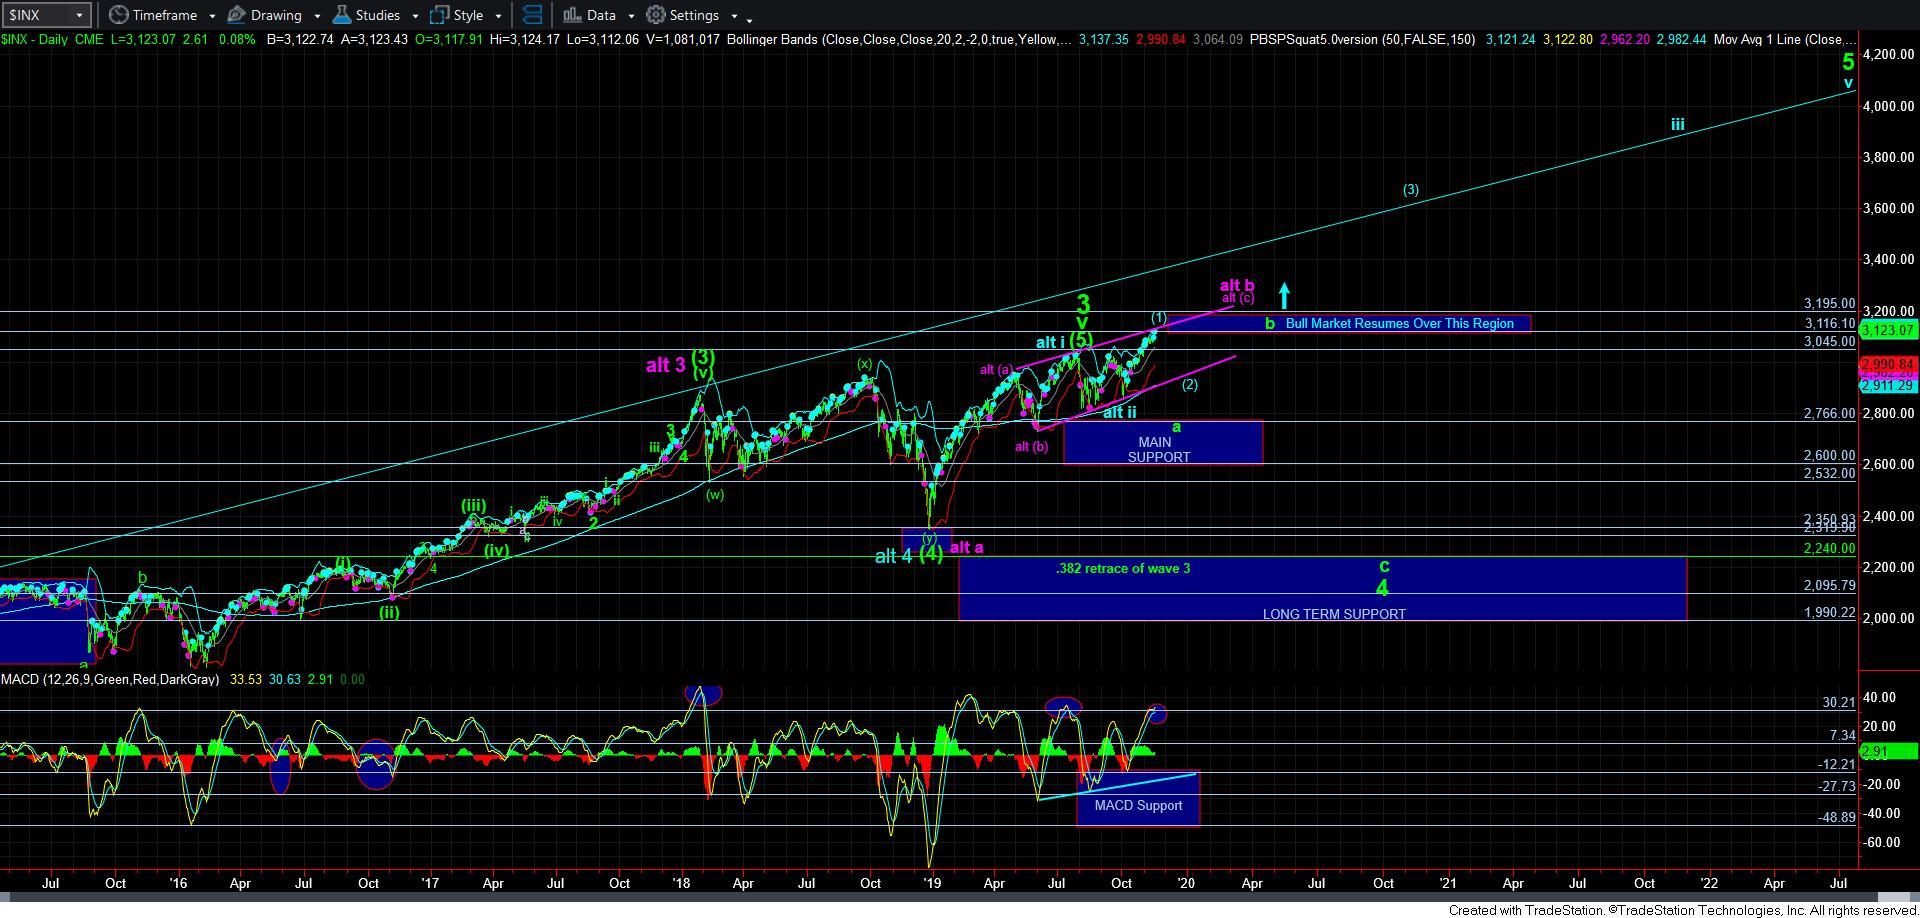
If the market does provide us with a diagonal structure over the coming 3-4 months, then I would count that as a [c] wave within a much larger b-wave, as outlined and labeled in purple. That means that the bottom we struck in December is the bottom of the a-wave of 4, with this being an a-b-c rally for the b-wave of 4 in an expanded form, with the green c-wave well below us now being the result when this diagonal completes in the first quarter of 2020.
Again, should we fill in this diagonal over the coming months, then this makes the most sense to me based upon proportionality between wave segments, as well as the many different reasons which I have outlined many times in prior updates. But, for now, this remains an alternative to me, as I still prefer the green count.
I am sorry for the added levels of complexity, but until the market resolves its intentions up here, I have to consider these potentials over the coming months. And, until I am confident that we are setting up to break out to 4000, I am going to maintain a cautious stance until we can discount these bigger correction patterns.