10/23 Updated Anslysis
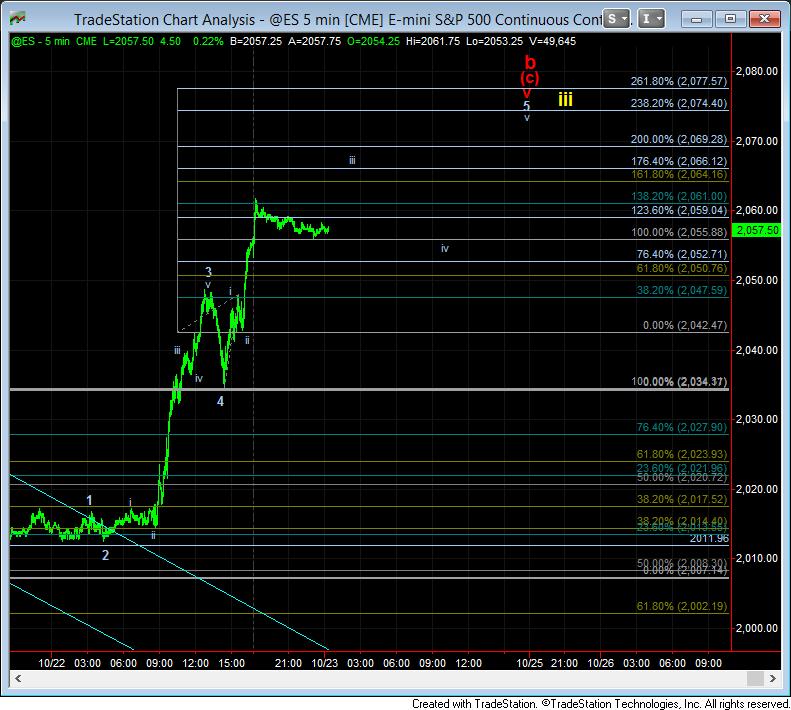
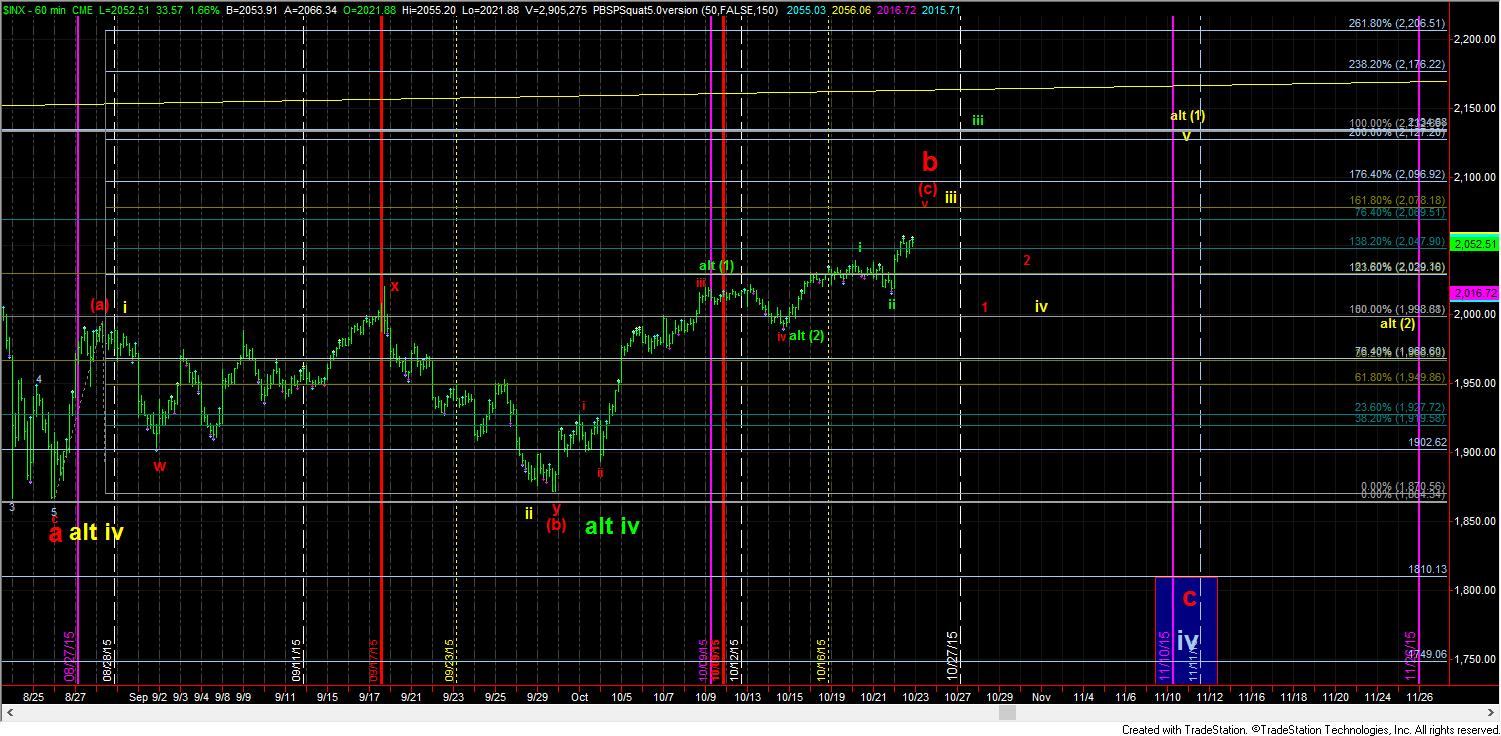
I have been doing a lot more work on the micro counts and how they fit into the larger counts. And, what makes the most sense here is still the b-wave, or the yellow count. And, as I have ben saying for quite some time, both counts suggest that the market must stay below 2078SPX (yes, I am modifying from this evenings 2065SPX), and then break down below 2047SPX on the way back down to the 2000 region. How we move back down to that region will provide us the difference between the two counts. But, even in the yellow count, we will still need a wave (2), likely dropping down into the Thanksgiving time frame.
However, if the market moves through the 2078SPX level, then it makes it much more clear that the green count is in play, which, at this time, is not my preference. It is hard for me to accept that the market is simply going to slice through a strong resistance zone, and then just move through the all time highs in this count. Yet, I have it on the chart for a reason, and it is something to be considered should we see a direct move through the 2078SPX level.