100 Points Of Indecision Overhead
As I warned all our members several weeks ago that if the market failed to follow through below 2720/35SPX support, it will project us back up towards the 2900 region, and make this market much more complicated to discern in the near term. And, if we are able to move over the high we struck this week, then it will increase the complexity even further.
Unfortunately, trading out of a 4th wave – especially a larger degree one – is never easy. And, without having seen a 5-wave c-wave decline in our larger degree structures, we have no confident way of suggesting that a larger degree 4th wave has completed. For if you remember, the bottom we stuck in December of 2018 was a 3-wave decline.
So, I am going to attempt to review what the complexities are, and how I plan to resolve them.
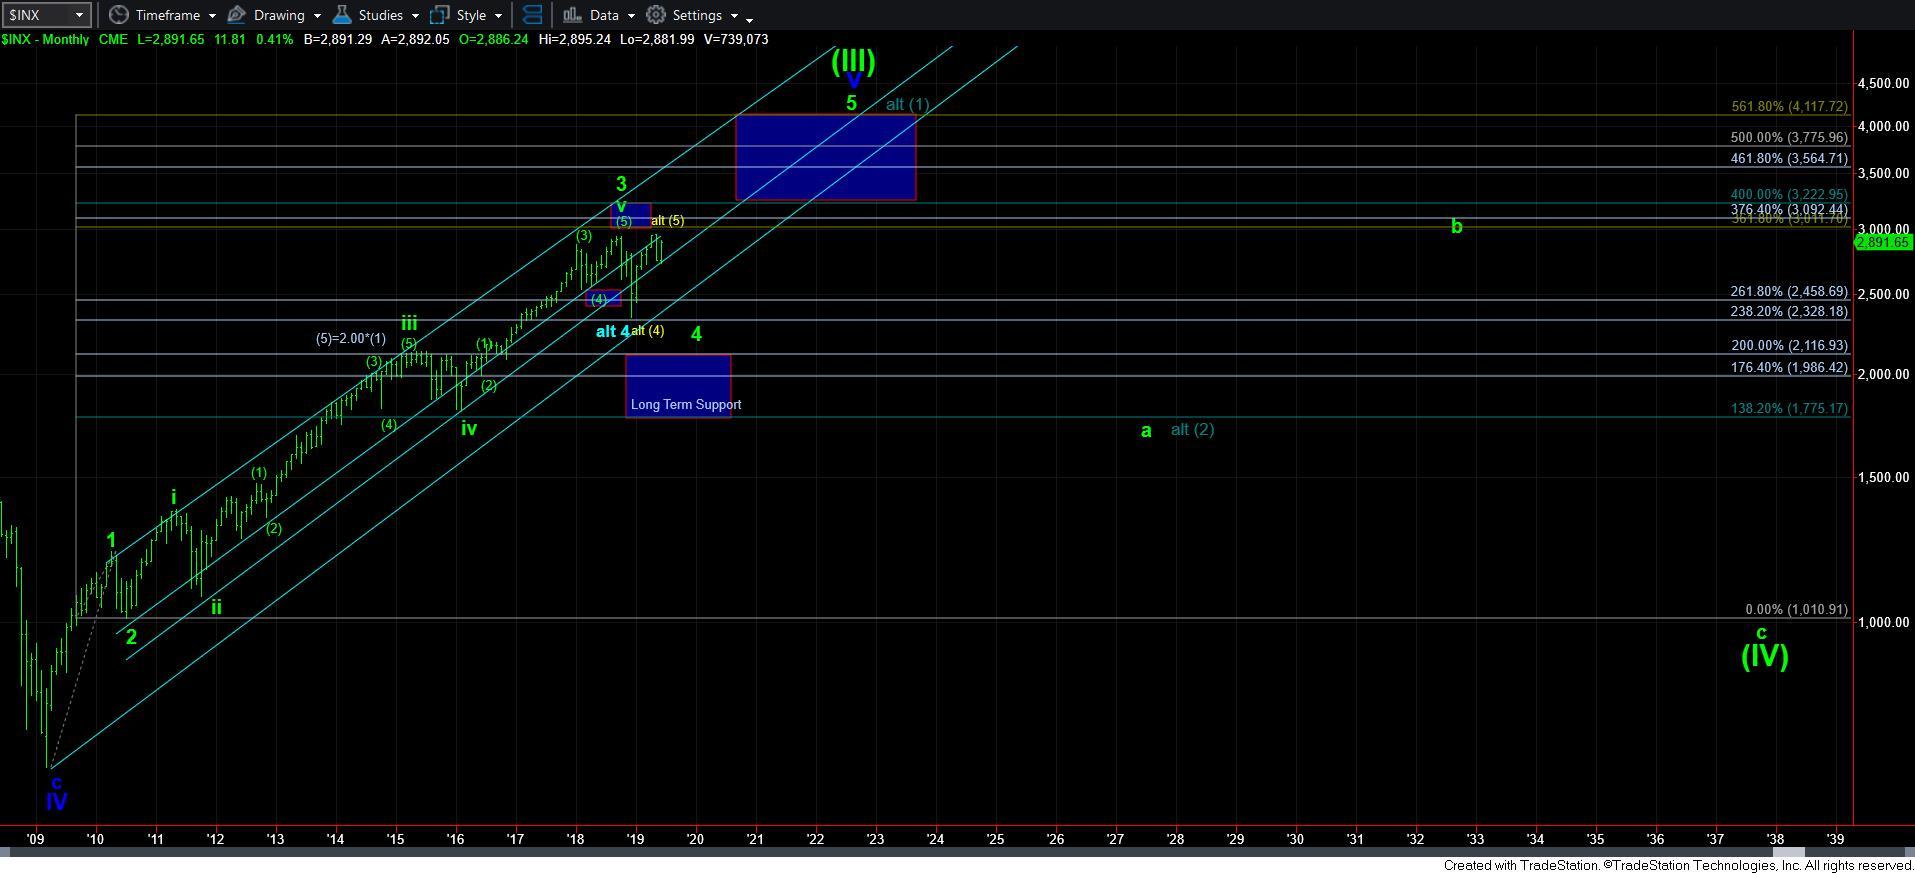
But, before I go into the resolutions, I want to again reiterate that I still think we need a bigger 5th wave rally off the 2009 lows to complete a larger degree 5-wave structure off those lows. And, I think it can extend us as high as the 4000 region as I have mentioned many times before. However, the current posture of the stocks we track in our StockWaves service does not support a rally right now to the 4000 region, so I still have to view that as my least likely potential, until proven otherwise. And, I will outline herein how it can prove otherwise.
As I write this update, I can still count the rally into this week’s high as a 3-wave rally, which extended just beyond the 1.00 extension off the early June lows. However, if we rally through this week’s high, then it opens the door to several potentials I will be tracking in the SPX. So, rather than scramble if the market were to rally into next week, I want to prepare you now so that you can create your own plan should we rally further. I am presenting these potentials as larger degree perspectives on my monthly chart so as not to get caught in the forest looking at only the leaves.
So, as long as we remain below this week’s high, immediate bearish potential remains on my charts, as I have outlined of late.
However, if we are able to exceed this week’s high, then it opens the door for the market to rally up as high as the 2965-2990SPX region in a 5-wave structure off the June lows over the coming week or two. And, there are several ways that can be viewed. But, the main point upon which you will have to focus is that should we see that rally to those levels, and then the market pulls back, the NEXT TIME we rally over that high we strike in that region will be the signal that we are likely heading to 3800-4100.
Should we rally to 2965-290SPX, there are several ways it can count. While it can count as the start of the rally to 3800-4100 (with the confirmation noted just above proving that), it would more likely count as just completing the top to wave 3 at this point in time, with the low in December being a 4th wave within the wave V of 3, as I now presented in yellow on my monthly chart. (Please look at the attached monthly chart so you will understand what I am saying). That would mean we would likely be in for another long period of downside consolidation for wave 4, as we would only be completing wave 3 off the 2009 lows at this time.. And, if we do break out to the 2965-2990SPX region, that seems to fit more in line with the underlying stocks within the market.
That means that if we break out over this week’s high, I will be forced to view the yellow count on the monthly chart as my primary expectation. However, take note that while there are a number of stocks that already seem to be within their wave 4, it is not uncommon for those stocks to complete their 4th waves while the larger market completes the a-wave of 4. That means that those stocks would rally in wave 1 in their final 5th wave while the rest of the market gets a b-wave rally. AAPL may be an example of one such stock. Those stocks that would be leading the market at that time would get a deep wave 2 corrective pullback, while the rest of the market completed its c-wave down in the bigger 4th wave at that time. So, alignment within the market would not be a problem for this count. Yet, there are so many stocks that still need a larger degree 4th wave, and this count would fit that rather well.
But, please take note that the yellow count would only take primary status if we break out to the 2965-2990SPX region in the coming week or two. As long as we remain below this week’s high, I can maintain an immediate bearish bias. And, breaking down below 2865SPX would put us back on track for the more immediate bearish potential.
That leaves me with the last alternative I will turn towards. And, that is the blue count on the monthly chart, which suggests waves 4 has completed. Again, I want to stress that I see very little that supports this potential to me at this time. However, if the market were to pullback correctively off the 2965-90SPX region, and then rally strongly back over it in impulsive fashion, the market will force my hand to move to the long side, and trade the long side to the 3800-4000 region (another 25%+ higher). But, I want to stress again that this is on the lowest of probabilities for me at this time, as I see the least amount of support for this potential in what I am reviewing before me.
While I have noted that it is extremely difficult to trade out of a 4th wave consolidation, it is infinitely more difficult when the market does not provide us a 5-wave c-wave decline to signal that it has likely completed. We have not seen any such decline, and it has complicated matters on the larger degree perspectives. So, for now, I am still do not think that we are starting the run to 4000 just yet, but will remain open to it as outlined above.