Twists and Turns - Market Analysis for Feb 15th, 2019
 By
Ryan Wilday
By
Ryan Wilday
I have had a TON of folks on the board and elsewhere suggesting that BTC is in for a long base pattern. Honestly, just as folks prodded me to turn bullish in November with clear bearish price action, I get skeptical when I hear the same thing from too many.
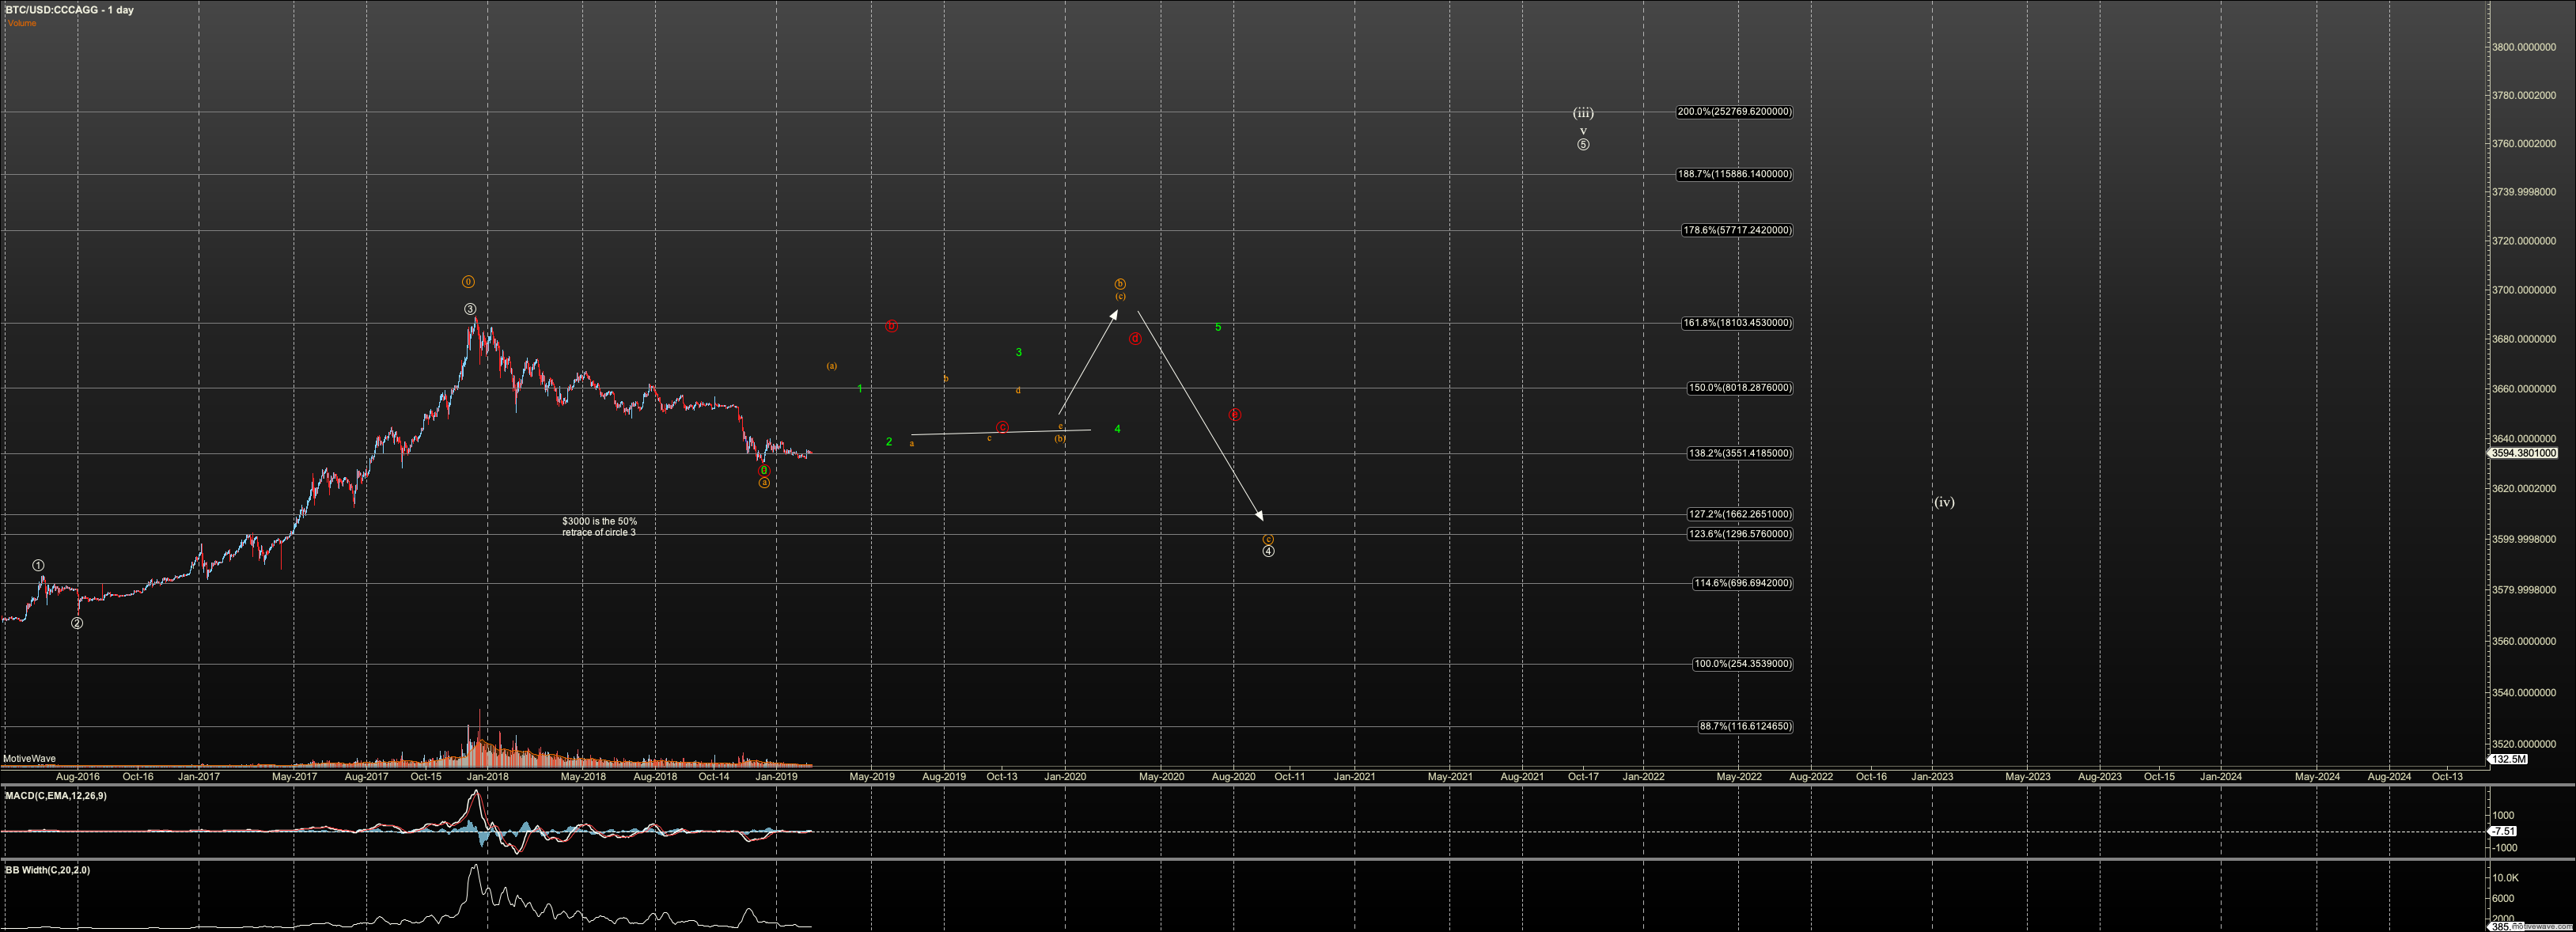
But the question I've heard is whether this fits in the EW, and the answer is absolutely. This is a garbled chart, so bear with me, but on the long term chart there are many ways we can see this bottom hold and yet not move very fast to that $65K to 225K target.
Orange is the most evil, bearish scenario where iv has not yet bottomed. Red is a triangle. Green is an LD similar to the post Mt. Gox bottom.
All counts are swing traders markets. One can profit immensely in swings on these charts.
But EW is not going to tell me which path from here. The form we have is a classic bottom for BTC. WXY. but I wont' take that for granted.
I also think we can see BTC do one thing, and other coins, hight beta, grind higher, especially the coins we have in potential third waves starting (EOS, ETC, LTC, ETH). Bitcoin is a institutional asset now, so it's liquidity is increasing, mostly OTC, and it's volatility is declining.