Tracking Pivots - Market Analysis for Sep 25th, 2019
 By
Ryan Wilday
By
Ryan Wilday
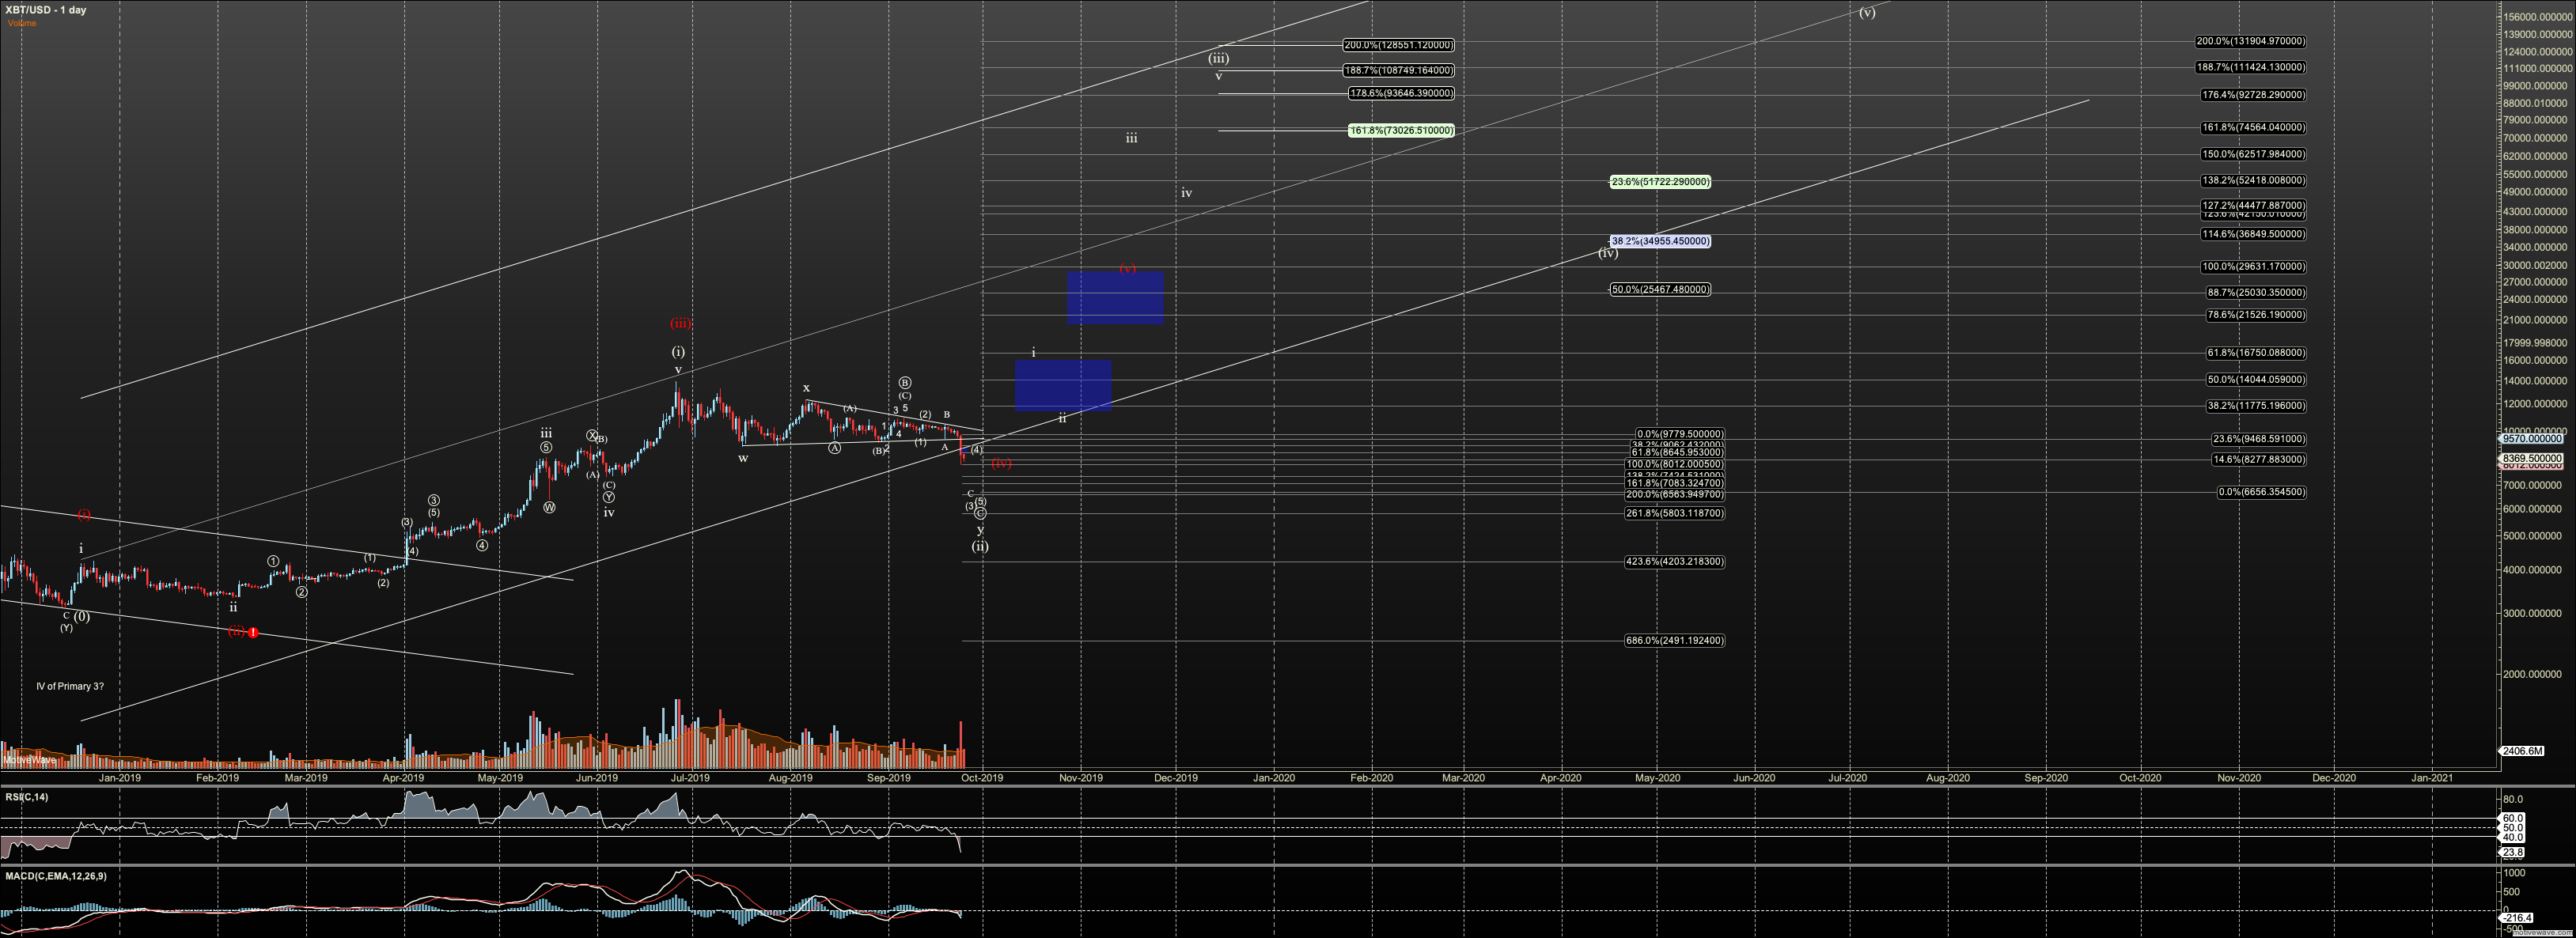
While we are slow, let's zoom out on Bitcoin.
The first question on this chart is whether we have red wave 4, or white wave 2. White indicates primary but I am not going to stop watching red until invalid.
The first question is where this correction lands. Red 4 is not invalid until $6800 is taken out here, however it declines in probability if we break $8080 here. However, I'll still track red 4 if we see the latter come to play, until certainty shows.
The next question is where our fractal moves. If we are in red wave 5, and bottom near where we expect, we should see a five wave rally to between $20-27K, with the lower end more typical.
If we have white count, I expect a five wave rally to be limited to $16K in the first wave of three. So not completing fives under $16K is the first warning of red count. Next in white the bull back in the second wave of three, should setup and blow through $27K very quickly as the third of the third is typically the 'fast FOMO' wave. We should move from $16K to $60K fairly quickly.
Note that timeframes is not a given. I am putting labels in a very aggressive timeframe but that may not be what we see. What is important is these price pivots and how price interacts with them.