The Coil - Market Analysis for Nov 26th, 2017
 By
Ryan Wilday
By
Ryan Wilday
I was asked what 'coiled' meant. I am stealing the term from HD in the main room who again, does some great work with just basic technicals. In my own words, this occurs when MACD crosses 0, then starts to cross above zero. I also often draw trendlines across MACD peaks, and usually they are testing a down trendline. Incidentally EOS displayed this before breakout. I should have caught it.
On the RSI, You usually see a pop to overbought (+60), then a refusal to go oversold (+40). Again, in HD's work and I've adopted, I view RSI as the opposite. I want to see overbought signals to say that momentum has shifted. Continual overbought indicators that diverge from price are a different matter and can signal a top.
See STEEM chart nicely coiled.
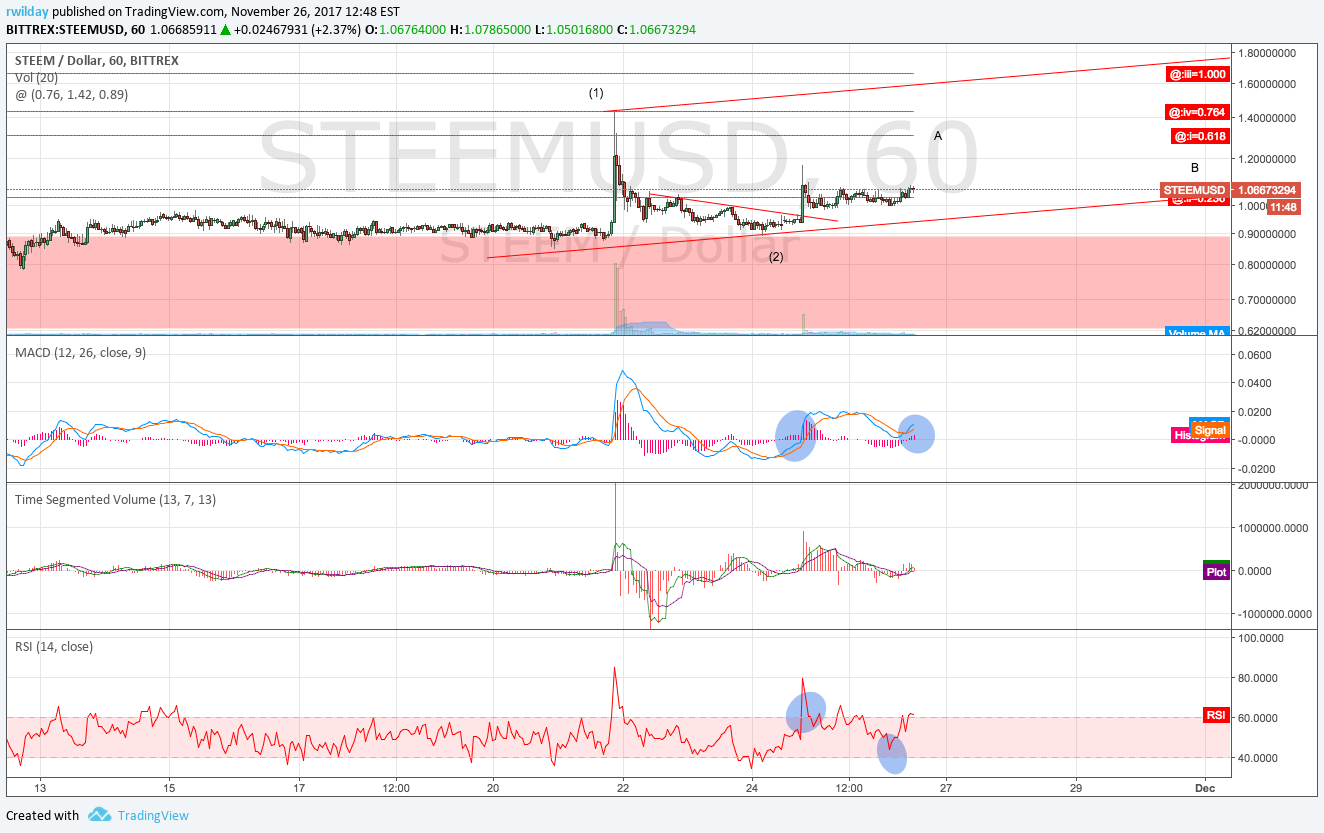
STEEMUSD
