Market Analysis for Aug 25th, 2019
 By
Ryan Wilday
By
Ryan Wilday
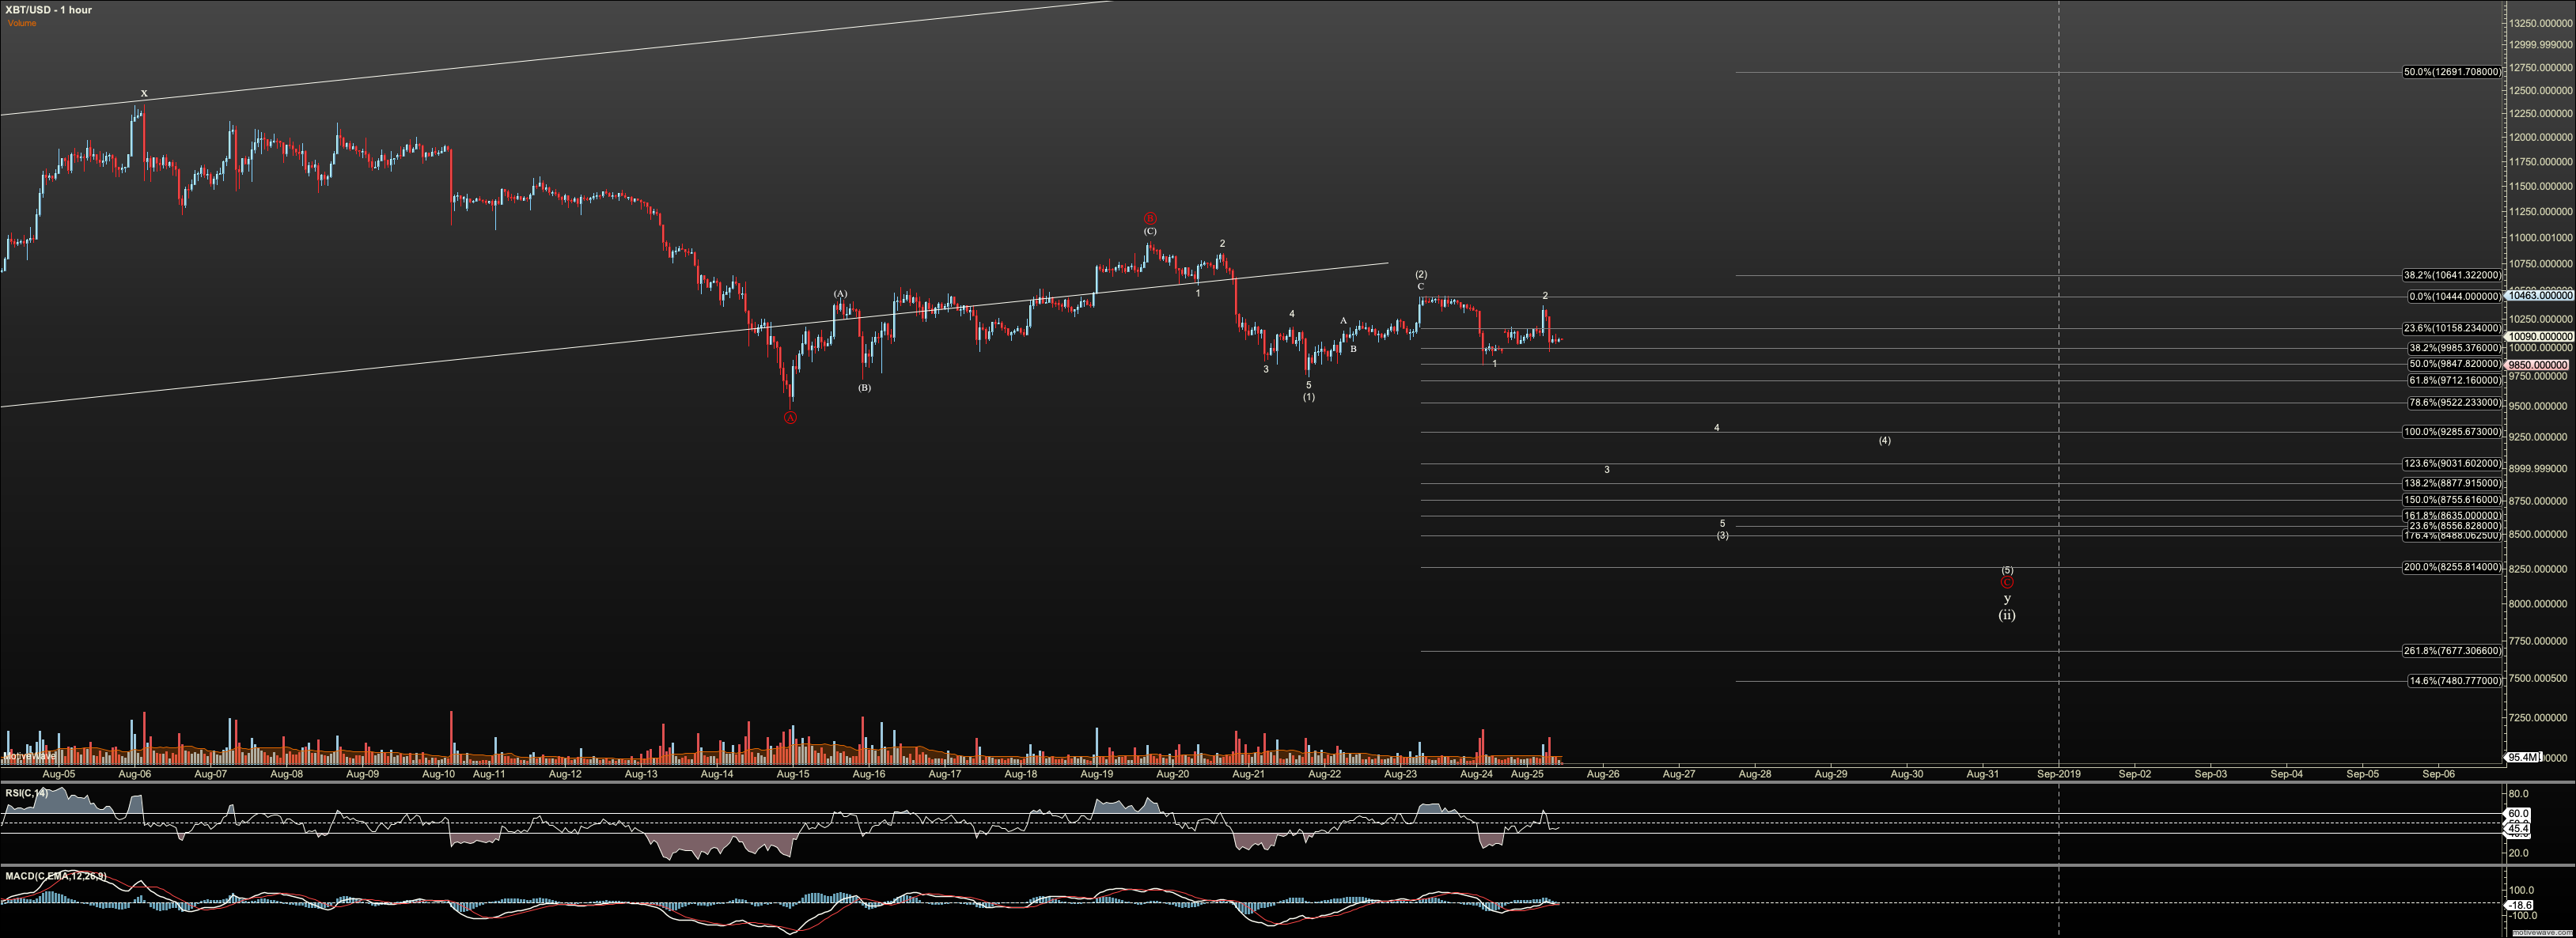
I can consider many pattern possibilities now, but currently in micro, we are seeing back to back, downward impulsive structure which gives good odds on direct follow through to the next key support. If you've followed the youtube vids, and my updated charts, you'll know that I expect a tradeable bottom between $8400 to $7600. I explain on my video: Using Elliott Wave how the first trades are the 'knife catch'. Because the stop is still broad with the bullish line in the sand still down at $4300, the trade starts small. Once the market shows an impulsive bottom the low can be used as a stop and the position can safely be increased. Will this be the bottom that leads us to the current projection, roughly at $129K? I can't say for sure of course. But I do know once we can get a tight stop under the market, the Risk to Reward (R:R) is simply ridiculous. I foresee a trade coming that risks $500 for a return of $120K for each whole bitcoin. I am not joking. So, I take it. I'll make several adjustments along the way adding and taking off, but for the simple, it is that simple. It either breaks or goes. I'll let the market prove.
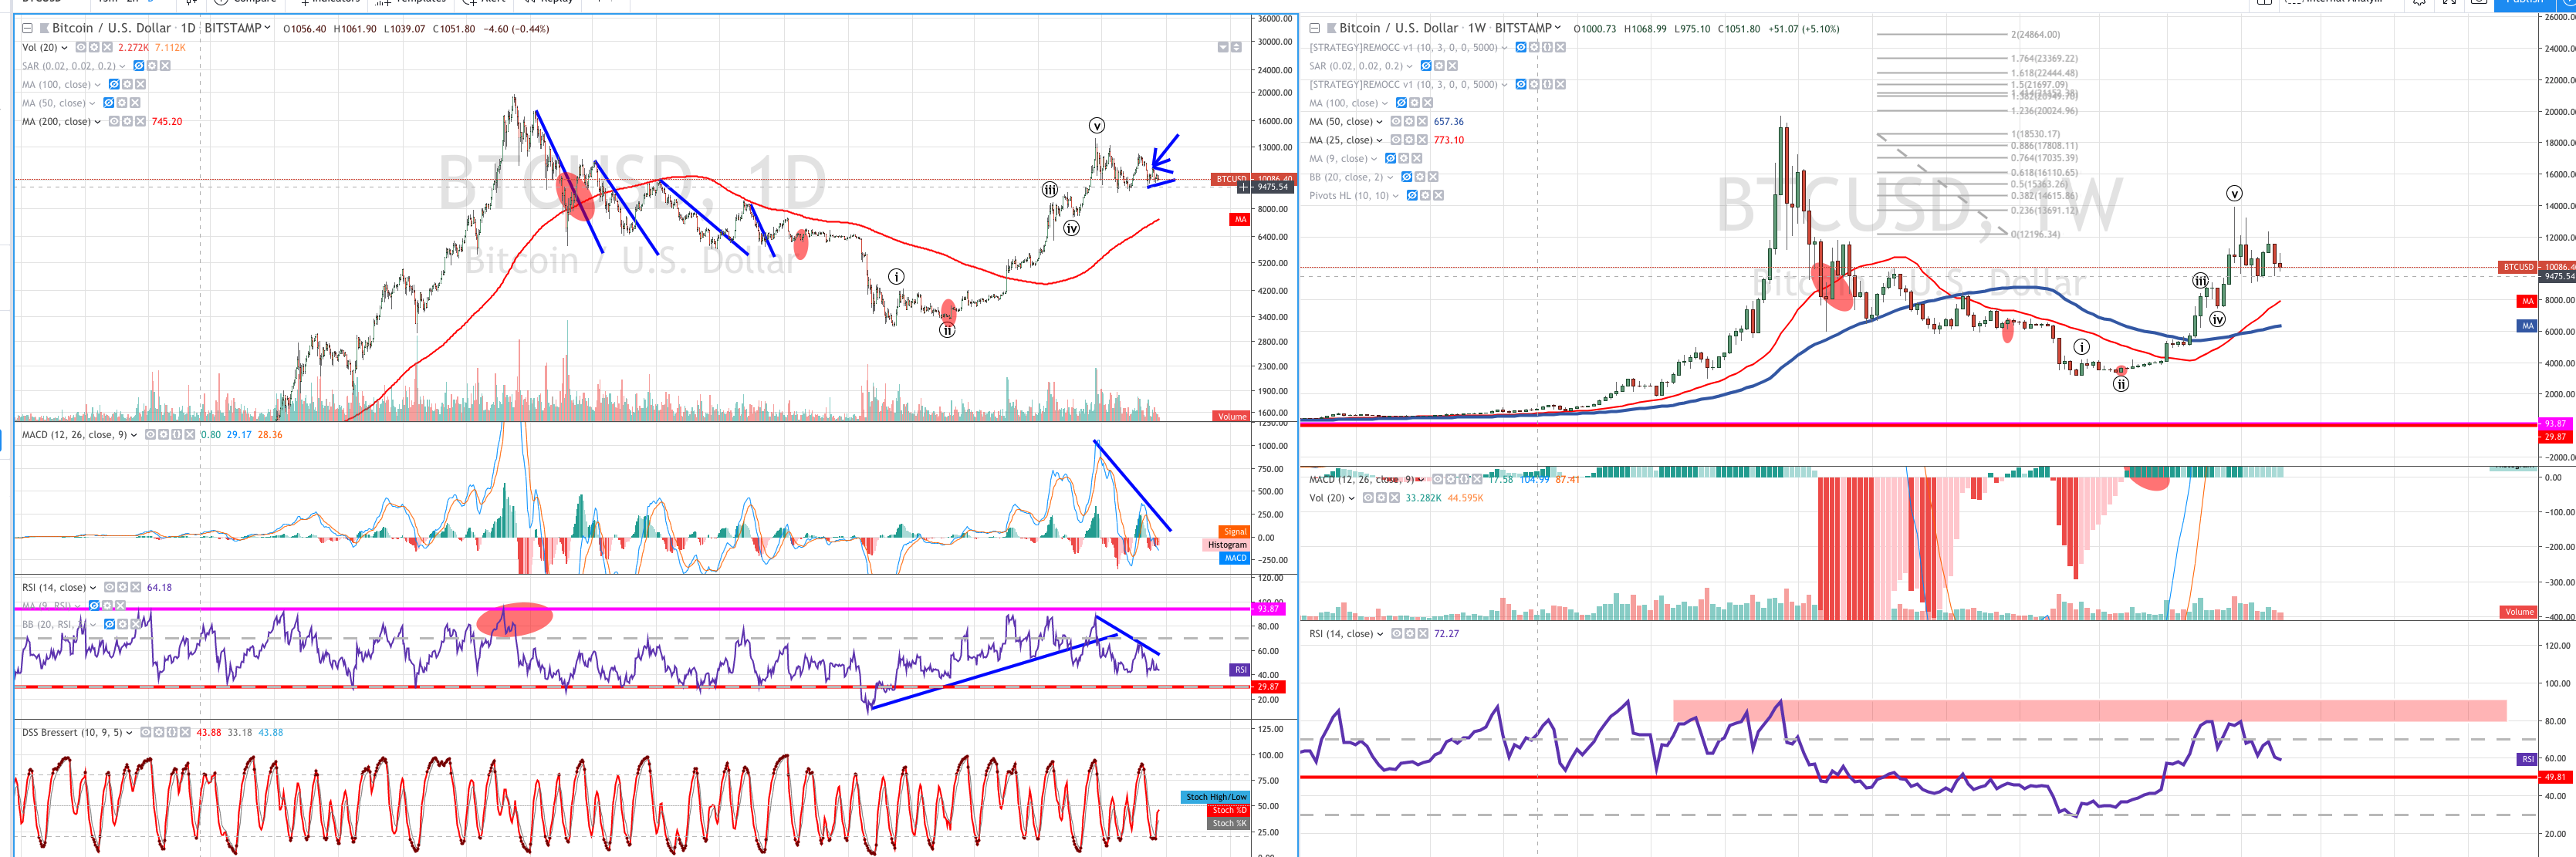
Also turning to techs, you'll note that RSI holds the 30 area on the daily, and 50 area on the weekly, when we are in a bull market. those areas break by much more than a spike and reverse when we are not. So, watching that area. If we break 30 and continue, without reversing, I see a warning that $4300 will ultimately break. Of course price is king, and technicals are a byproduct. but nonetheless, it would express a change in momentum.