Regarding XXXBTC and XXXUSD Charts
I received a PM with a question, paraphrased, 'I trade in Bitcoin not dollars, can you provide XXXBTC charts? This comes up now and then and now that we have 'pinned posts' I wanted to address this in a thorough fashion.
First, I will provide any XXXBTC chart, for which I can provide data. The issue is the reliability of that analysis, which I'll discuss below, but also I have gappy data feeds for coins I don't open much. This is because Cryptocompare throttles the API hits, and so I get gaps less than 1D. That's a problem. However, when the bull market gets going, I'll likely swallow the $85/mo to get the Coinigy feed and see how that goes. there is really no point in it during a bull market. For one, alt exposure in my opinion should be low in a bear market. Hands down, for the most part, alts outperform bitcoin to the upside in a bitcoin bull cycle and outperform to the downside in a bear cycle. They are just generally higher beta. So, one should not load up on alts until we get going, in my view.
Also, most of us have to make alt trades in BTC, so I'm no different. I have just chosen due to reasons expressed below to base my decisions on USD charts, and manually press 'buy' or 'sell' base don't the USD chart, and then separately trade in and out of BTC based on the BTC/USD chart. This isn't convenient, but my analysis for this trading is slightly more reliable.
Now, to the character of XXXBTC charts. They are by and large, with few exceptions, like EOSBTC, STEEMBTC, and a few others 'ABC' or oscillating charts. And some show signs of both. The issue with an ABC chart is the long term will fail often. After an ABC rally, that likely occurred during one of Bitcon's bull cycle, you just don't know what you're going to get. Do you get a B wave down? Do you have 1 up of a large diagonal, and then a 2 down. Do you have a big impulsive move that erases all of the preceeding ABC rally? I have seen those scenarios in these charts and more. That means one cannot reliably do EW analysis with any 'predictive' weight off an ABC chart. Mike G tends to be the ninja master of such charts, as the analyst for Forex, and VXX. But I am not he, and he also has to adjust a lot. That is par for the course.
What I do suggest if you want this analysis:
1) Ask. I'm happy to give. I just don't do as a default. I have surveyed members, and most want USD charts. But they are interesting, and I'm happy to do them.
2) Understand their limitations. Some are impulsive. Some might be impulsive. Some are unreliable. And, everything in a spectrum.
3) Keep focused on the BTCUSD chart. Don't load up on those alts regardless when BTC is in a downtrend. Yes, we get some alts that run first, but honestly, you can detect that in the XXXUSD chart.
4) if the XXXBTC chart is an ABC chart and you want to trade it like an EW master, wait for the 1-2 of C. That is the only proportion of the chart that is going to resemble an impulse for a short time.
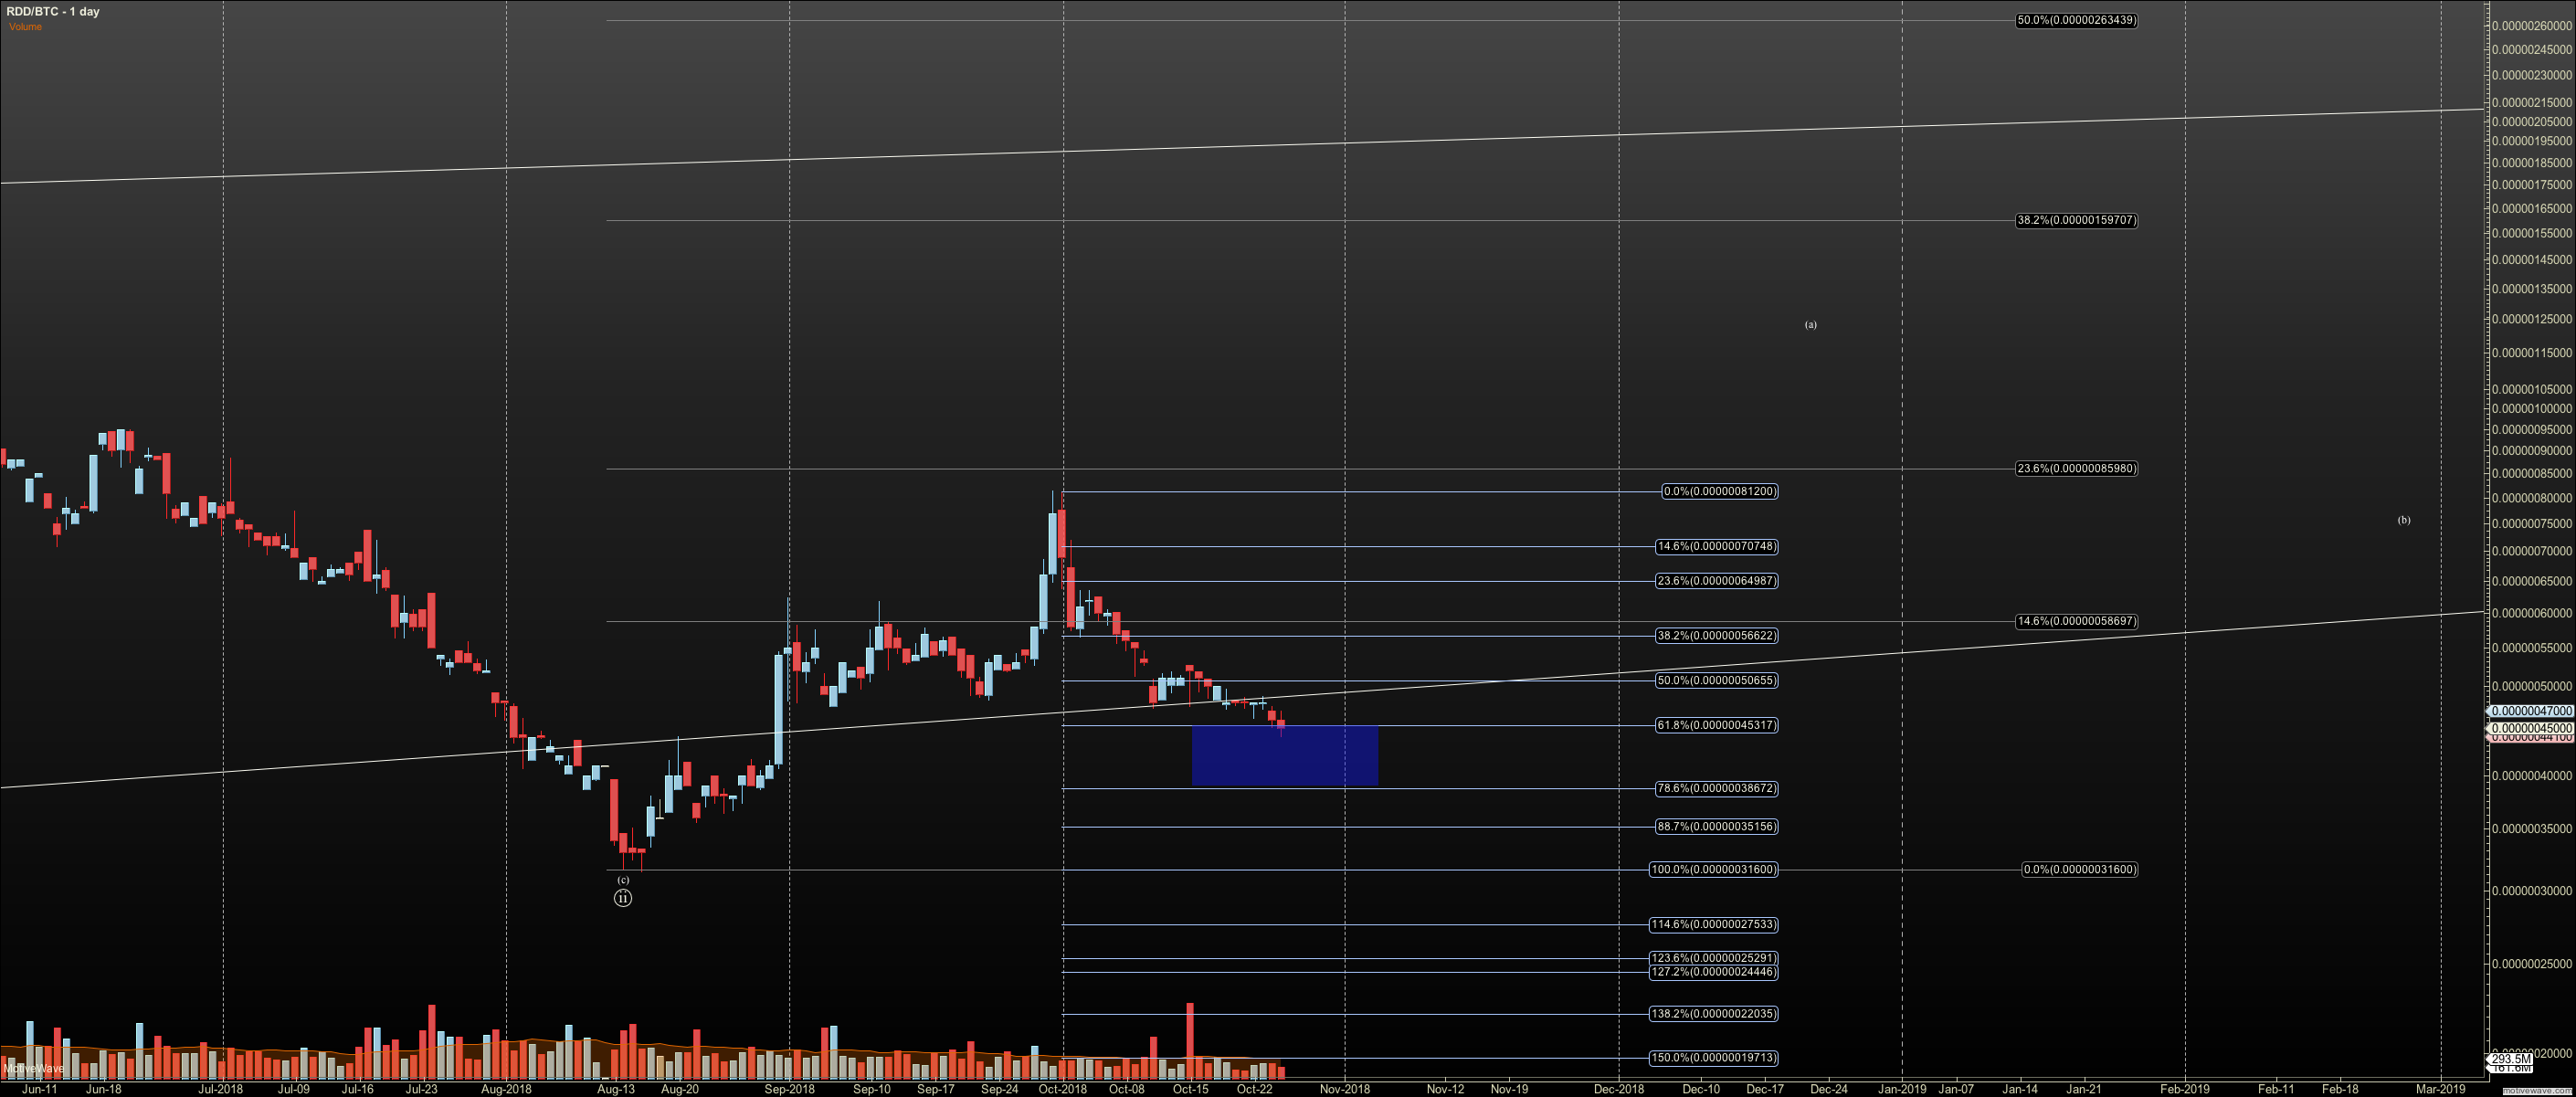
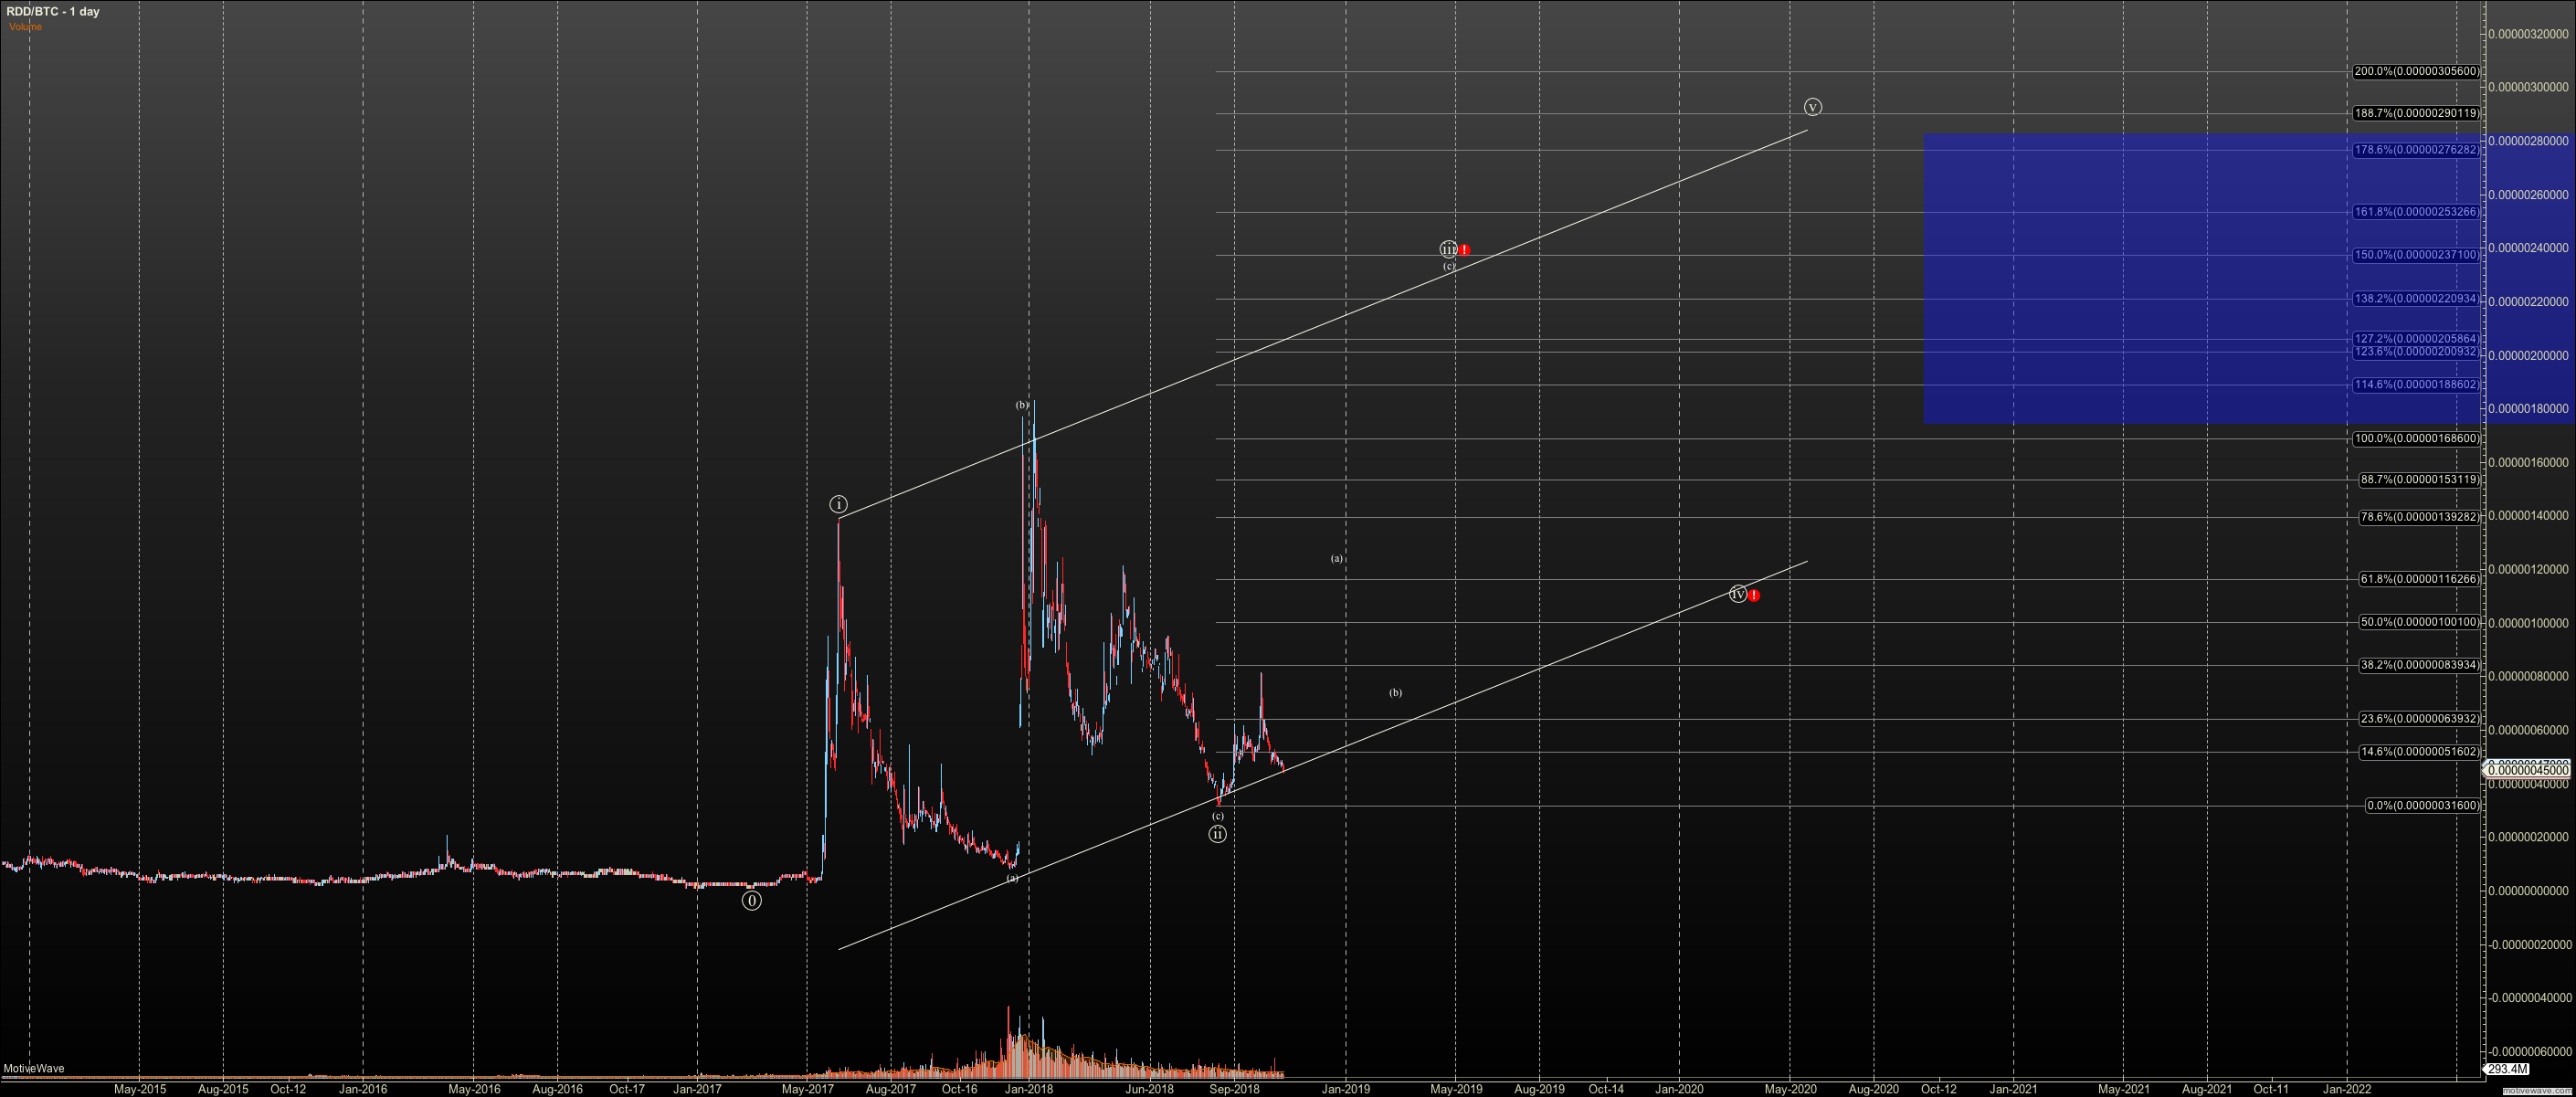
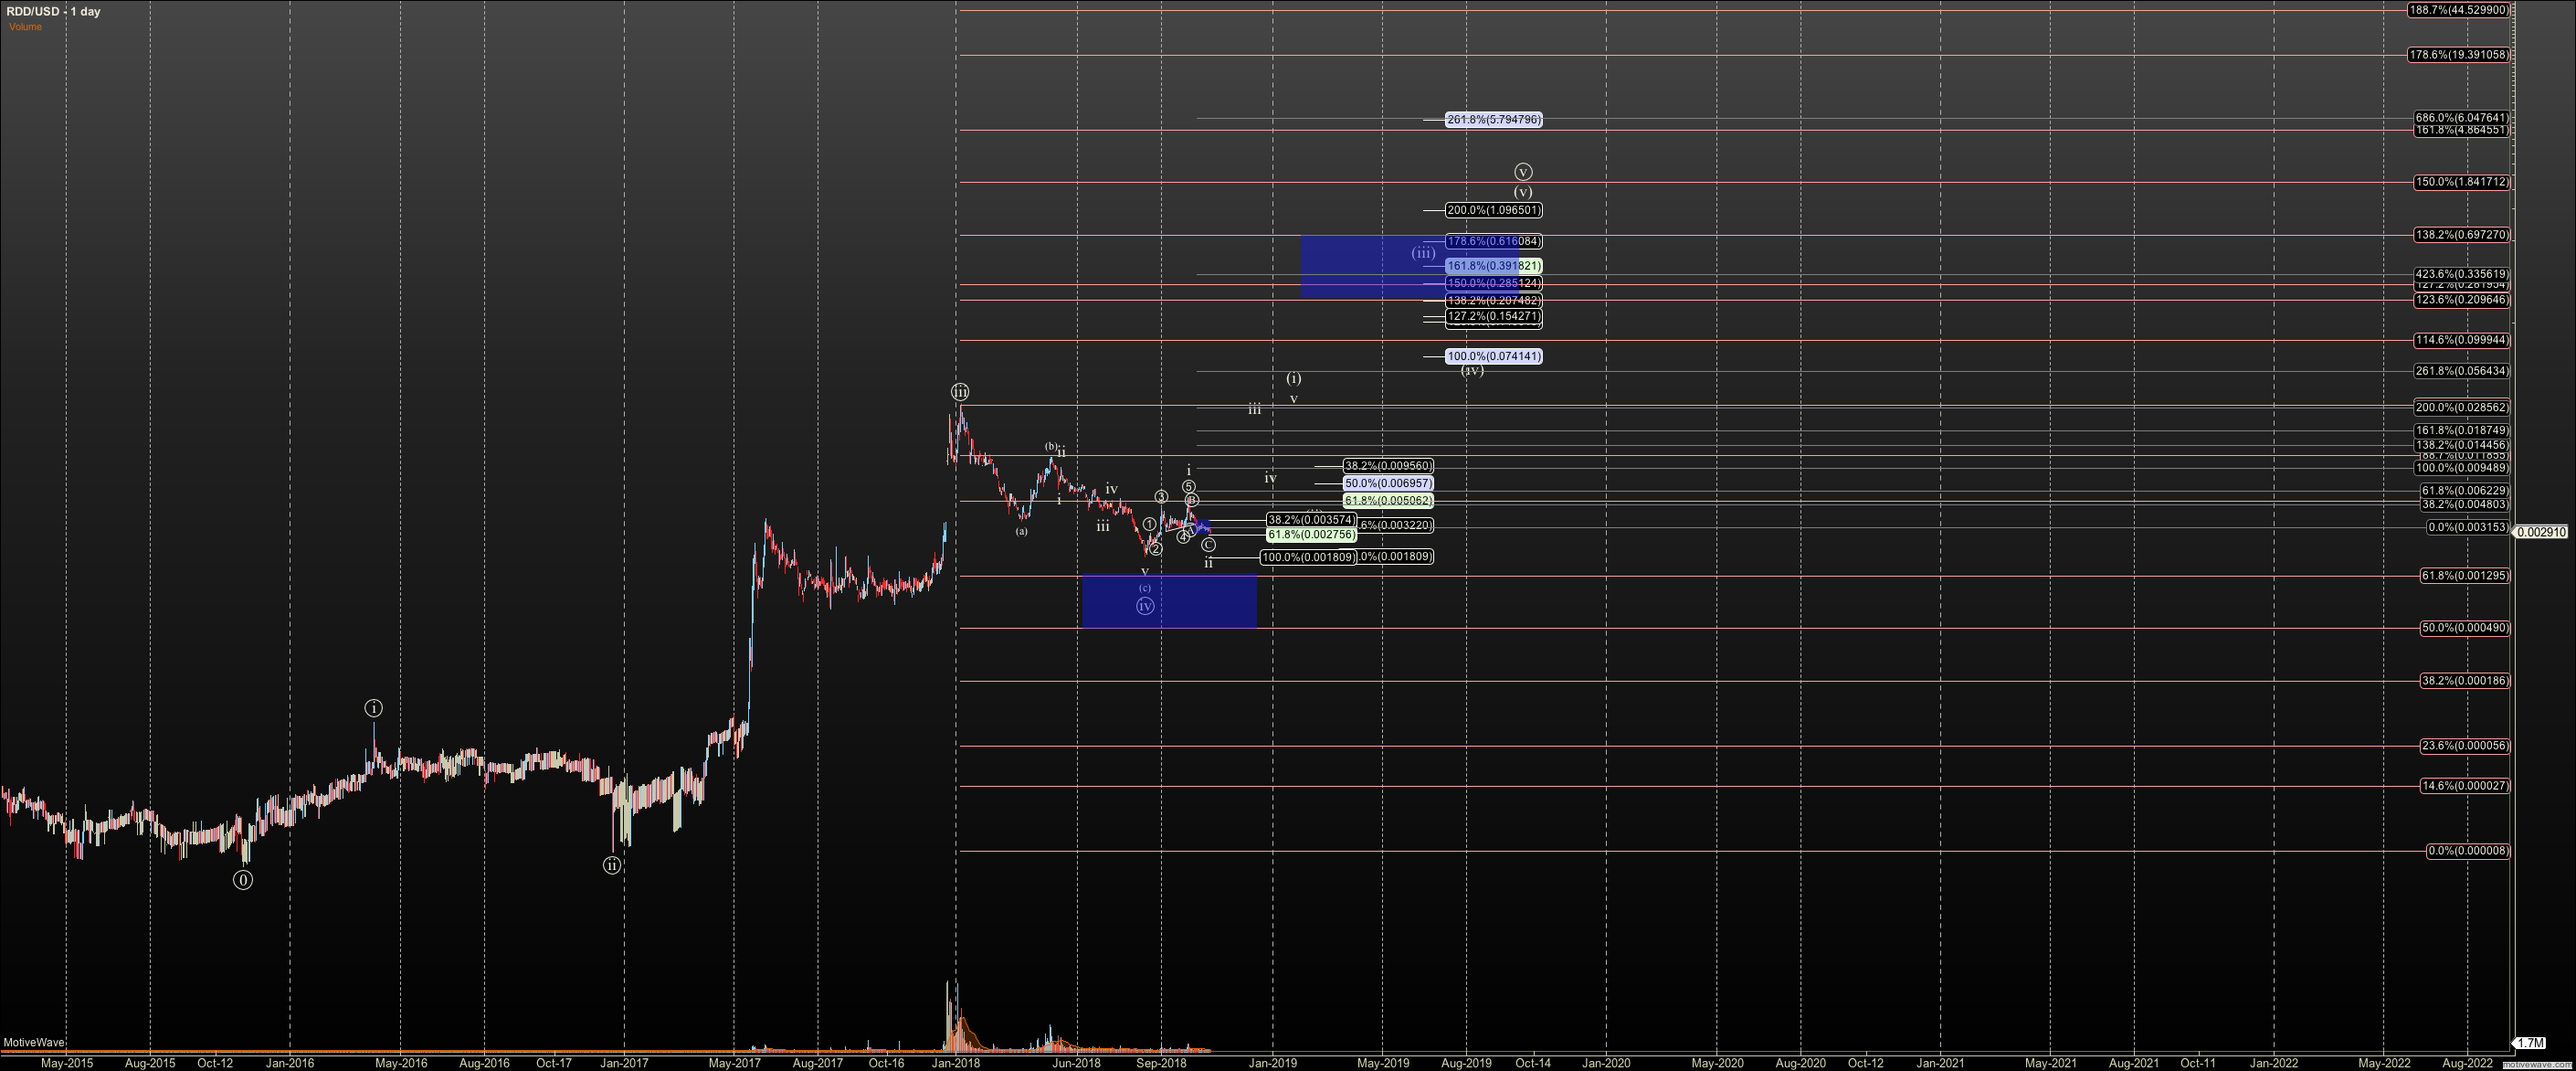
I have two 'exhibits' to help with this question. RDDUSD, and RDDBTC.
RDDUSD is a very nice impulse. And, as you see it is interacting / hovering over long term support right now. Will it break? I don't know but so far so good. We are close to a buy zone. RDDBTC on the other hand is a real mess. It oscillates wildly. Obviously during bull cycles, you did much better, by far, in RDD. However, the count itself is 'sort of a diagonal' but it is nothing close to the type of diagonal we often see in equities, or XXXUSD crypto charts. In fact, is a very new animal to me. I'm feeling it out. I do believe that there will be several scenarios for this chart before it complete.
However if we drill into the zoomed in view, we have a vague 5 wave move, that may be another diagonal, and I've marked support for where that should hold. So, this chart can be useful locally to test for a bottom in this chart. Below .00000386, we may see new local lows.
I hope that makes sense. Let me know if questions.


