Regarding Lunatic Moon Counts and Appropriate Planning
 By
Ryan Wilday
By
Ryan Wilday
In the Beginning..
In early 2016 I was beginning to see real consistency in my own profitability with the Fibonacci Pinball method mostly in equity and equity option trading. I was also starting to get serious about trading cryptos actively. I had been a miner of bitcoin and litecoin for many years before then, but occasionally making a trade. But now I was serious about both the asset class, and putting Elliott Wave to the test on this new vehicle. The results were astonishing. I posted over a 300% return in Ethereum trading within a few short months. But there was one problem.
At the time I was using the linear fibonacci tool provided in tradingview. That was the only option. What I was seeing was suble variation from targets and results in actual trading, as Ethereum climbed from $4 where I entered roughly, and $21.5, the ultimate top in the wave 1.
I remember quite clearly that I missed the topping signal by a bit due to linear fibs. That said, I had become skilled enough to read that the trend had changed and I took my money and ran. But I continued to watch.
The Magic of Log Fibs
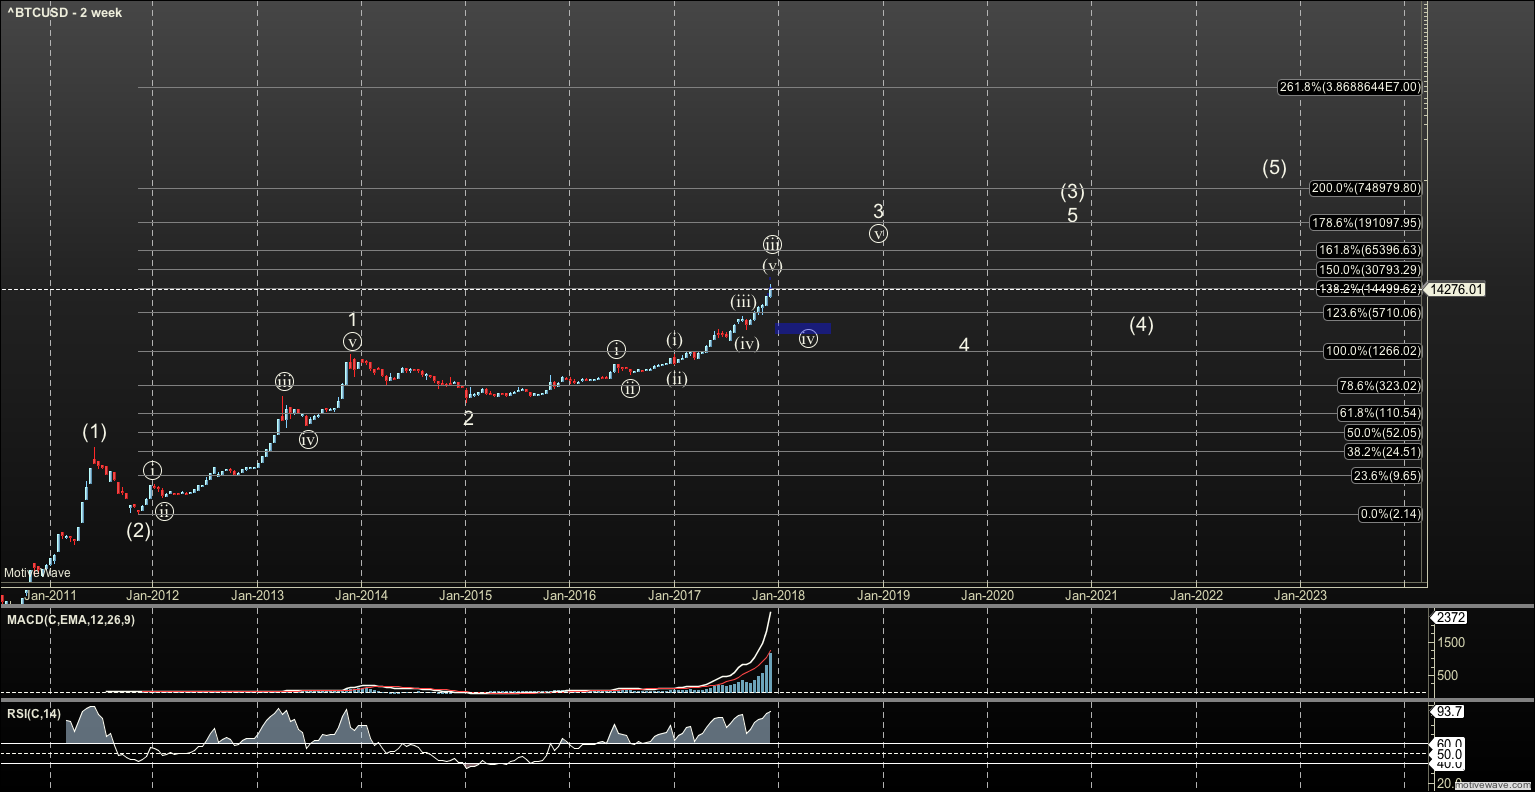
At some point user Royprasad made a beautiful post in the main room about log fibs. Thinking that may have been the issue I scrambled to find the calculations for log fibs so I could apply them to the crypto market. The results were astonishing. To just name a few key findings, I saw targets for the 1.618 in Ether at $3500+ after a new wave 2 bottom was confirmed, and $64,000 for the 1.618 in bitcoin (depending on the data set you use).
I could not put the level of emotion to words when I saw this. I double checked my work, and doubled checked the calculations with those more ‘math-smart’ than I. Over and over the results checked out. I knew in my heart of hearts that I had hit pay dirt.
You see, the brilliant fibonacci pinball method created and tested by Avi, reveals targets for future waves from the turning points in waves 1 and 2. But if you are working in linear fibs you are using absolute price change, not percent return. This means that cryptos which move wild in percent return terms, will offer wide variance in targets between log and linear. That $3500 in Ether is roughly $39 in linear. And obviously $3500 is proving more correct than $39, since we have yet to prove a top in a major third wave.
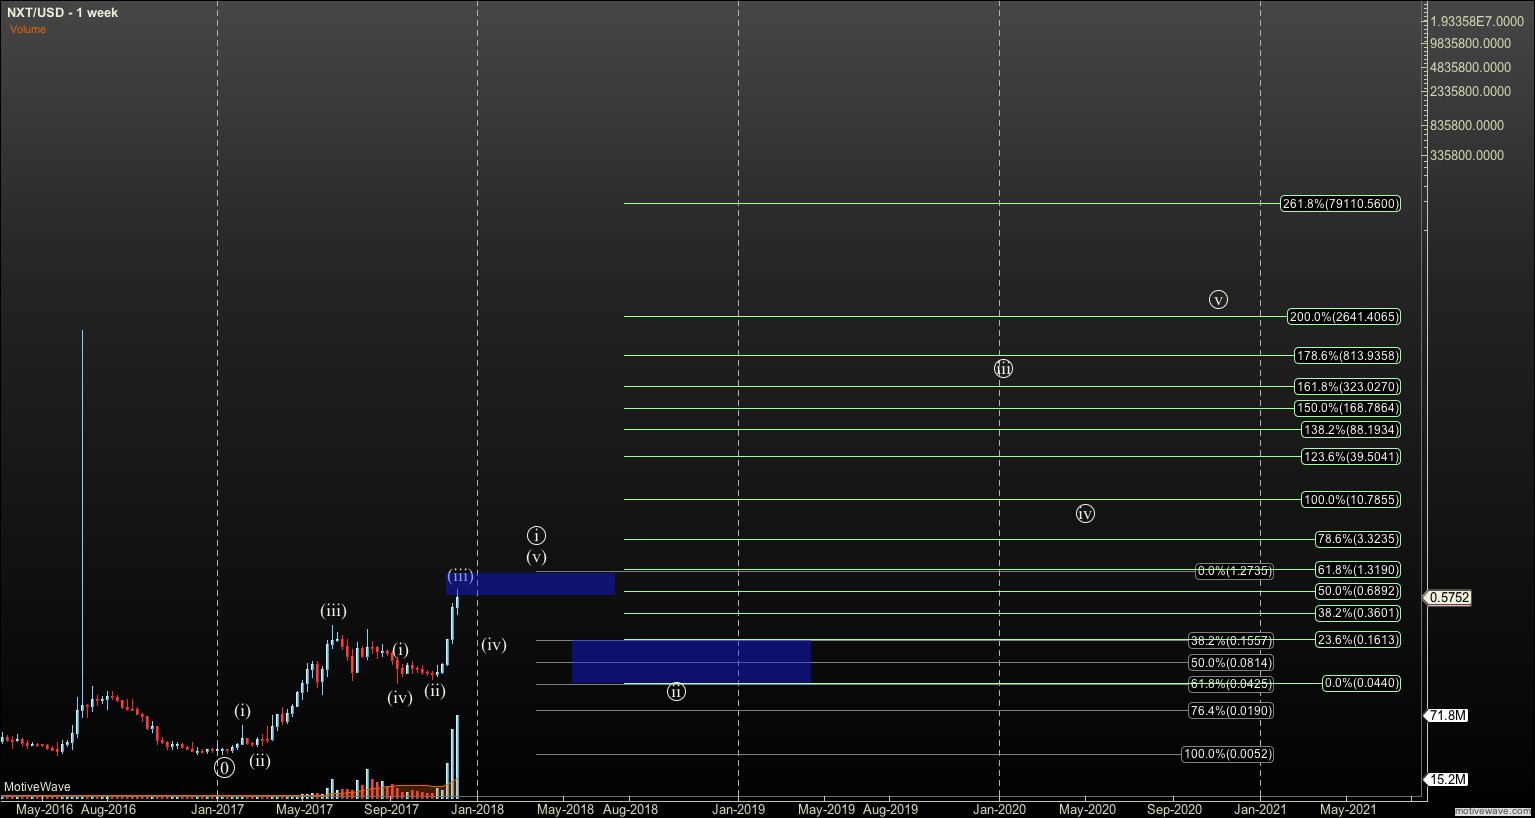
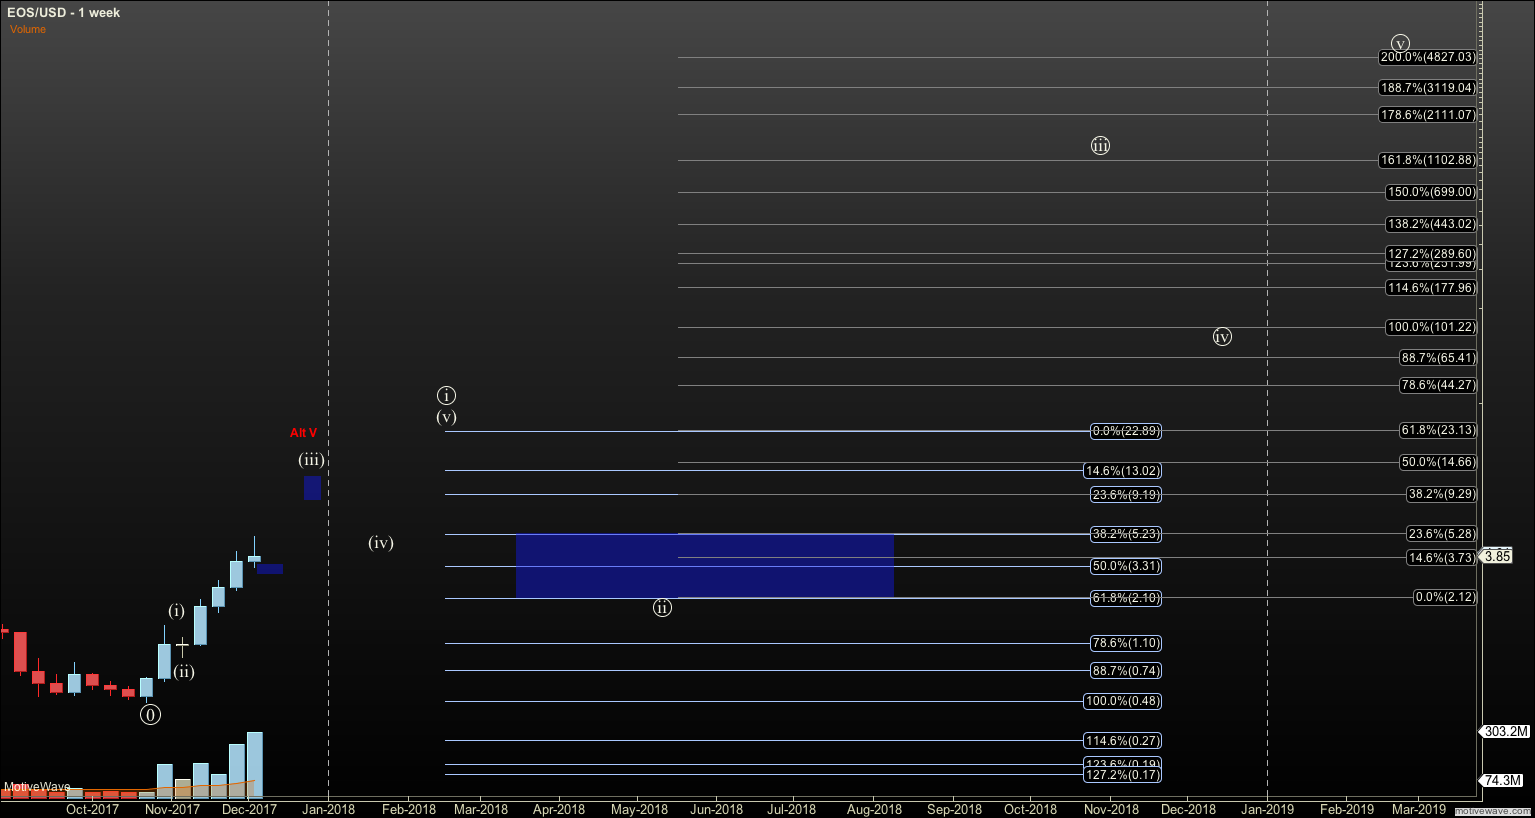
Now you know where my ‘moon counts’ on the daily are coming from. They are all based on wave 1 and 2’s that are so wildly unique in return among the universe of tradeable assets.
A Valid Method But a Caveat
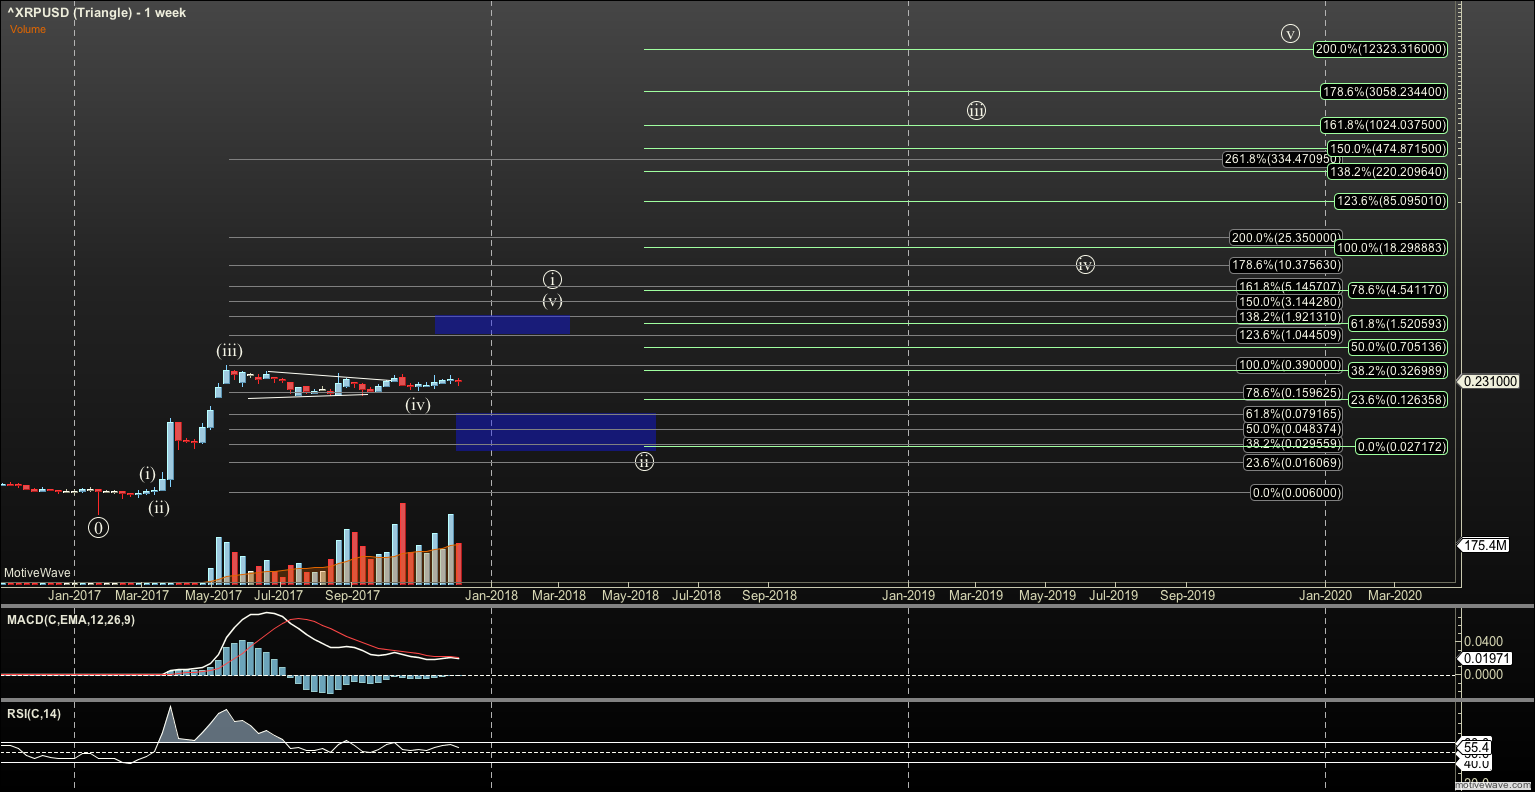
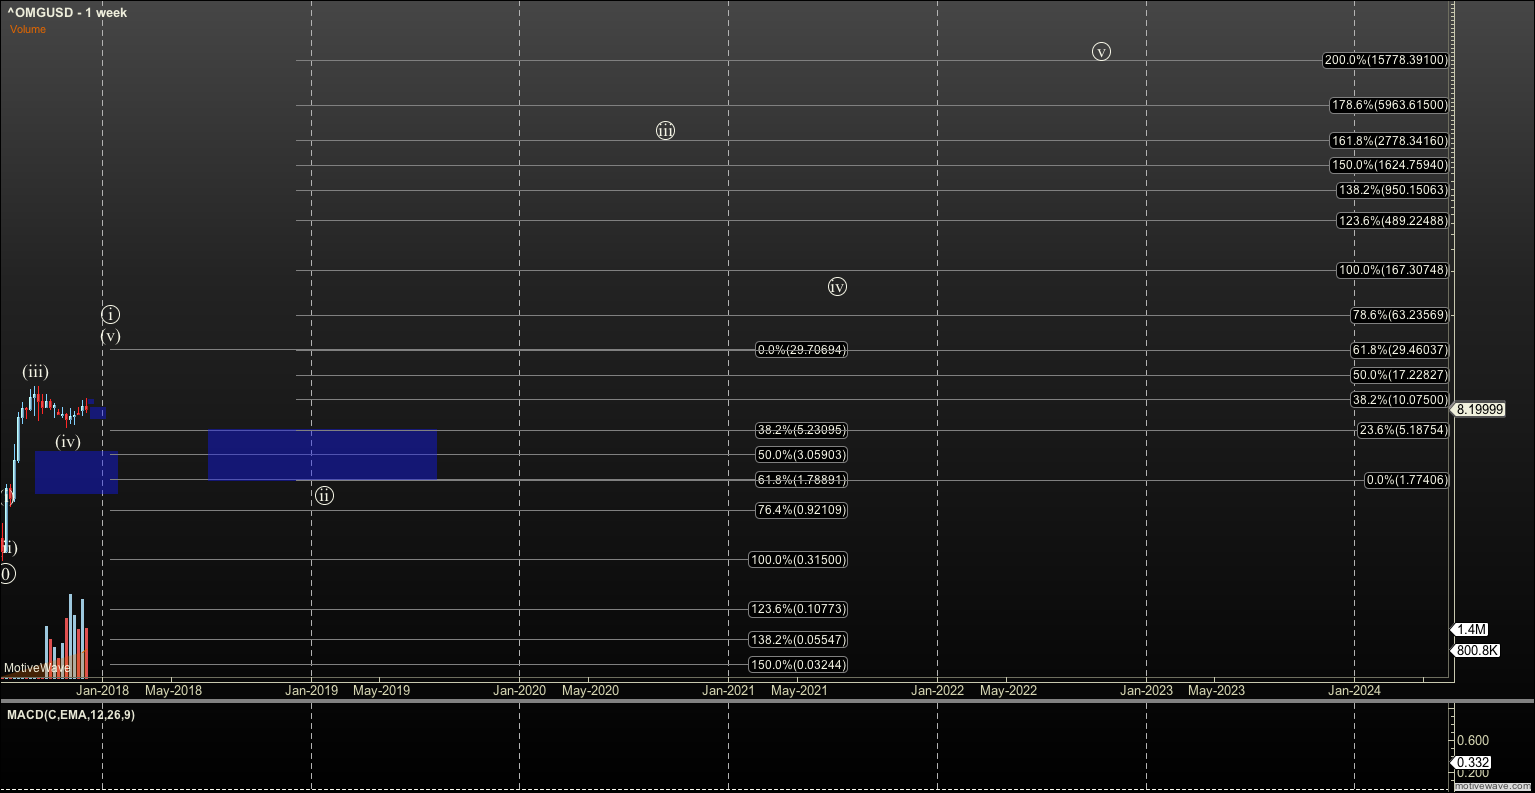
I have taken a lot of heat, and fought some battles on the board for moon counts that have failed, mostly XXXBTC counts. While many moon counts in XXXUSD have continued to prove out: Bitcoin, Ether, Litecoin, Ripple, and Stratis are just a short list.
However, I want to remind that these, and even the short list above, are new assets with little price history. Some of the counts on the site such as bonds, gold, and the S+P are based on decades of repeatable history and multiple nested five wave structures. Even the venerable Elliott wrote about these assets and our faithful analysts are just continuing his work. Not so with cryptos.
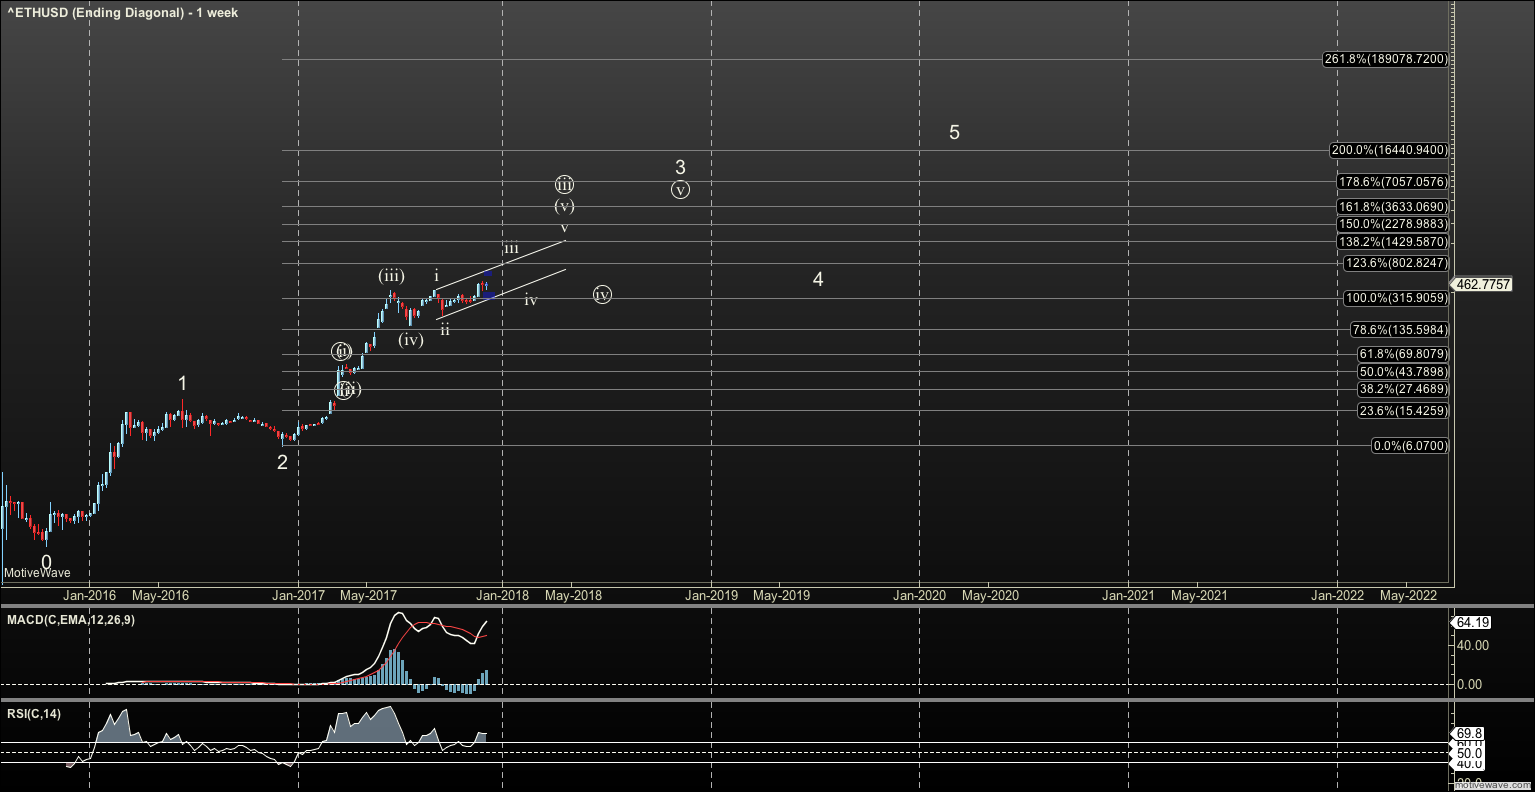
This means that I have to stay on guard for any of these moon counts to take a bad turn. There are many plausible ways this can happen. For example, Ether is coming up on the 1.382 at $1429 roughly. Perhaps it tops there, and proves that this move as an A-B-C off its release date. That could mean it goes to $0. Or, it may mean it forms a large diagonal over a decade or so. We don’t know. When it does hit this level, if it does it must hold roughly $310 until a full five completes. If it doesn’t, we have our first sign that our lunar launch vehicle won’t make it.
But this doesn’t mean that my moon counts should not be posted or be my primary view. Quite the opposite. You see, the standard impulsive structure as defined by Elliott is the central backbone of any asset’s price movement. It is not just a target placed out in space to trade for. It is a litmus test against which we test the qualitative and quantitative aspects of price, so we understand the nature of what we are trading.
Quantitatively speaking, whether we want to believe in a moon count or not, the standard impulses gives us a ‘stair-step’ of key price levels to measure against. I will place no other structure on a chart until something else shows. Of course, that means bearish or alternate counts are useful, but only when a reason for a such a count shows. The same goes for bullish alternates and ‘blow-offs’ I wouldn’t know if an alt is possible, if I’m not measuring against the structure of the standard impulse.
So, I ask that you at least understand the reason for these posts and neither expect them to happen, nor call me nuts. Whether they happen or not exactly as foretold or not, they are the key to profitable trading.
Making it Practical and Profitable
How do we make this all tradeable? That’s the important question. I worry some of you will take a moon count, cancel your subscription, and hold out for target somewhere out in the future. Trust me, that is dangerous, unless a ‘lotto’ trade in an amount you really don’t care about. When I place a moon count it is not a promise we will hit it. That should now be obvious.
The way I trade this is mostly using the hourly counts, which are subwave structures within these moon counts. I have honestly turned a lotto size purchase of cryptos in 2016 into a very sizeable nest egg and regular income. And, I am not willing to lose all that trying to hold out for $3500 Ether, $300+ Litecoin, $48+ Stratis, and $764K Bitcoin (the 2.0 extension). That is dangerous.
That said, I do ‘skim’ a little of my profits off and tuck it away in a hardware wallet and other locations for that crazy day to come, if it does.
I also trade multiple time frames on daily scales. For example, I increased my core Ether holdings in the low $100’s in July when we had a possible wave 4 bottom (which is now basically 100% confirmed), and I’ve lately lowered that core a bit to trade small caps at these levels. That core may see further reduction in $800's soon. But it will not go away as long as $100 holds. And, once we hit $1429, $310 must hold as mentioned. I ride an ebb and a flow of entries and exits on multiple time frames.
How you decide to trade these price structures is up to you. It takes time to learn and find a style. Elliott Wave targets do not at all displace the need for hard work and planning. But it gives an edge to those that learn to apply it. With respect to cryptos I feel like I’m at such a giant advantage to the crowd of people coming in blindly.
I have a plan although it always evolves. I know who I am but I am always changing. I have a great tool and I’m always learning to use it better.
Some fun moon counts to be attached soon...