Price Action 'Analysis' - Market Analysis for Oct 29th, 2018
 By
Ryan Wilday
By
Ryan Wilday
While the market is slow (for now ![]() ), I wanted to do a quick educational post on how I look at price action. This term 'price action' means to me, in essence, that you are analyzing how price is moving. I am not sure how others think about that term. I don't come to this life as a professional trader, so beyond Elliott Wave or option trading, where I have done the most study, I might mince terms. By the phrase 'how price is moving' I do not mean candlestick analysis, (dogi's, hammer's and the like). I don't mean indicators. I don't even mean EW. What I am looking for is where is price taking off, and tightening up. By tightening up, I mean where price is moving strong with little retraces. In cryptos. we get a lot of wicked extensions where price moves suddenly with no retraces. In these extensions price trends hard, and doesn't retrace much. Last night was a great example.
), I wanted to do a quick educational post on how I look at price action. This term 'price action' means to me, in essence, that you are analyzing how price is moving. I am not sure how others think about that term. I don't come to this life as a professional trader, so beyond Elliott Wave or option trading, where I have done the most study, I might mince terms. By the phrase 'how price is moving' I do not mean candlestick analysis, (dogi's, hammer's and the like). I don't mean indicators. I don't even mean EW. What I am looking for is where is price taking off, and tightening up. By tightening up, I mean where price is moving strong with little retraces. In cryptos. we get a lot of wicked extensions where price moves suddenly with no retraces. In these extensions price trends hard, and doesn't retrace much. Last night was a great example.
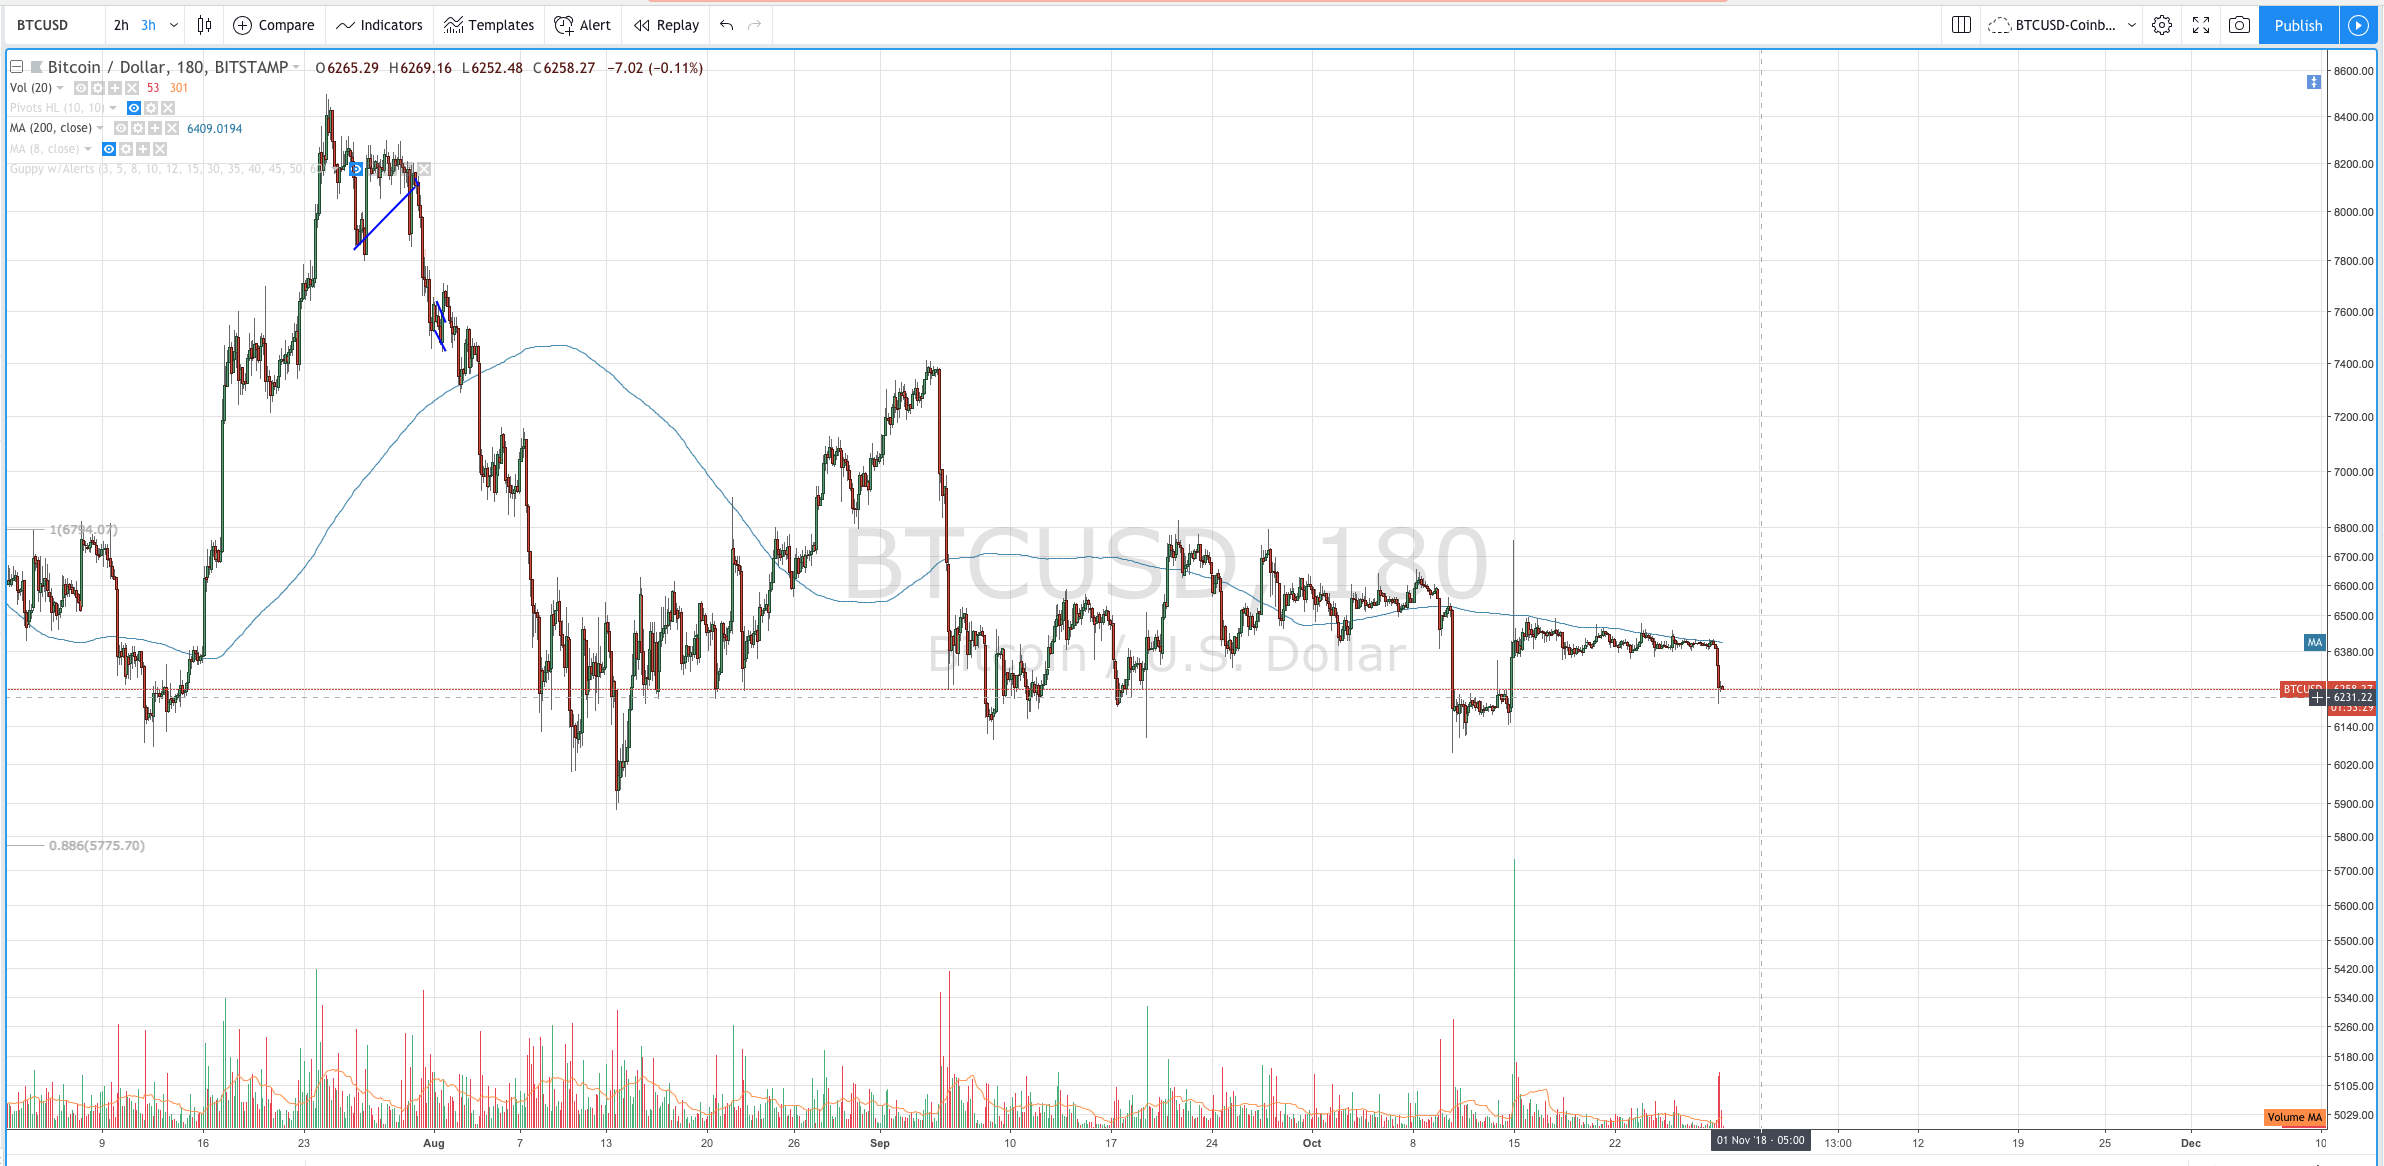
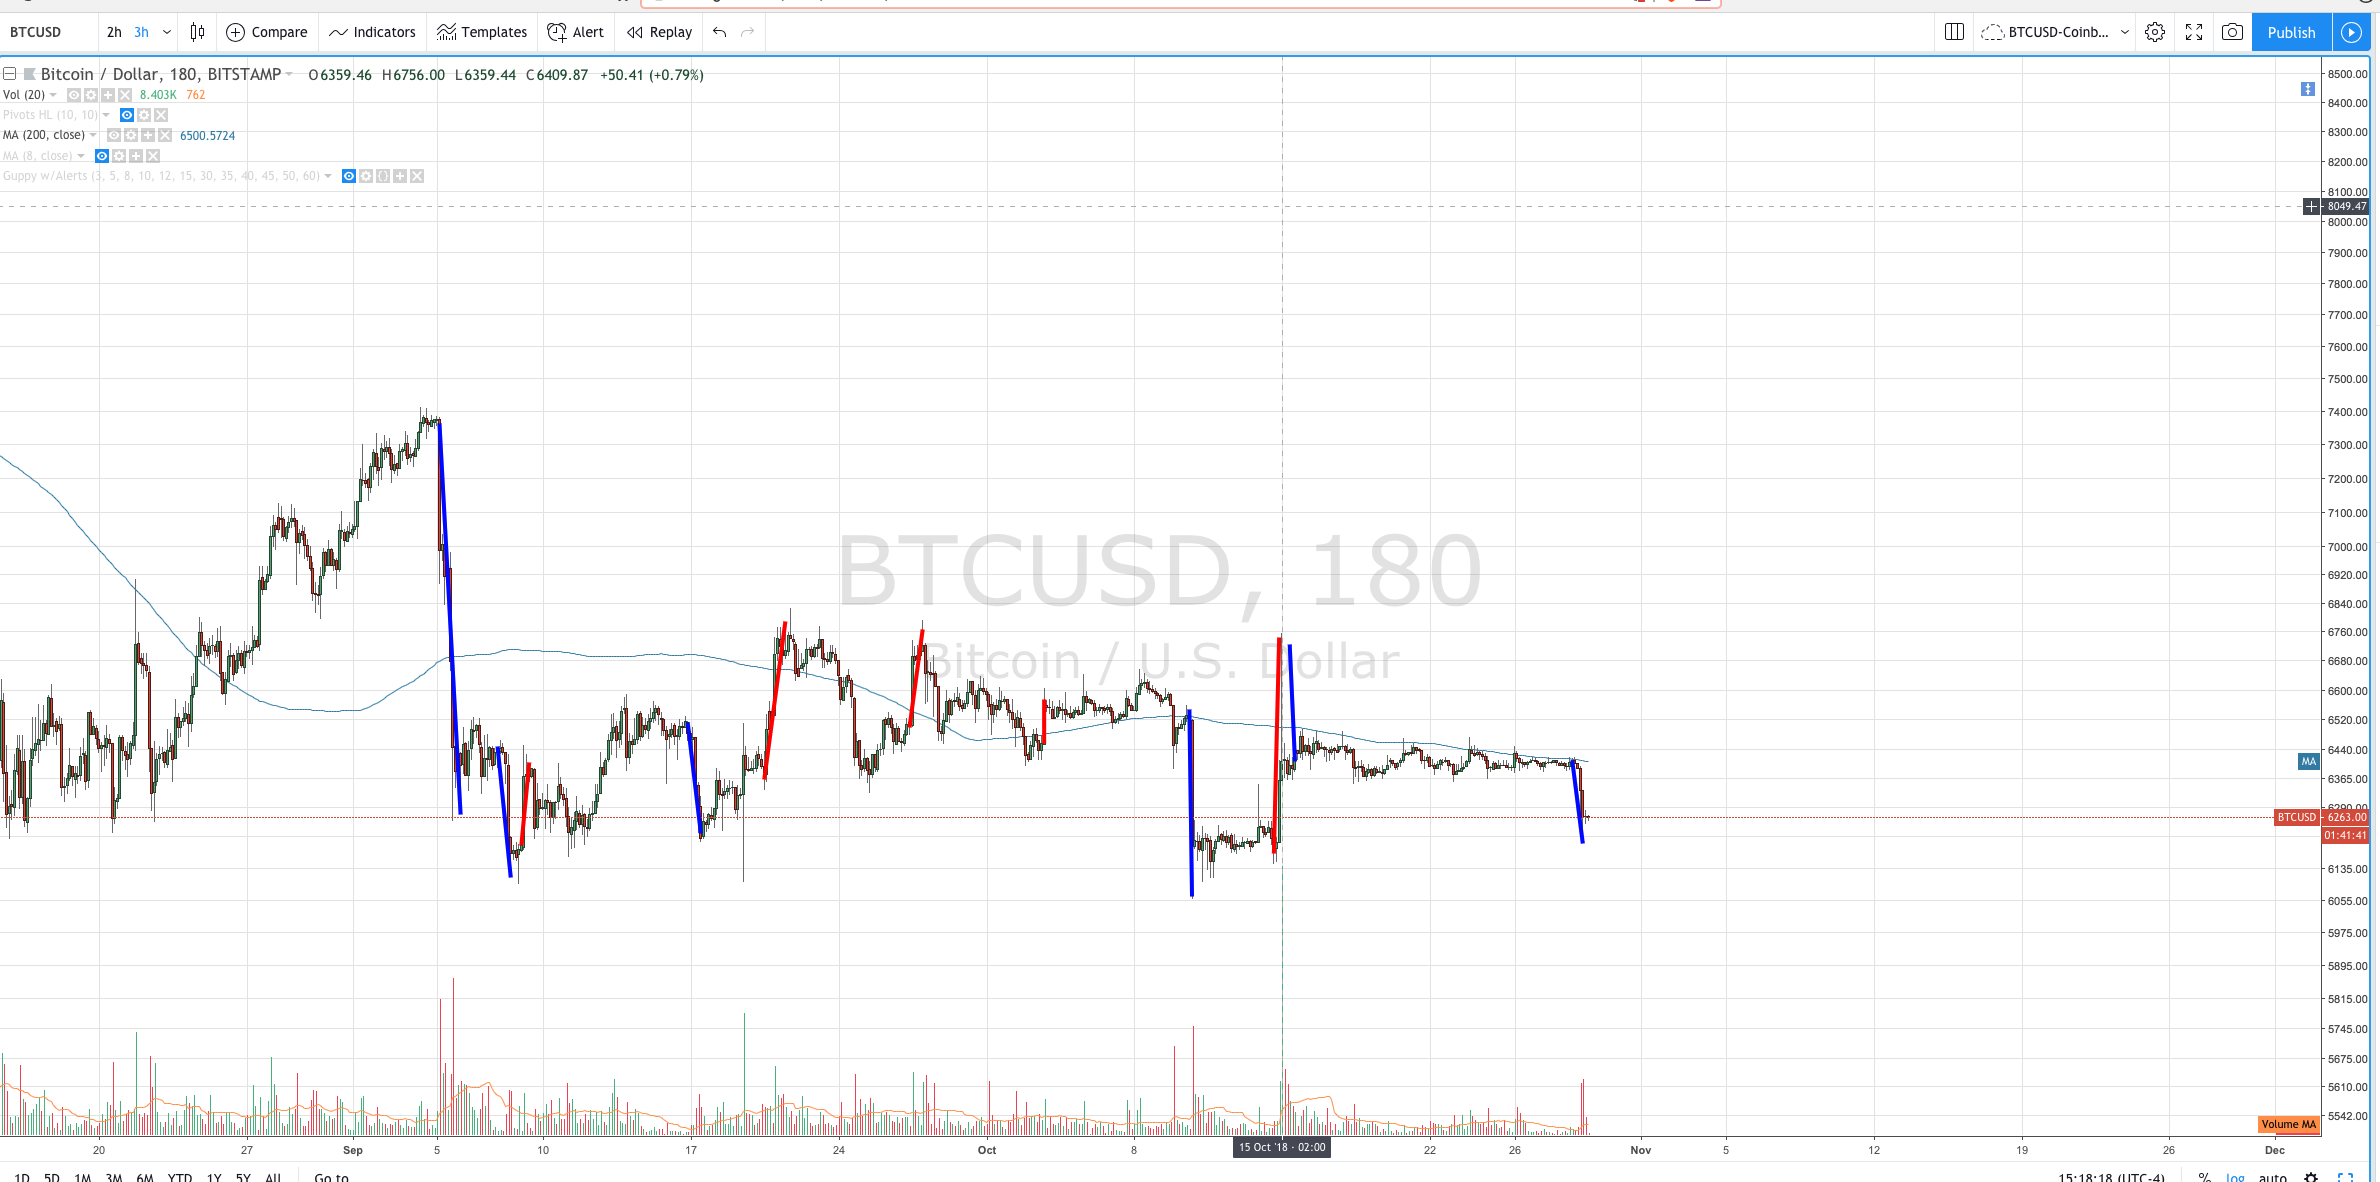
See the two charts. Since the September top, the biggest 'tightening' of price has been down. (blue lines) I see three upward thrusts where this occured. Notice that the large one came off the Sept top and we've had several. In general this is a point where downside selling overwhelmed the book. Either the selling was huge, or the bid side was just thin. I don't know. But sellers won. Usually when the start point of that move is taken out, it results in a launch, if the market has any power. That is because there are some stops at those levels. Hell some of mine are there. Once those stops are squeezed, we either get real buying or not. Each time, the upward thrusts (red) took out the preceeding thurst down, did we get much more than a little squeeze? Not at all. Then new thrusts down, started up, and we have another last night. For me this has nothing to with targets, though I do use them for stop when I'm not clear of the count.
Likewise note where the blue lines end on the downside, there are bids that sent price up. That means there will also be stops there. Watch how price reacts there. The next one is at $6055 Bitstamp. Watch that level. We may see some acceleration. And, how far that acceleration goes, will tell us a lot.
I've posted the chart with and withou thes blue and red lines mentioned.
Where EW plays into this for me, is this analysis is qualitative, and doesn't give me a place to take targets. EW tells me how far price should go, and where I should take some off. I also prefer EW stops over this method, but I will use this when I'm in a position and the chart is overlapping and I'm losing context.
You don't need special skills, indicators, to form a POV on a chart this way.