MACD Thoughts - Market Analysis for Oct 10th, 2018
 By
Ryan Wilday
By
Ryan Wilday
Slow day and after last night, where I called for a $100 drop on BTC based on the MACD,I thought I'd do a simple post on the MACD.
First, rule #1 in using the MACD is you must not use the crosses as direct buy and sell signals, even the 0 line. I have programmed an algo to use it and back tested it on a few assets over multiple timeframes, and it will lose you money in a slow bleed. To me this is improper use of the MACD, and I have done some level of statistical work to prove it.
Divergence
The main use of MACD you'll find on this site is watching divergence, and this works well. If you are not familar with MACD divergence, this is when price is trending one way, and MACD is trending the other way. We watch for positive divergence (MACD up while price is up) in our fib areas for a a buy signal. Buys are a little more reliable than negative divergence at tops but the latter works often. In looking to make my buys very precise, I like to look for what I call to myself 'divergence neck down'. That is that divergence shows on progressively lower timeframes. For example, if I'm looking for a swing buy signal I want to see 2H divergence. Check!. Then I look for 15m. Check!. Then I look for 1m. Check!. You don't have to use all those timeframes, but this sequence works for me to pinpoint the turn. And, sometimes my buys end up near bottom tick levels.
Scalping corrections
When you have very sloppy wave patterns as we do now, I use a very basic trend system in the MACD. If I'm seeing two crosses up where the second one is higher, that's a bullish trend and can be worth a buy scalp and vice versa in a downtrend. The mathematical characteristics of MACD make this more useful in corrective waves. Sometimes we'll see MACD do this in the middle of a third wave and that is not a reliable signal due to 'embedding' where MACD becomes hyper sensitive to slight changes in momentum. Third waves is where I ignore MACD completely.
What's key though about this is MACD doesn't give targets in my view, EW does. So, It helps to know where the trade can terminate EW wise. Also, I highly suggest using a min of two timeframes. For example a 5m MACD trend, is going to be better to buy if it has 1H in MACD an upturn, with no risk of rolling.
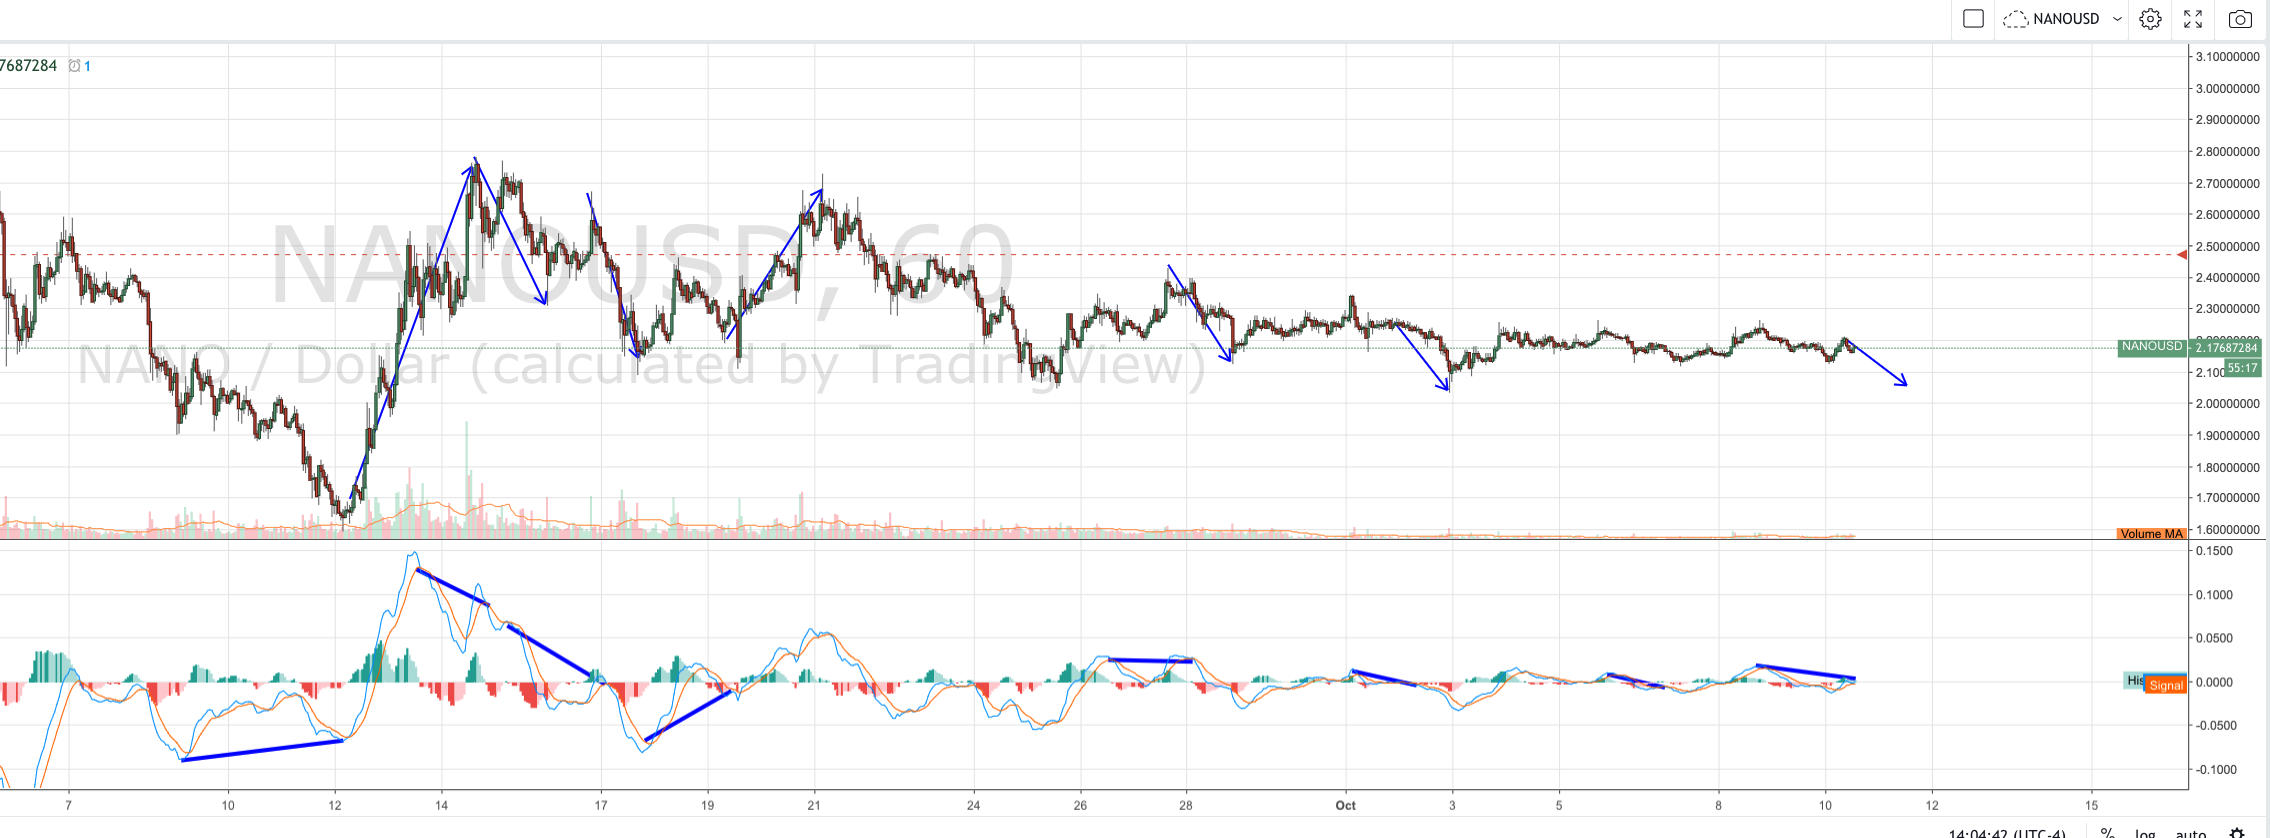
See chart for a mix of 'divergence' and 'MACD trend' signals. Arrows on the chart. show the direction of price after the signal. Line's on the MACD chart show where I was looking for the indication on the MACD. As you can see it calls direction better than magitude, but nevertheless there's direction. Using another timeframe can somewhat help with magnitude, but EW is far more reliable. Also 'compression and pull away' can be used like a cross, where the MACD lines come close together but pull away instead of crossing. The chart is NANO arbitrary chosen because it was in front of me. Note the last signal bar hasn't closed. One should wait until the bar closes to interpret a signal.