Lazy Trading a Fourth
 By
Ryan Wilday
By
Ryan Wilday
It struck me today that during the June correction, I made a couple charts where I talked about the zones of a correction and how I think about positioning in them. I think I called then: Add, Take Profit and Enjoy, or something like that. I don't recall.
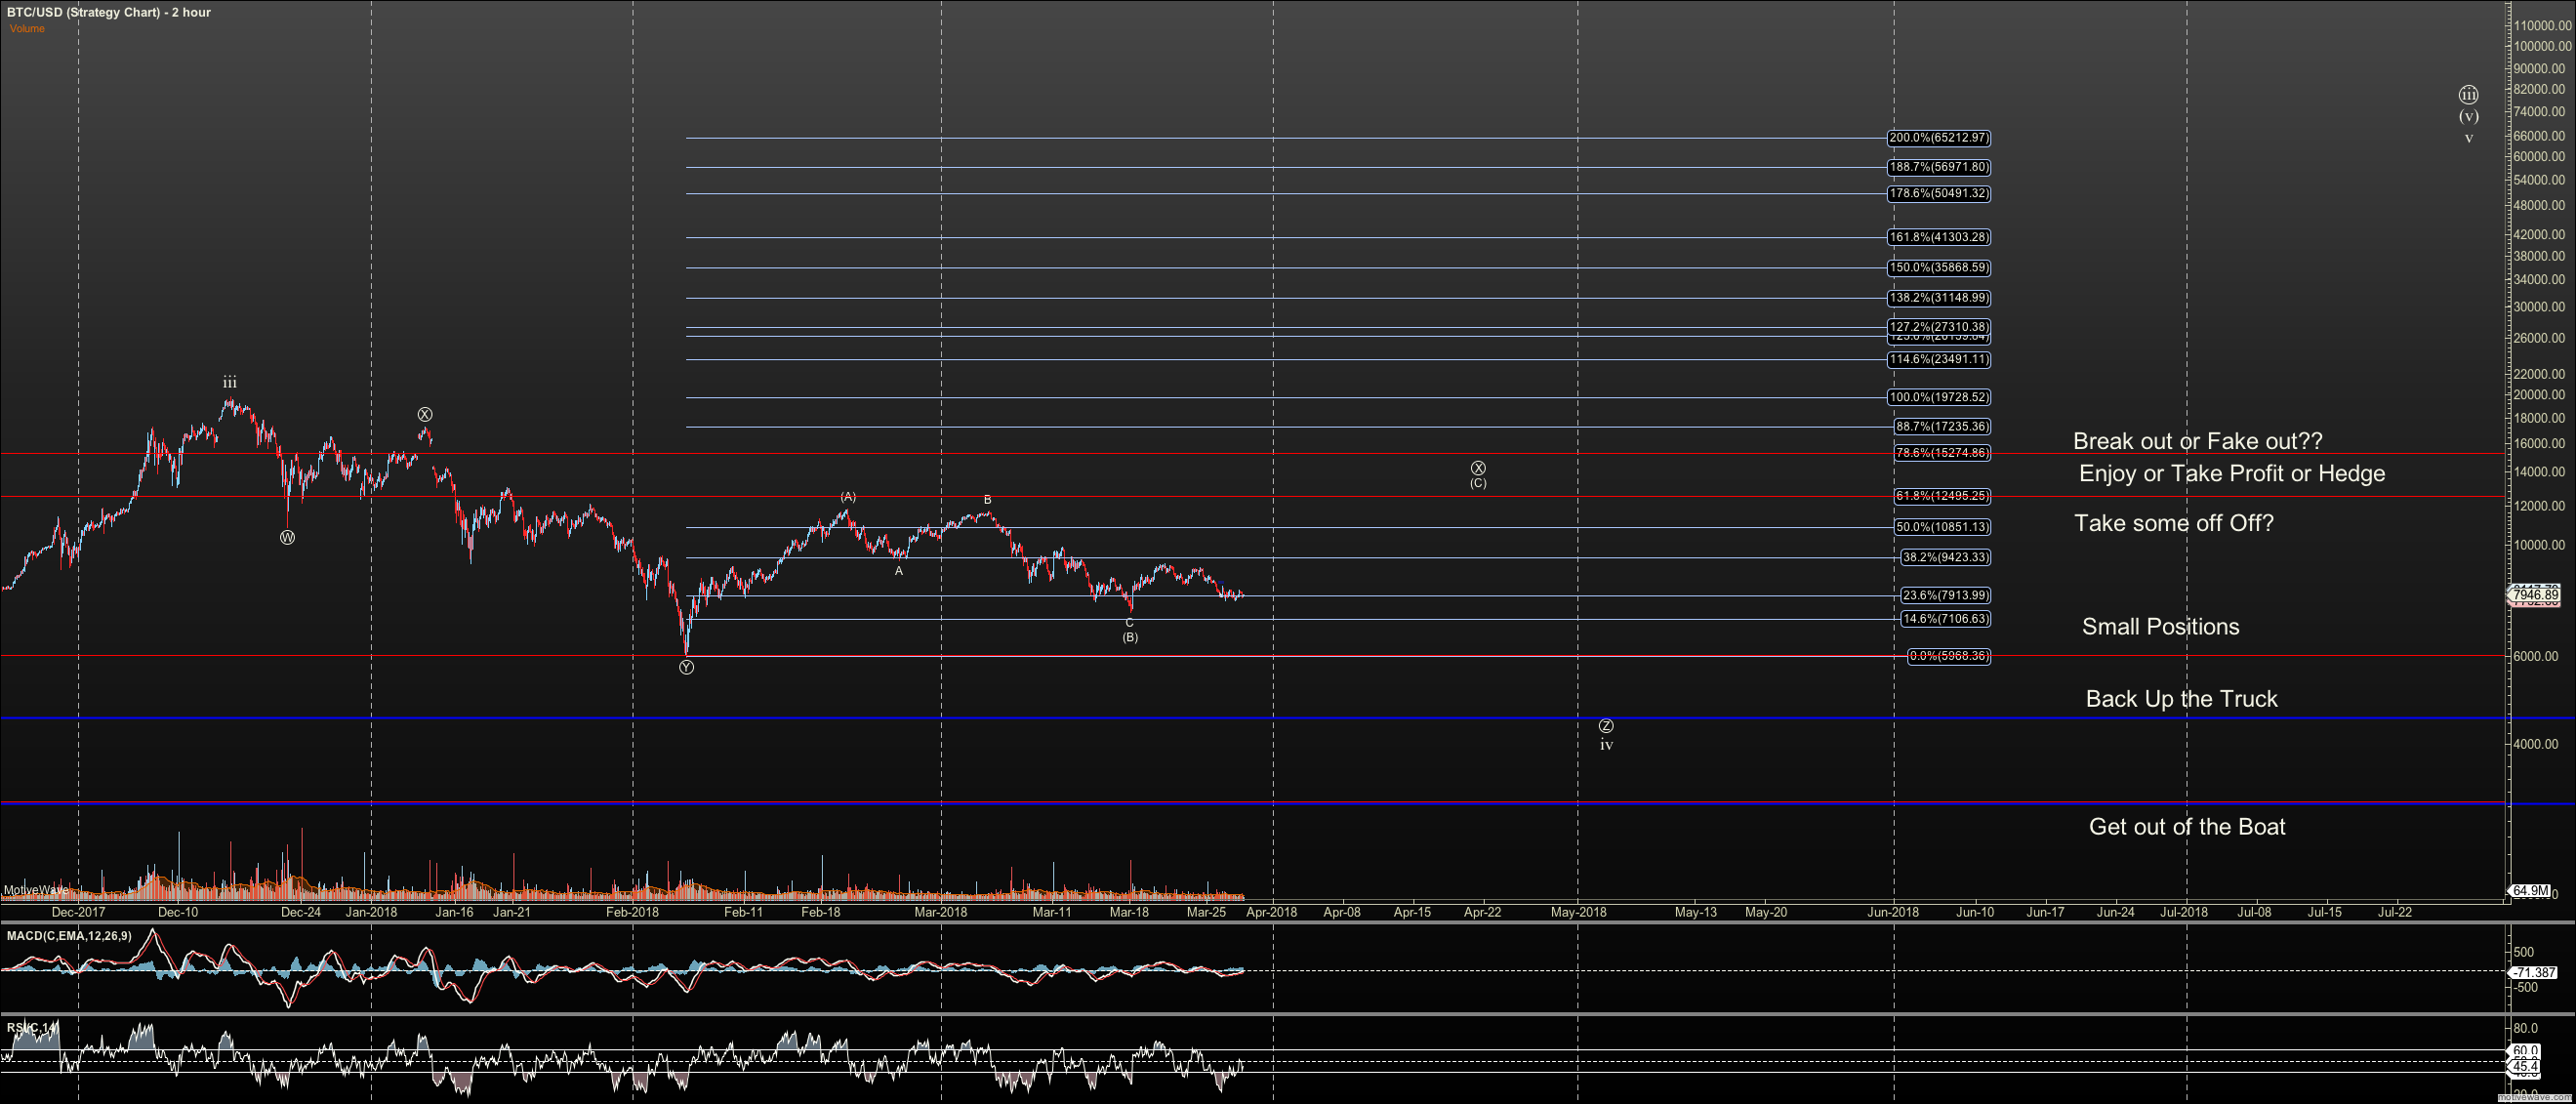
But it looked like the chart attached. The red lines are tied to key fibs based on the depth of the correction. Because BTC is still above long term support a C wave could provide a back up truck zone just above GET OUT of the BOAT zone.
The point of this is we are in the middle range bouncing up and down correctively. It's a mess and makes calling it hard. Lower in the middle zone, you can take a small position, but you might want to take it off quickly if in profit. It may not stay long and the market will have a hard time getting over $12K There is resistance there!!!
If we get over the .618 you might want to hedge, take more off, even short if your brave. If we get over the .786 we have to figure out if we have the understructure of a breakout or a high X/B. You can also enjoy or bask in it, but still note it can be fleeting
Note that Backup the truck is just above Get out of the boat. Again, your biggest position is ideally near the stop. If you are sitting on your biggest position ever RIGHT NOW, you are not doing this right. (tough love).
Above the .786, we have to see if we have the underpinnings of a breakout impulse, or a high B wave. (yuck).
Also, if we get 5 up above $13,000 this chart morphs. It puts backup the truck at .618 retrace of said 5, with the get out of the boat below the .786. Or those are my rules.
Please don't ask for a ton of charts like this. It is a distraction. I will hold the line on this to avoid burying myself. Either use BTC as your guide, or you can make your own. You can use linear for retraces but will be off a bit. DON"T ever use linear for forward projections!!!. But for log the key fibs are calculated this way:
=(Top/bottom)^0.618*bottom
Replace '.618' with the fib you need