World Markets Trend Lower
 By
By
World markets continued lower last week. Here's a look at the wave counts on indexes in Europe and the Americas.
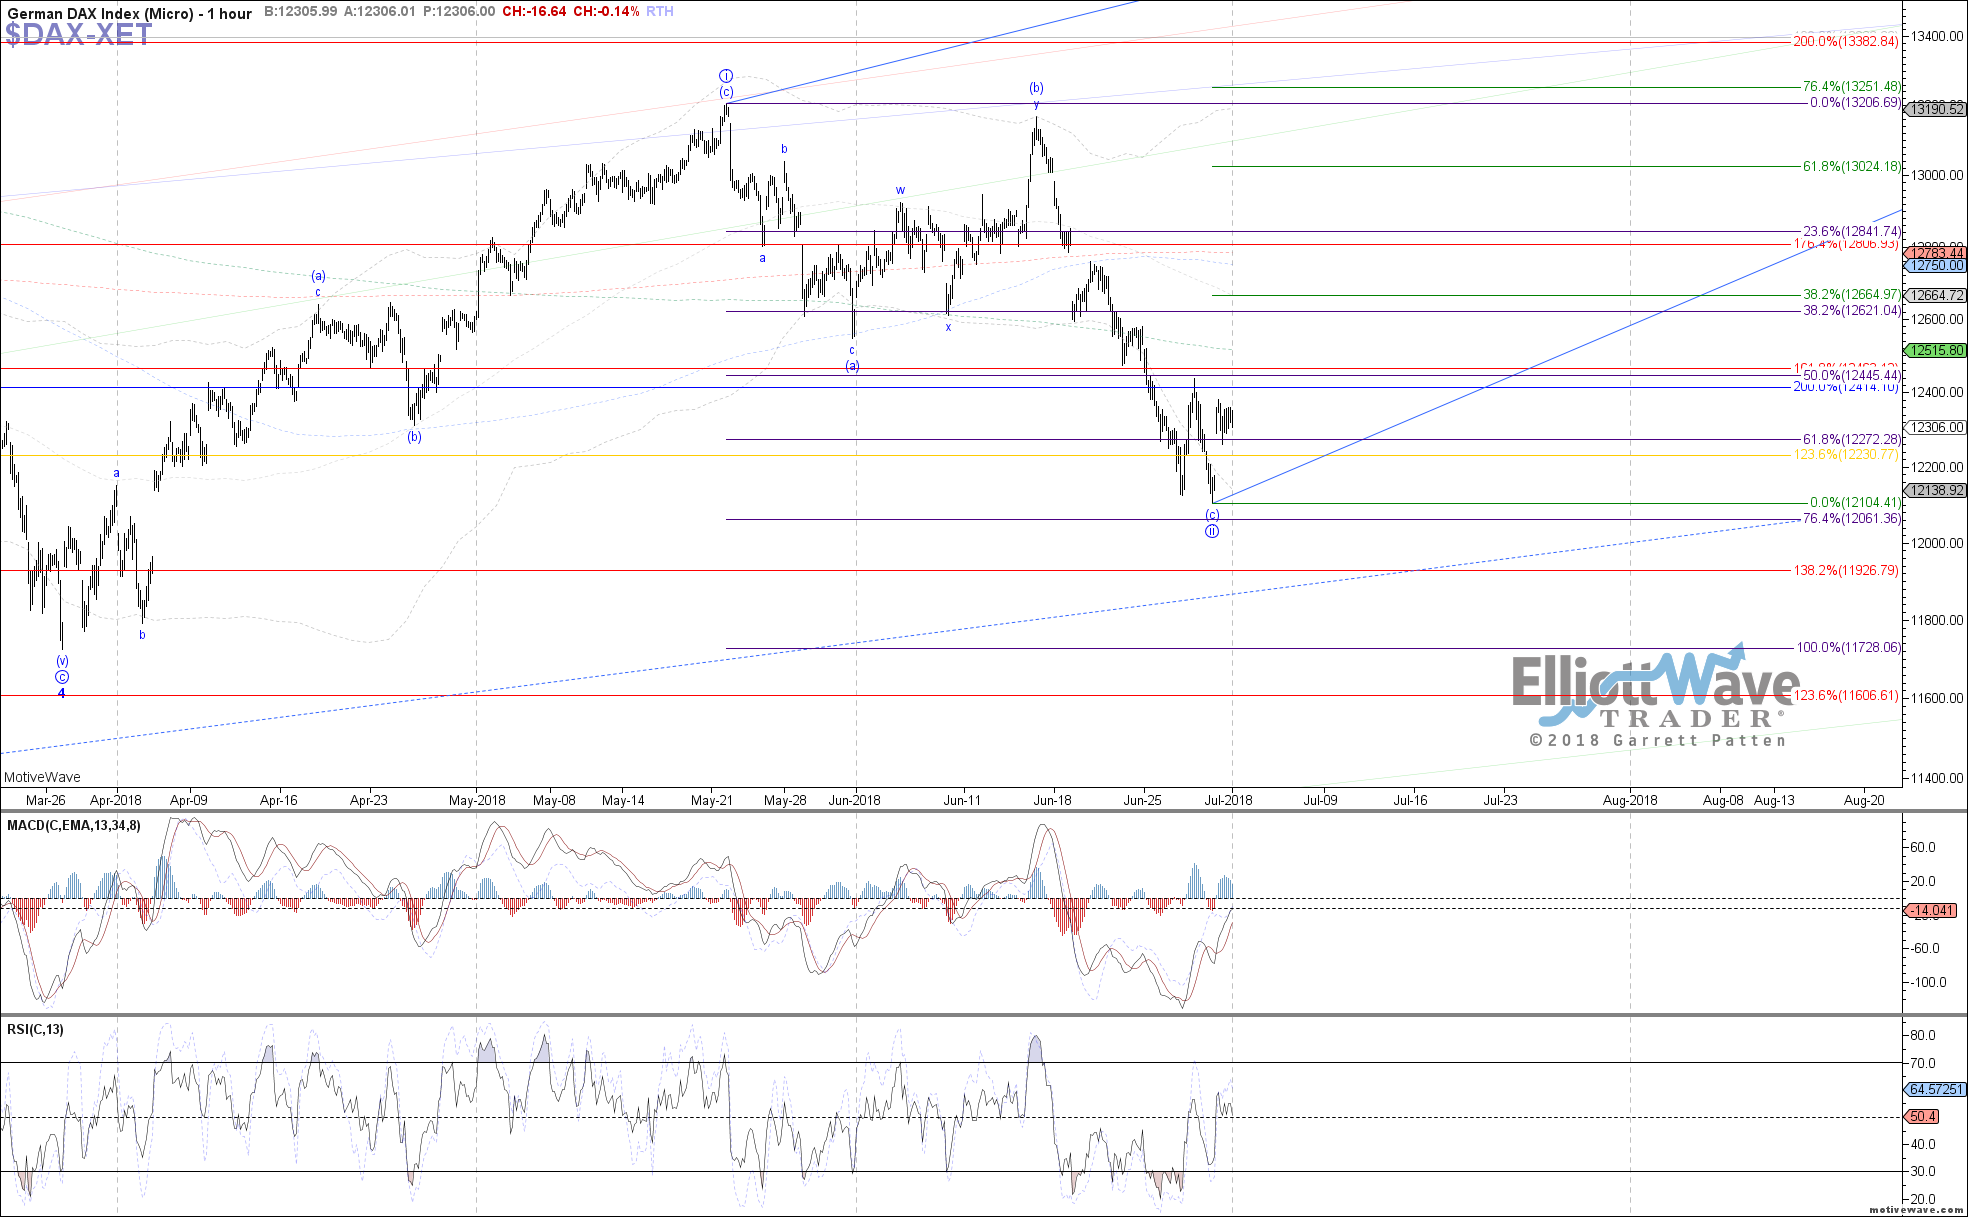
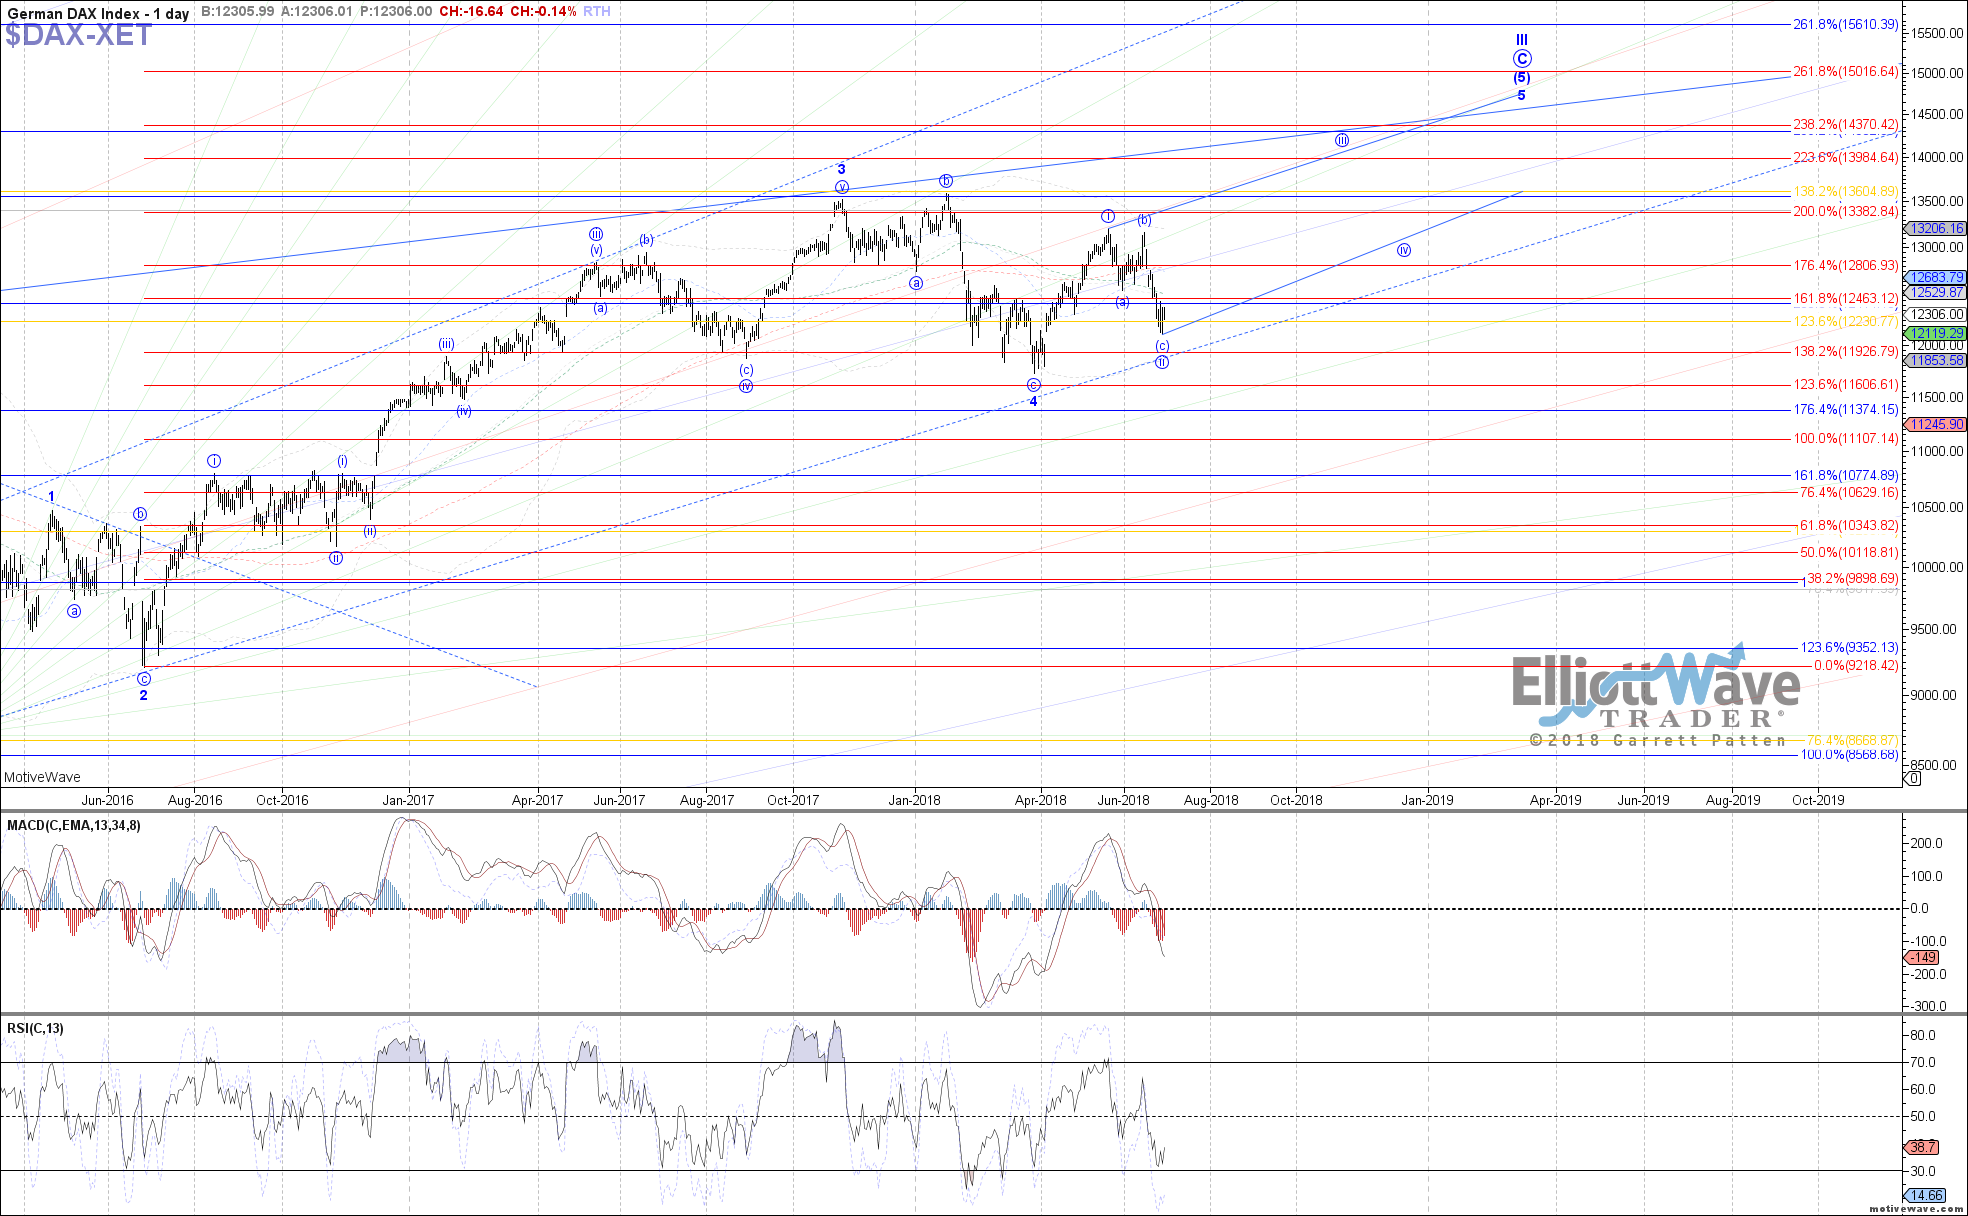
DAX: The DAX continued to stretch lower last week, still extending in wave (c) of ii. Price exceeded the .618 retrace in order to come close to testing the .764 retrace at last week’s low, but has since turned back up again. While I would love to see last week’s low as a bottom for wave (c) of ii, we still need more confirmation of such from price, starting with a break back above 12440 and then more importantly 12580. If those levels are cleared, then we can assume wave iii of 5 has started. Until then, 12060 remains the next support below if one more low is needed first.
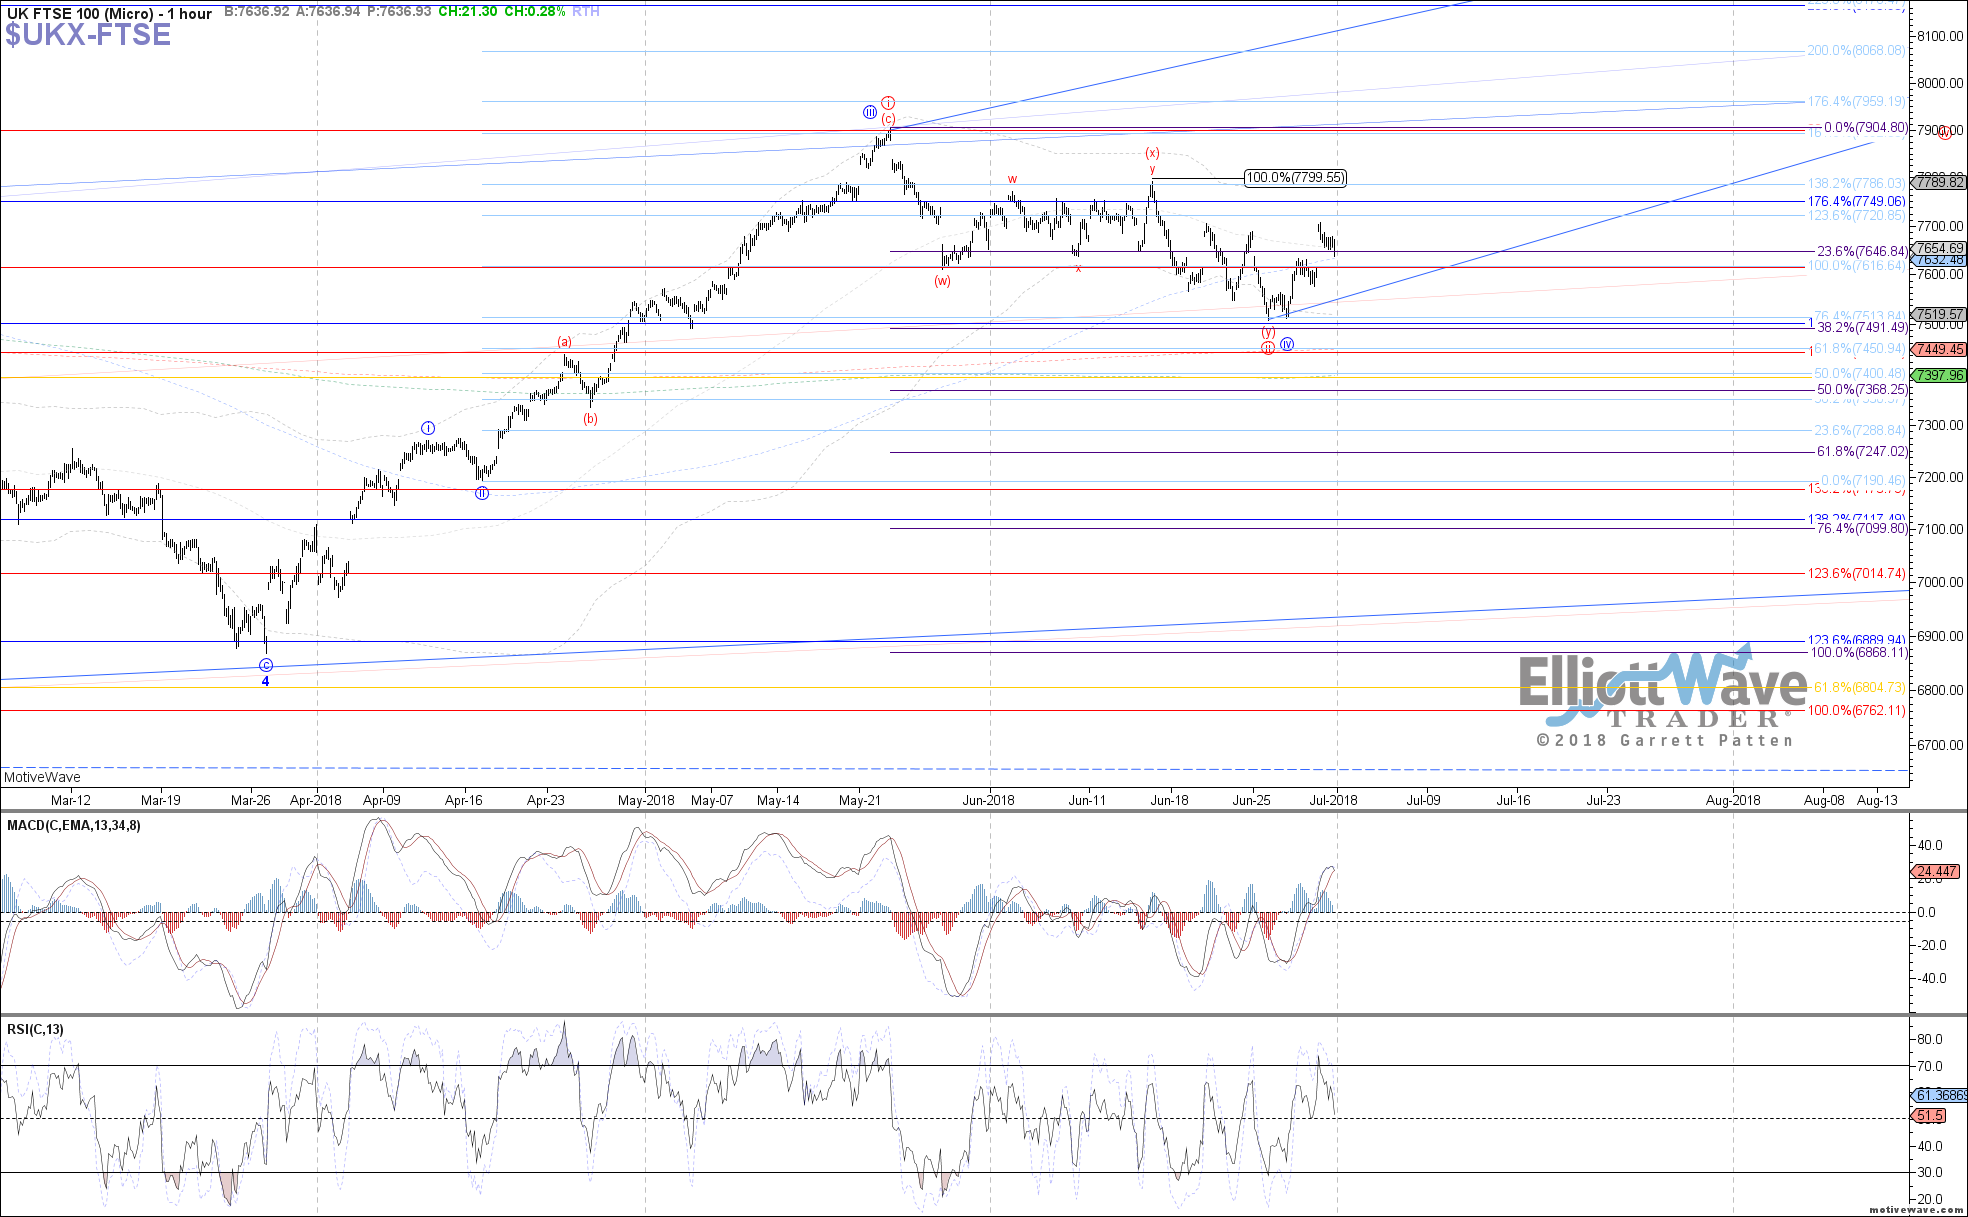
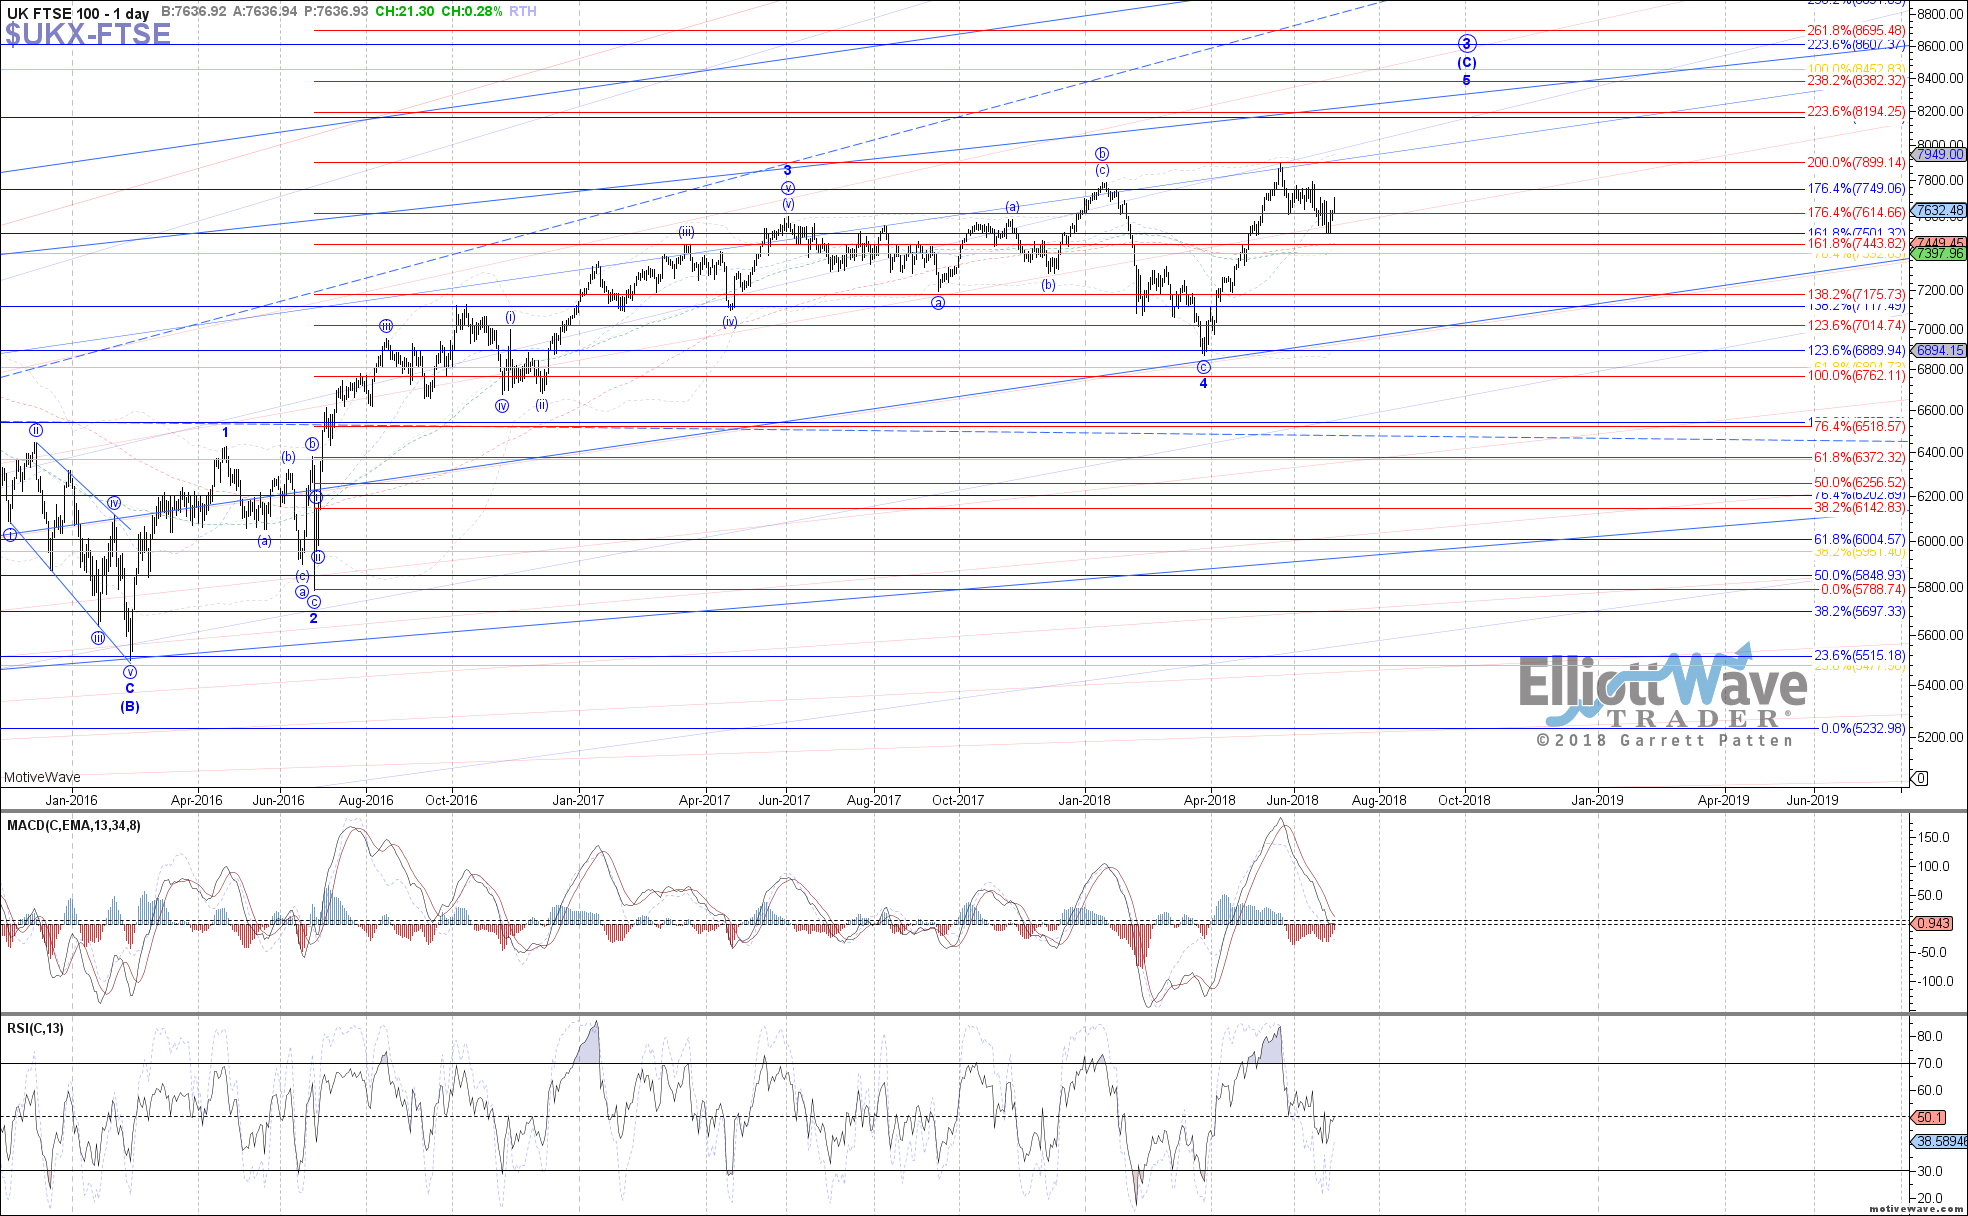
FTSE: The FTSE continued lower last week as well, coming very close to reaching the .382 retrace target at 7490. Price has since turned back up in what can count as a micro 5 waves off last week’s low, as the initial indication that a bottom may be in place for either red wave ii of 5 or blue wave iv of 5. Either way, a sustained break back above 7700 is the next step toward confirming that, followed by a break above the June high near 7800.
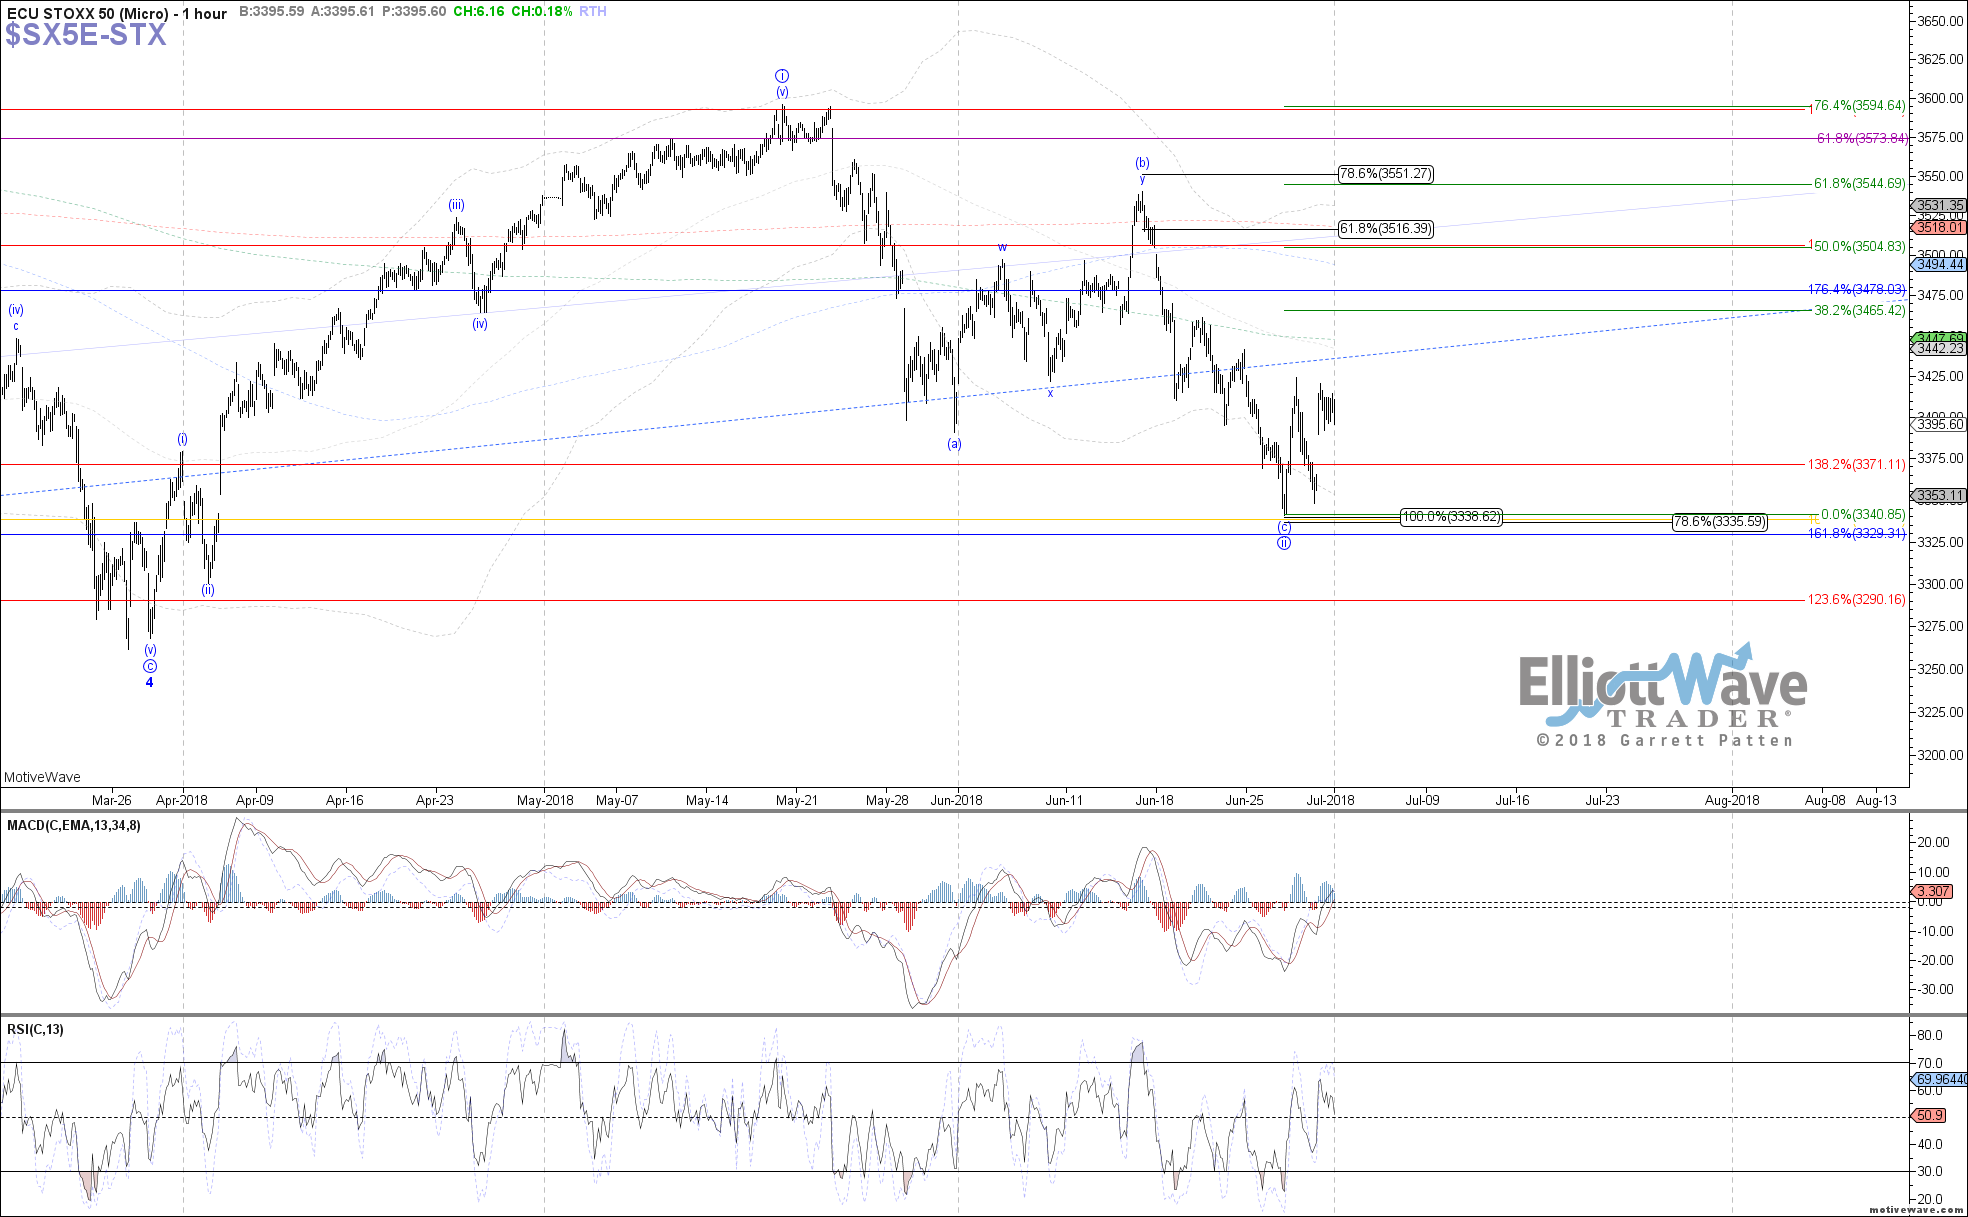
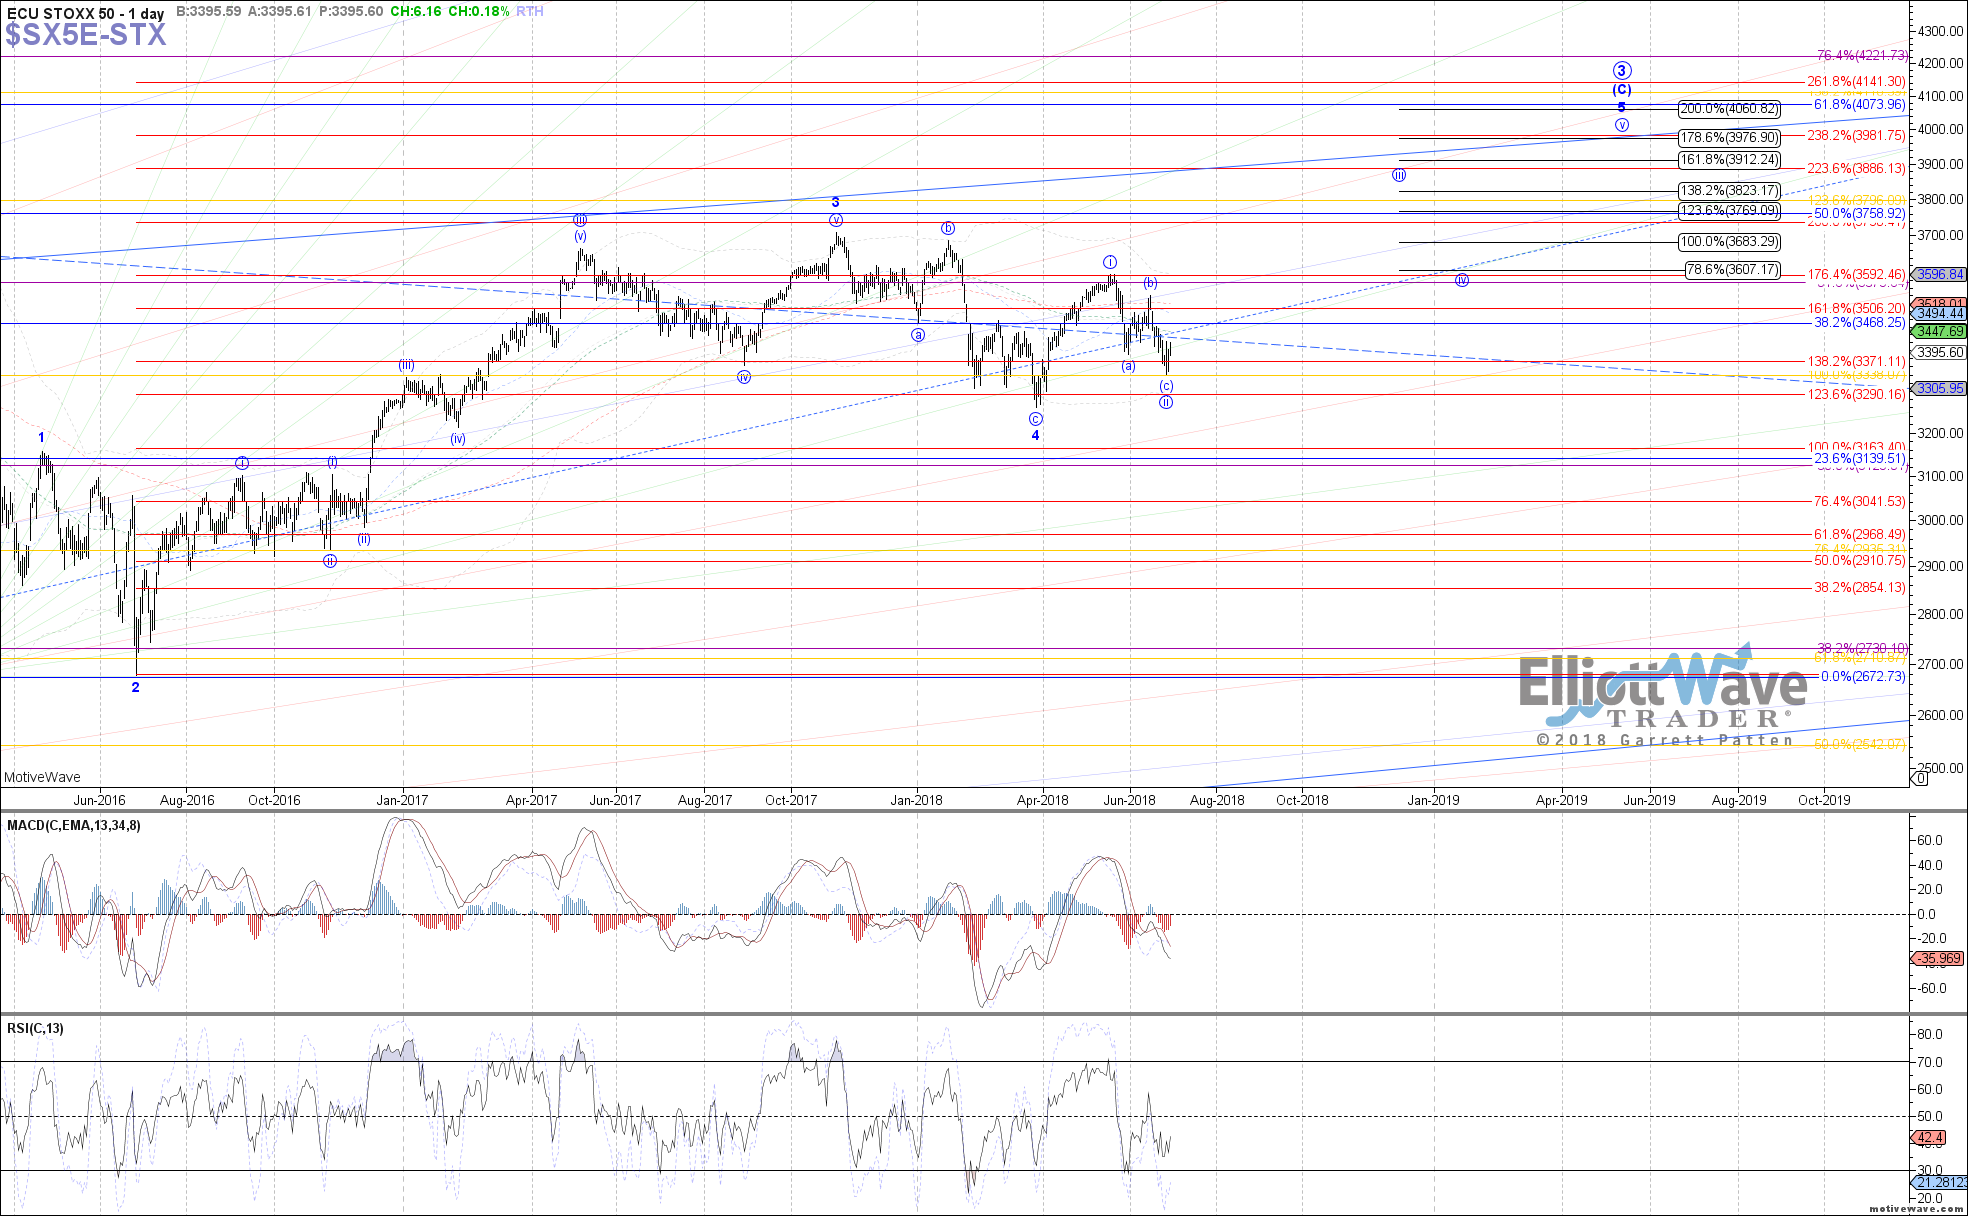
STOXX: The STOXX drifted lower last week also, elected to head down and test the next retrace support at 3335 as the .786 retrace. Price has since bounced off that support for a possible bottom in place, but I would still like to see more confirmation before confidently assuming that wave iii of 5 is underway. A break back above 3440 is the next step toward confirming that, followed by a break above 3460.
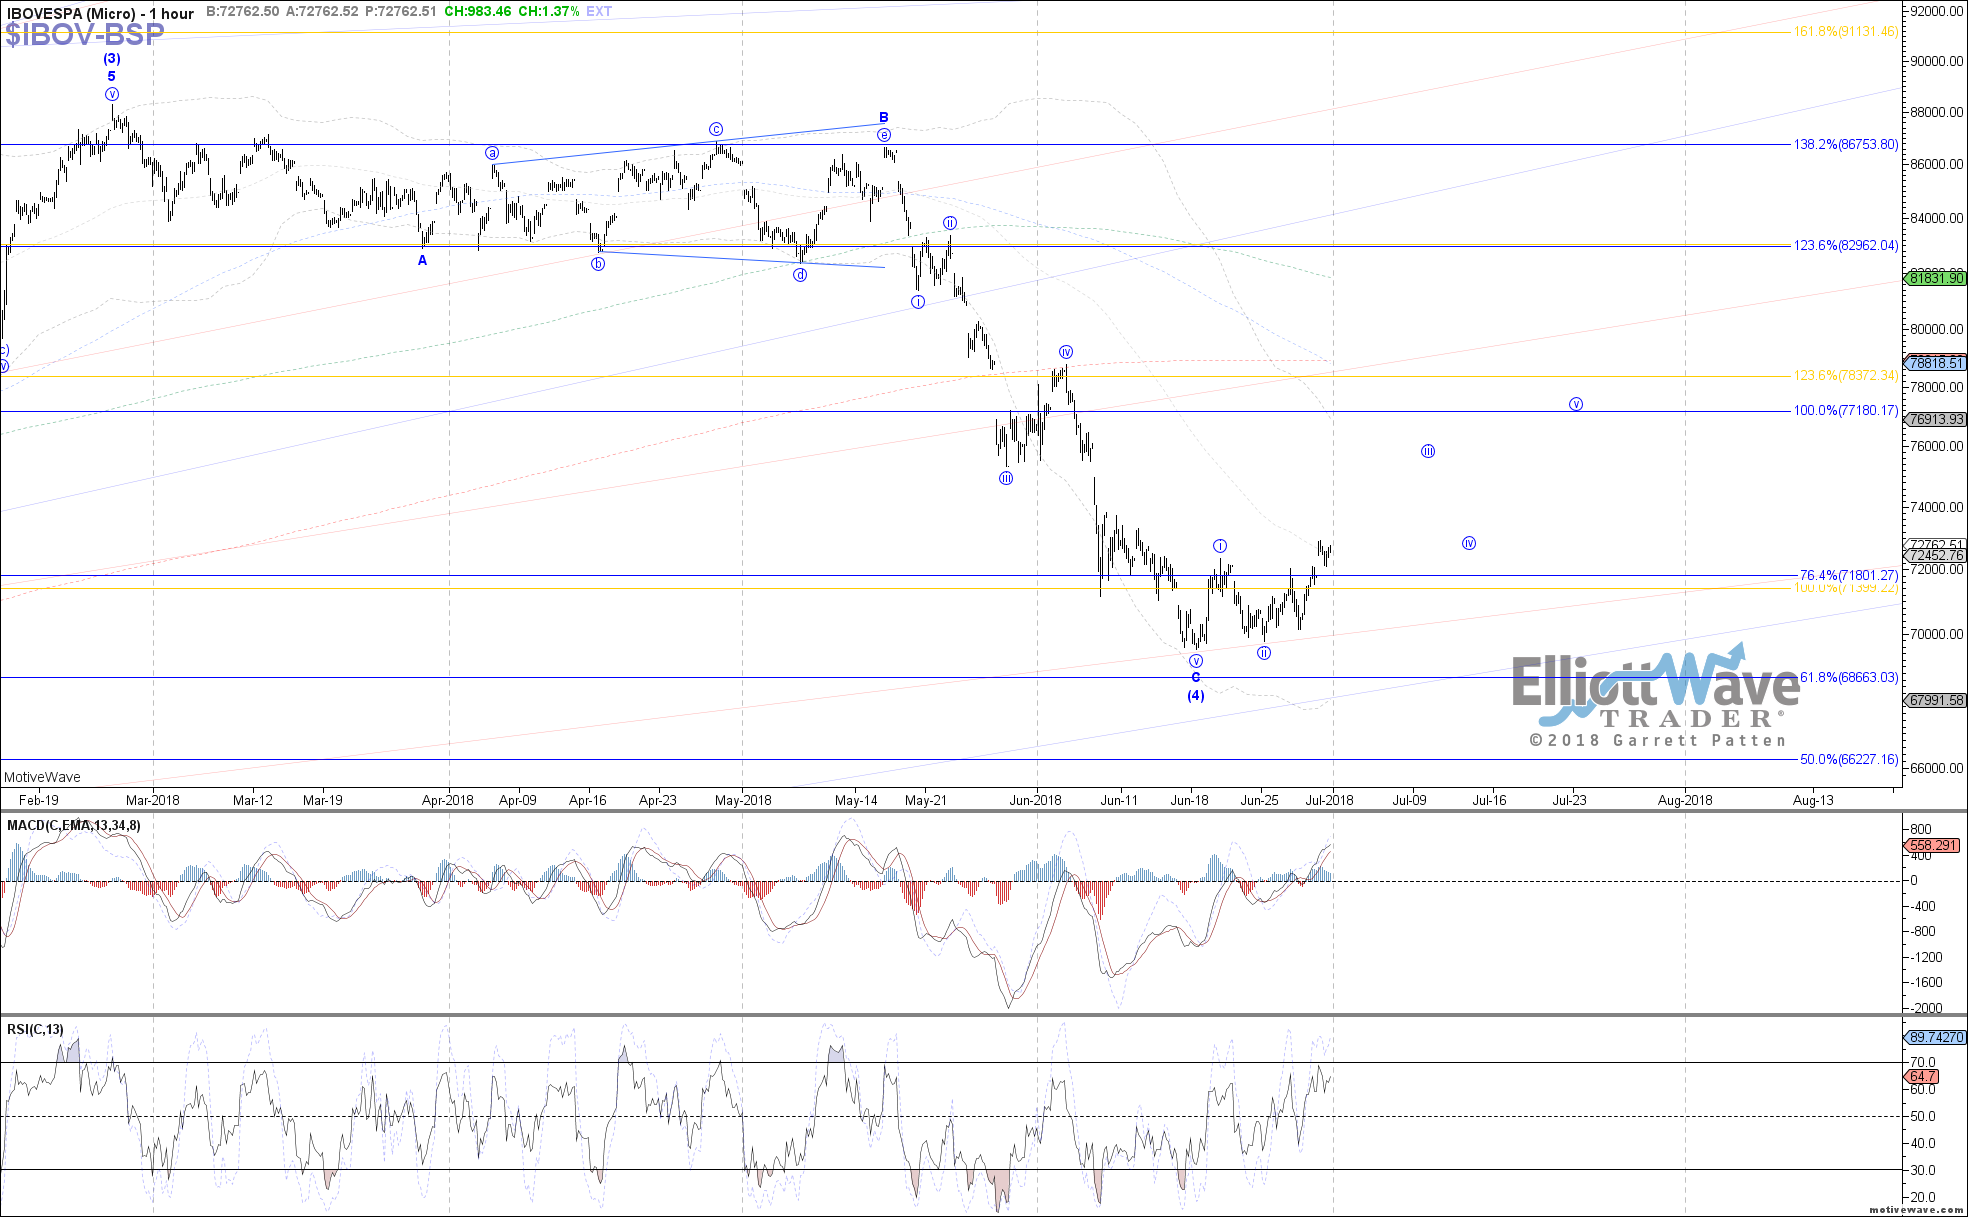
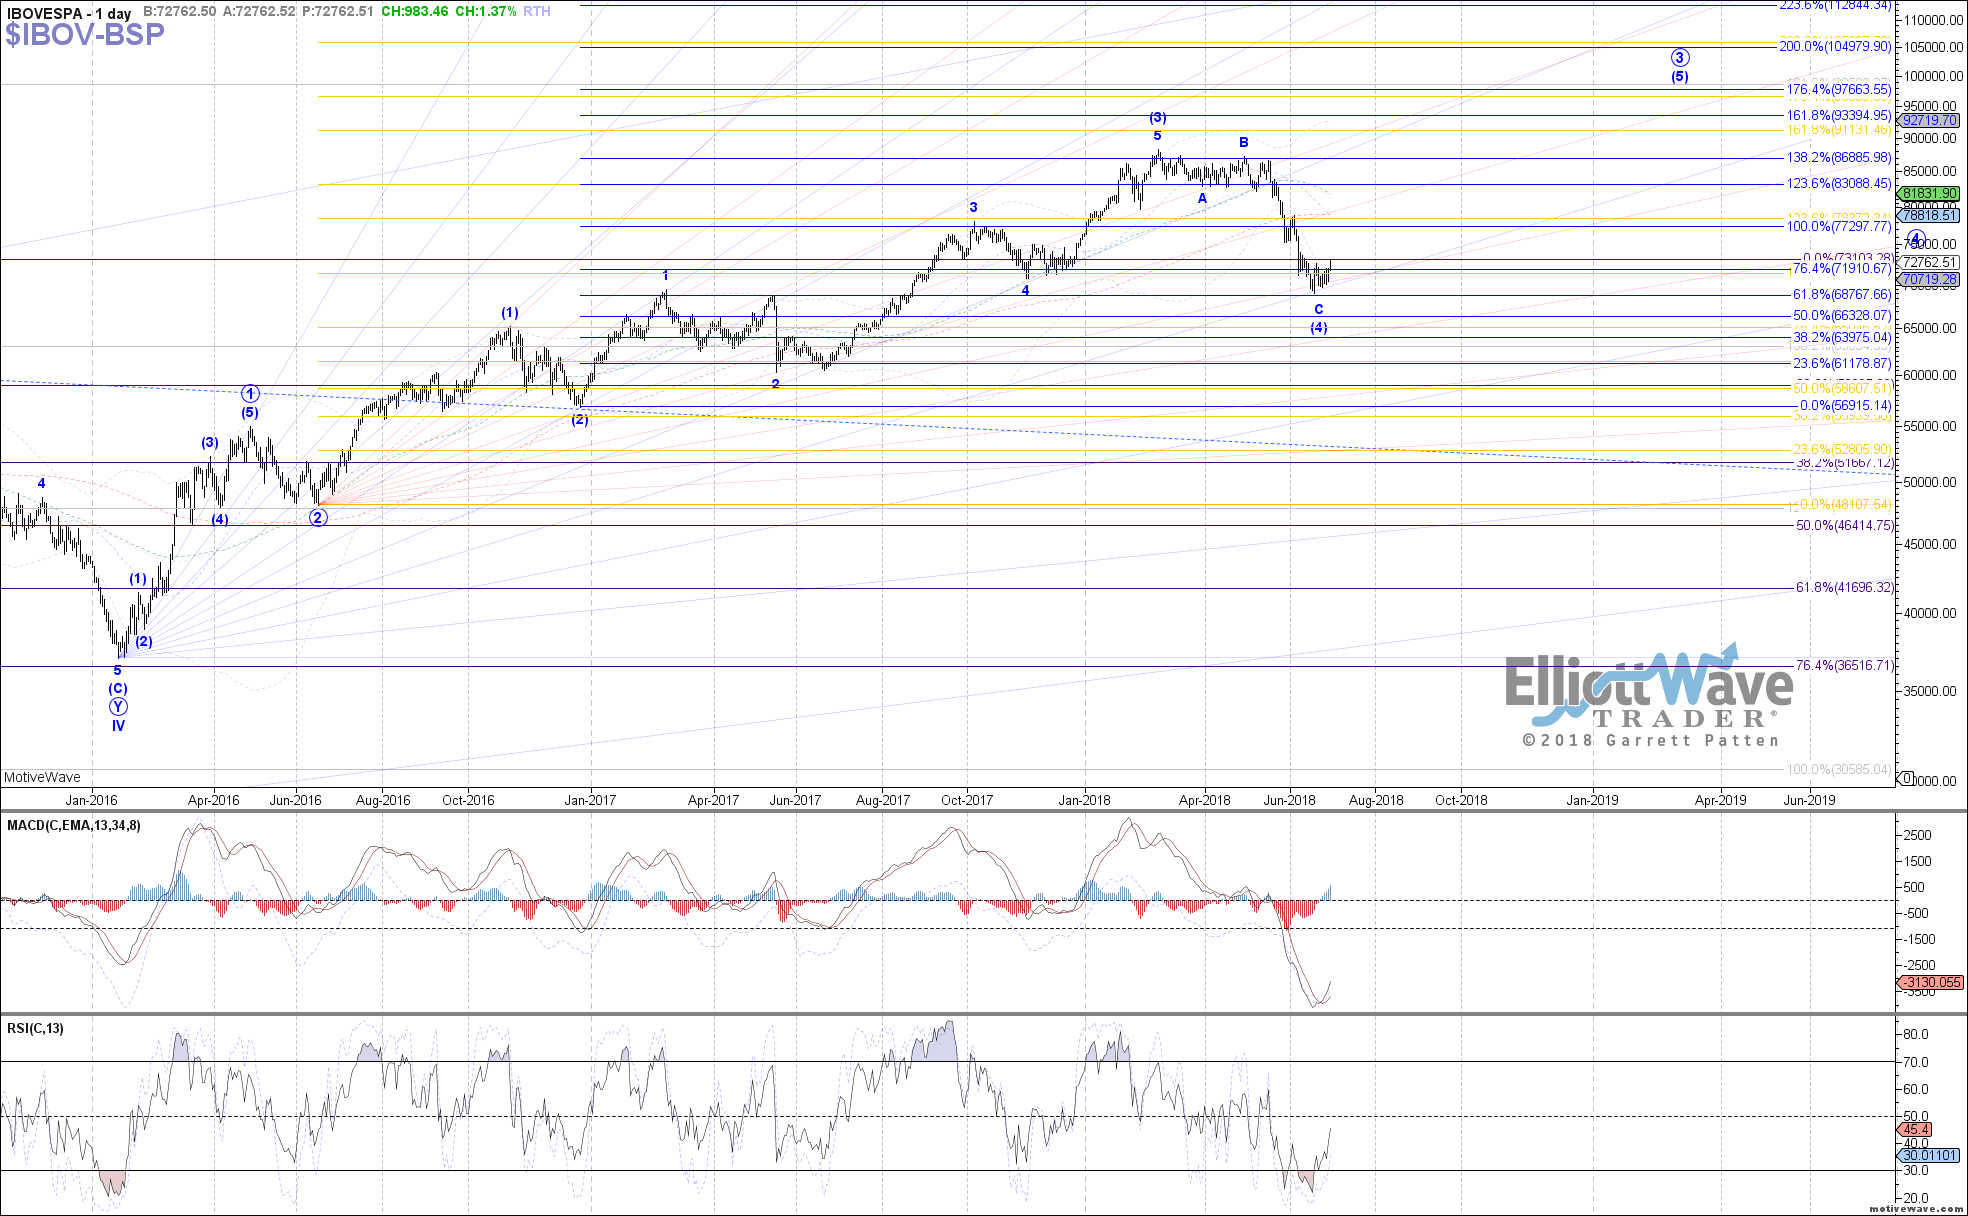
IBOV: The Bovespa traded higher overall last week, holding above the current June low during the selling pressure across other markets. Therefore, the potential for a bottom to be in place for wave C of (4) is still on the table, with price now approaching the signal level at 74000 which if exceeded would start to confirm that bottom. After that, it would be nice to see price fill out 5 waves up off the June low, which would count as wave 1 of (5).
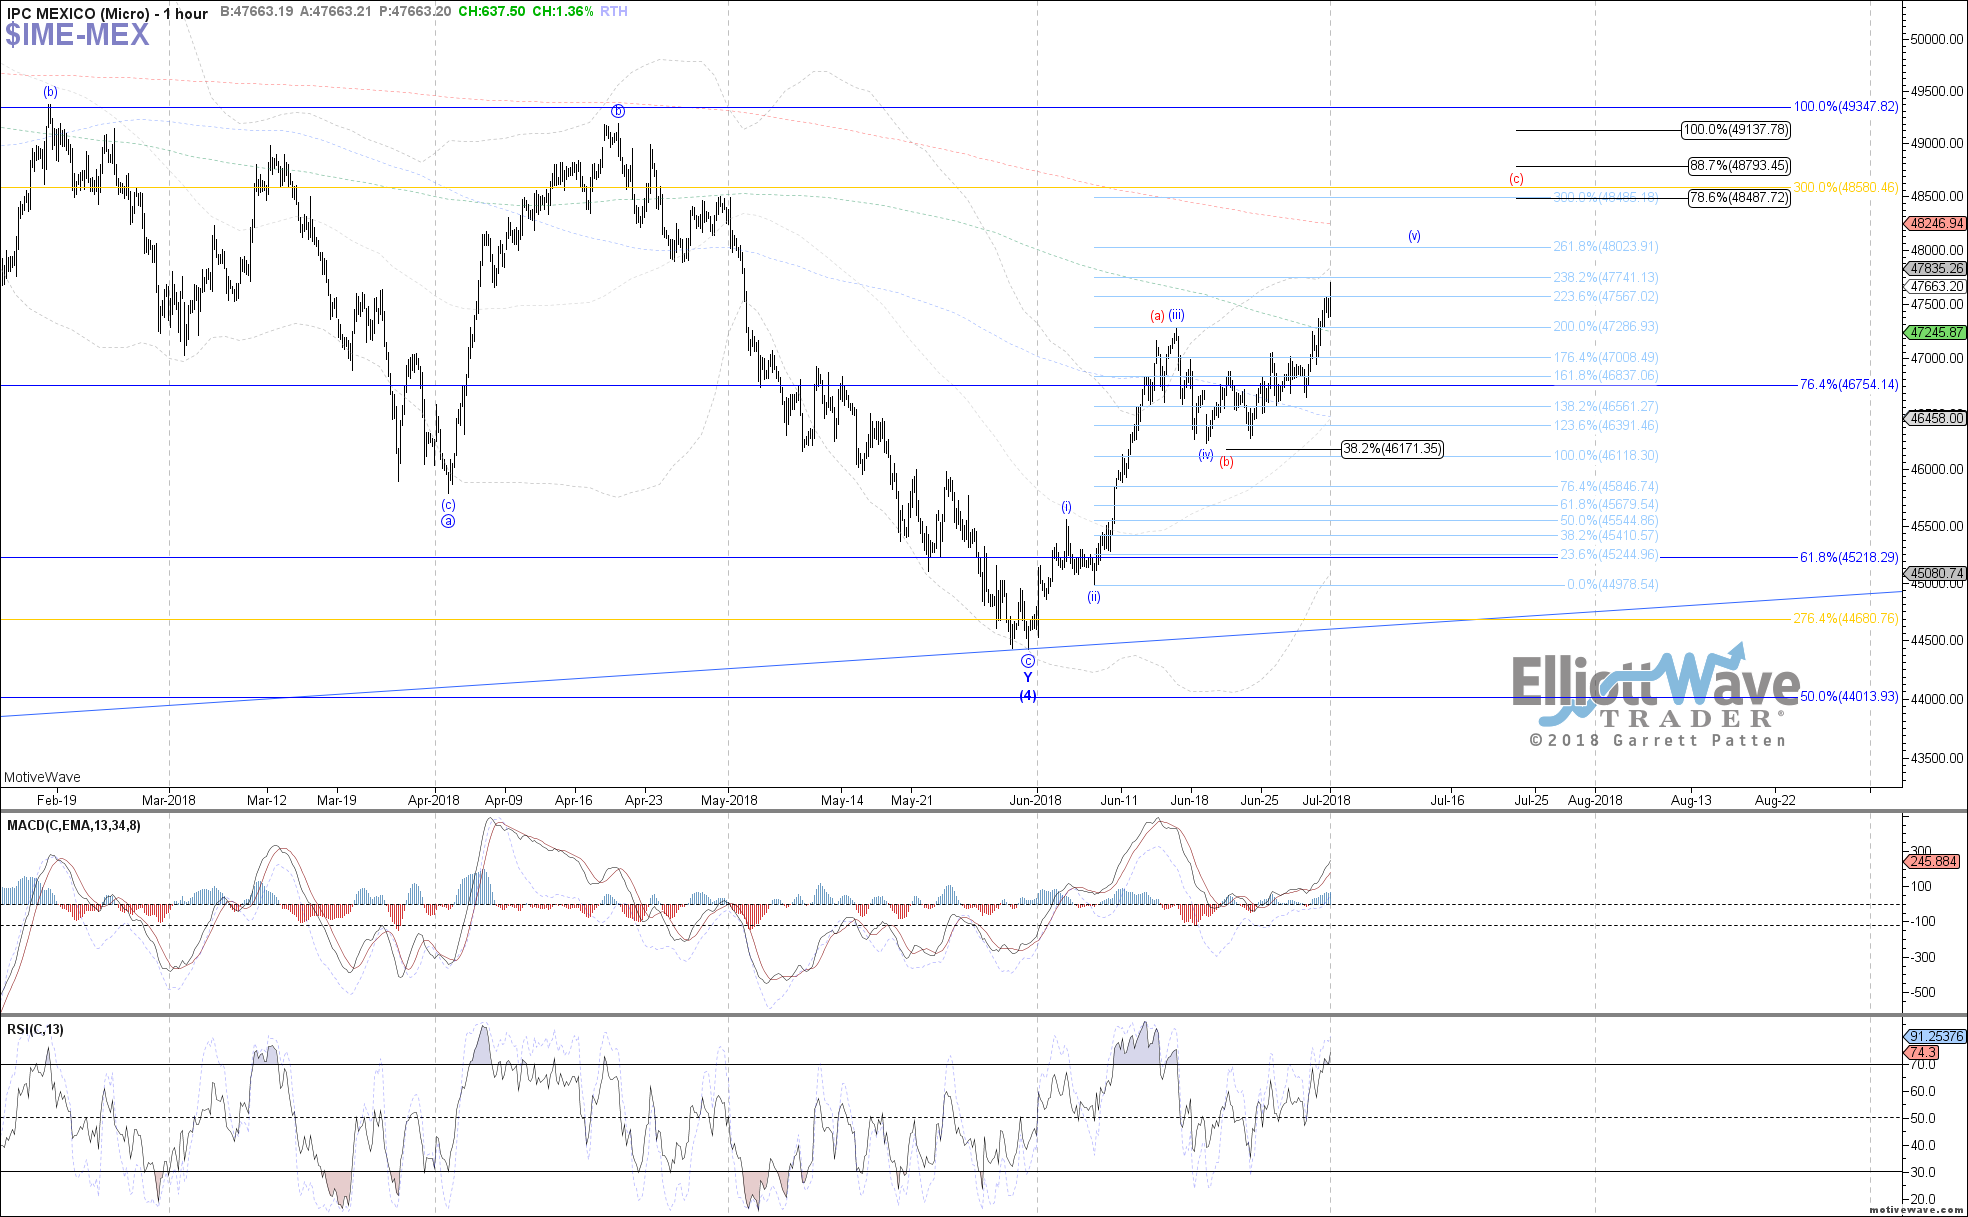
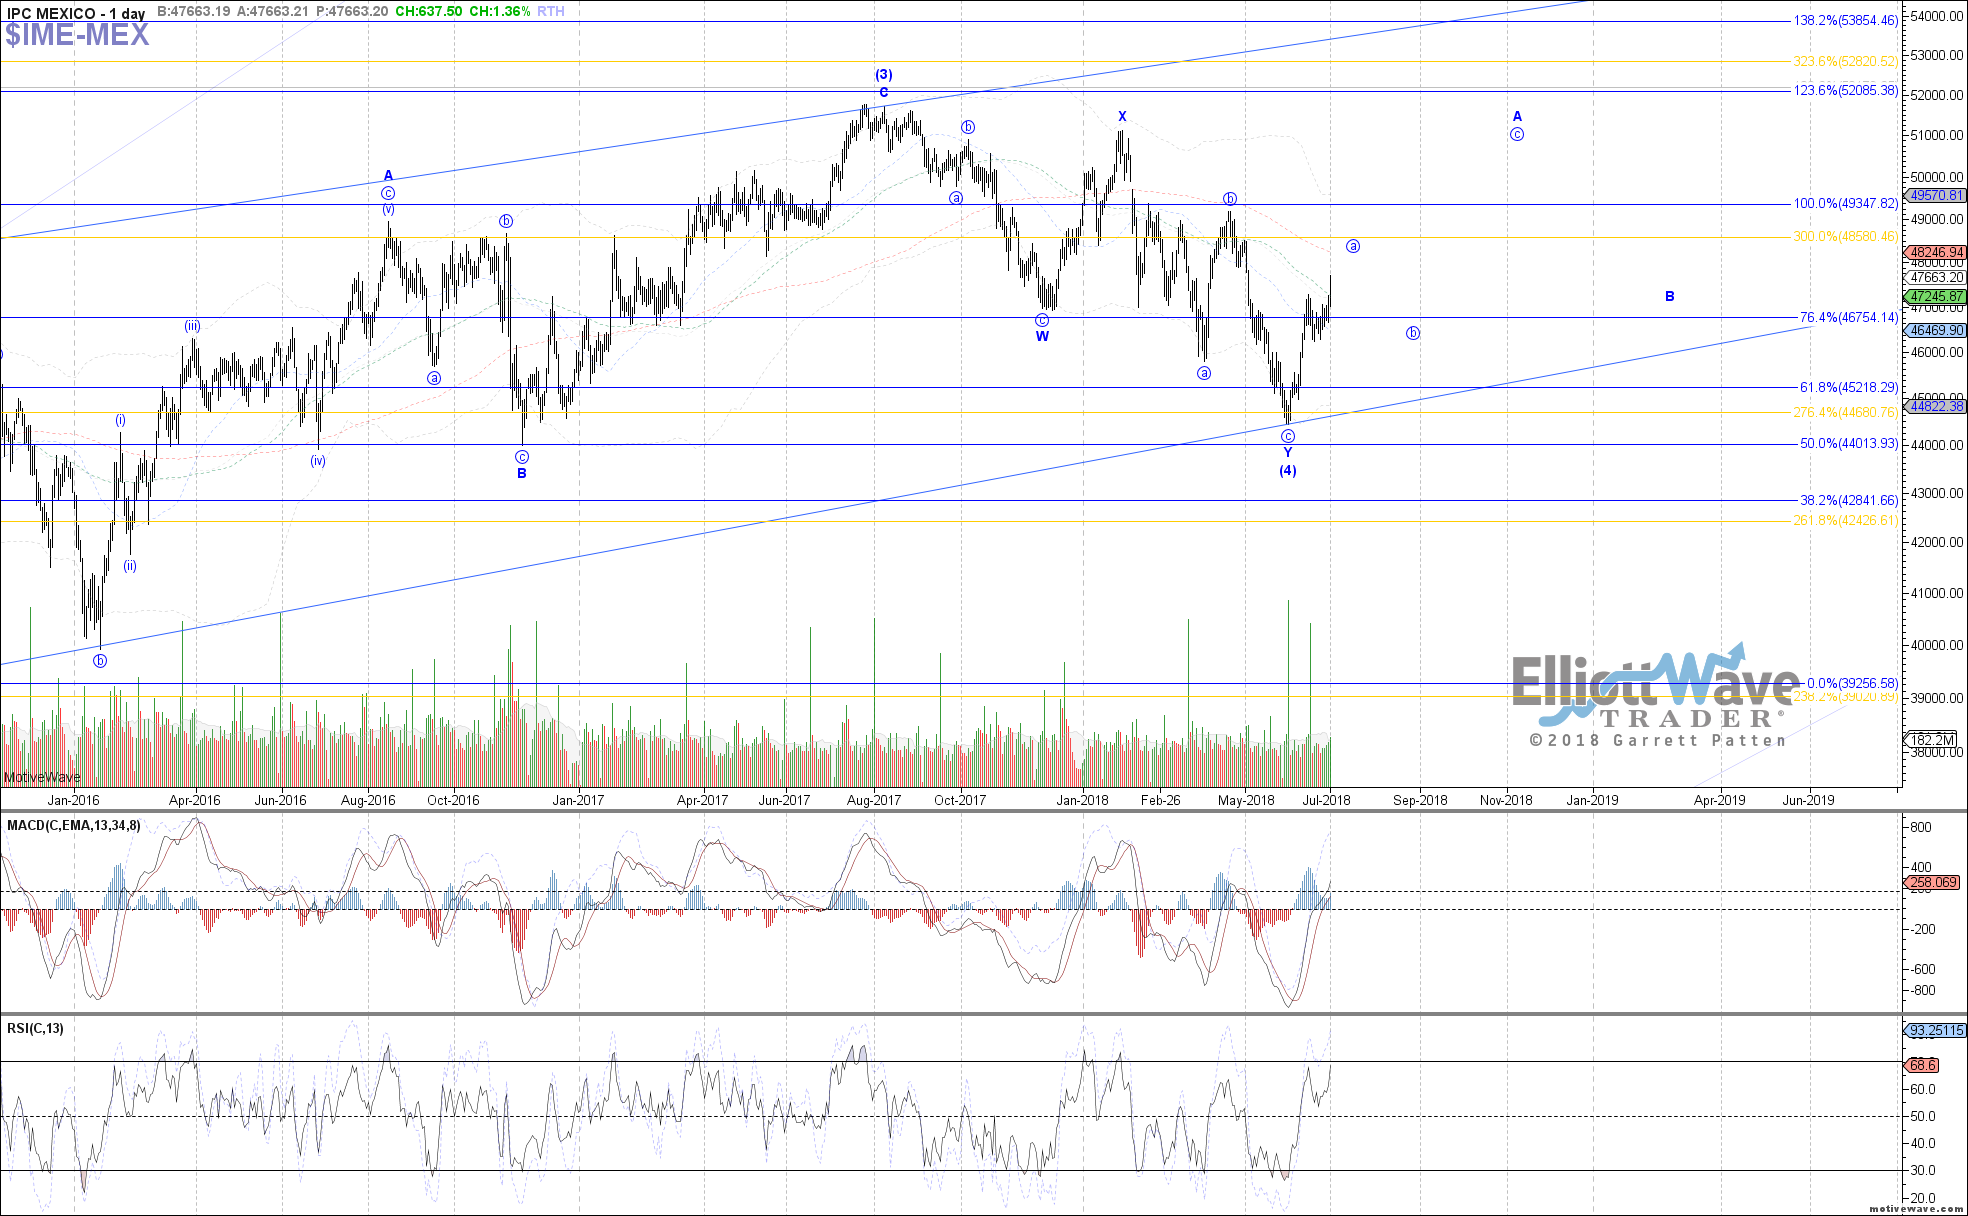
IPC: The IPC also held strong during the selling pressure elsewhere in the world last week, eventually making a new high on the month and following the blue path so far as the possible wave (v) to an impulse off the May low. If that count is correct, then blue wave (v) should be completing somewhere near 48025, otherwise if this move continues to extend all the way up to 48485 – 49140 instead, it will look more like an abc up off the May low shown in red.