World Markets Review: Breakout in European Indices
 By
By
EUROPE/AMERICAS
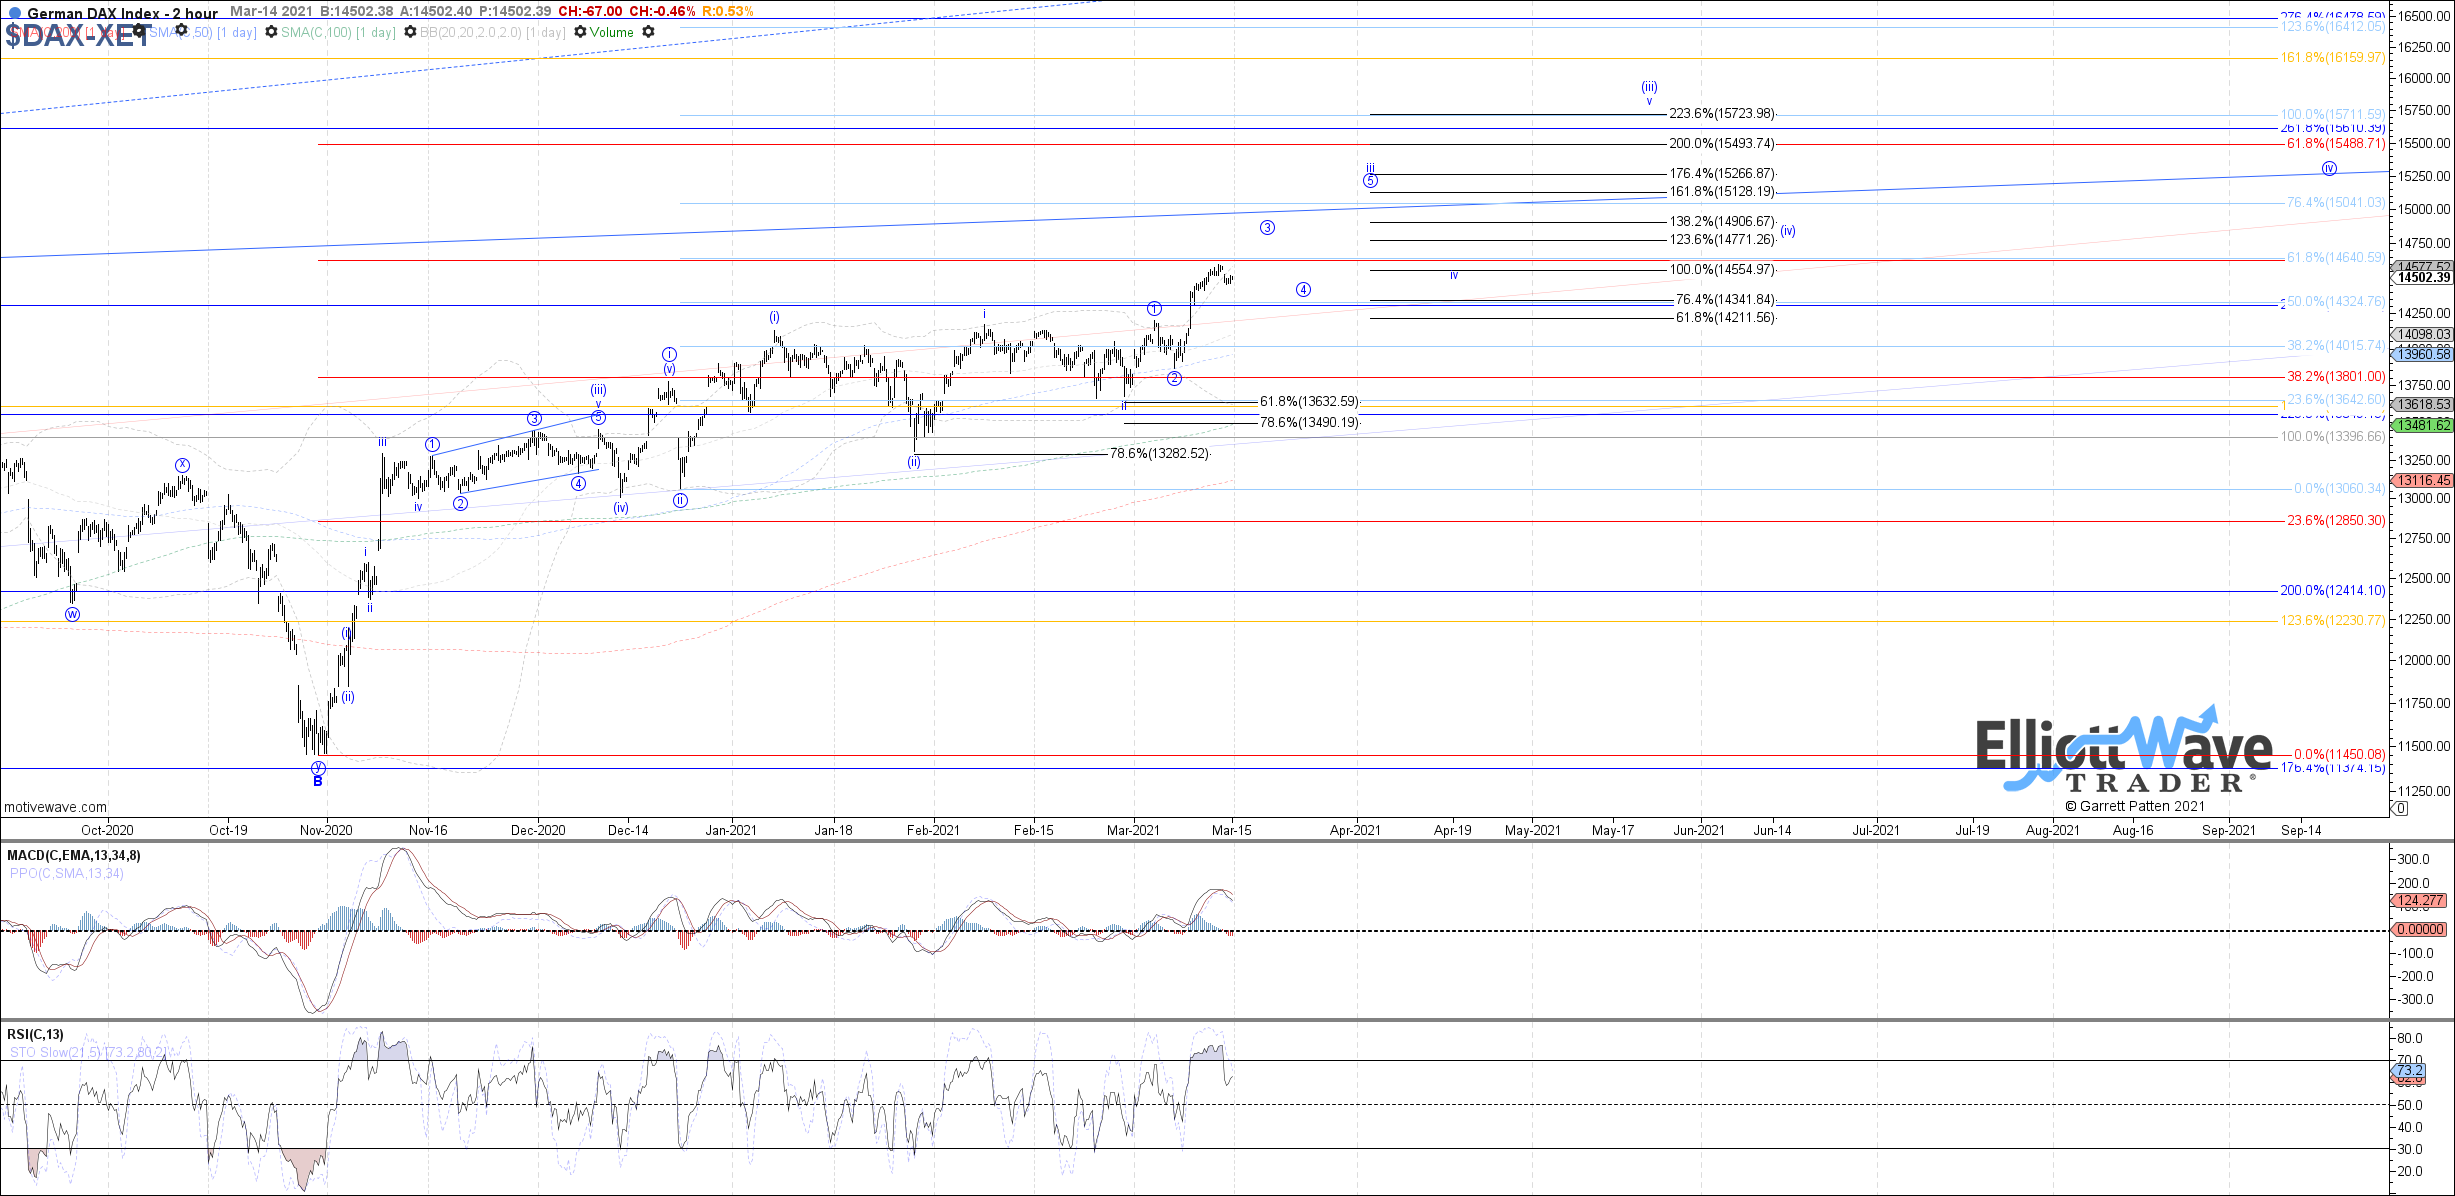
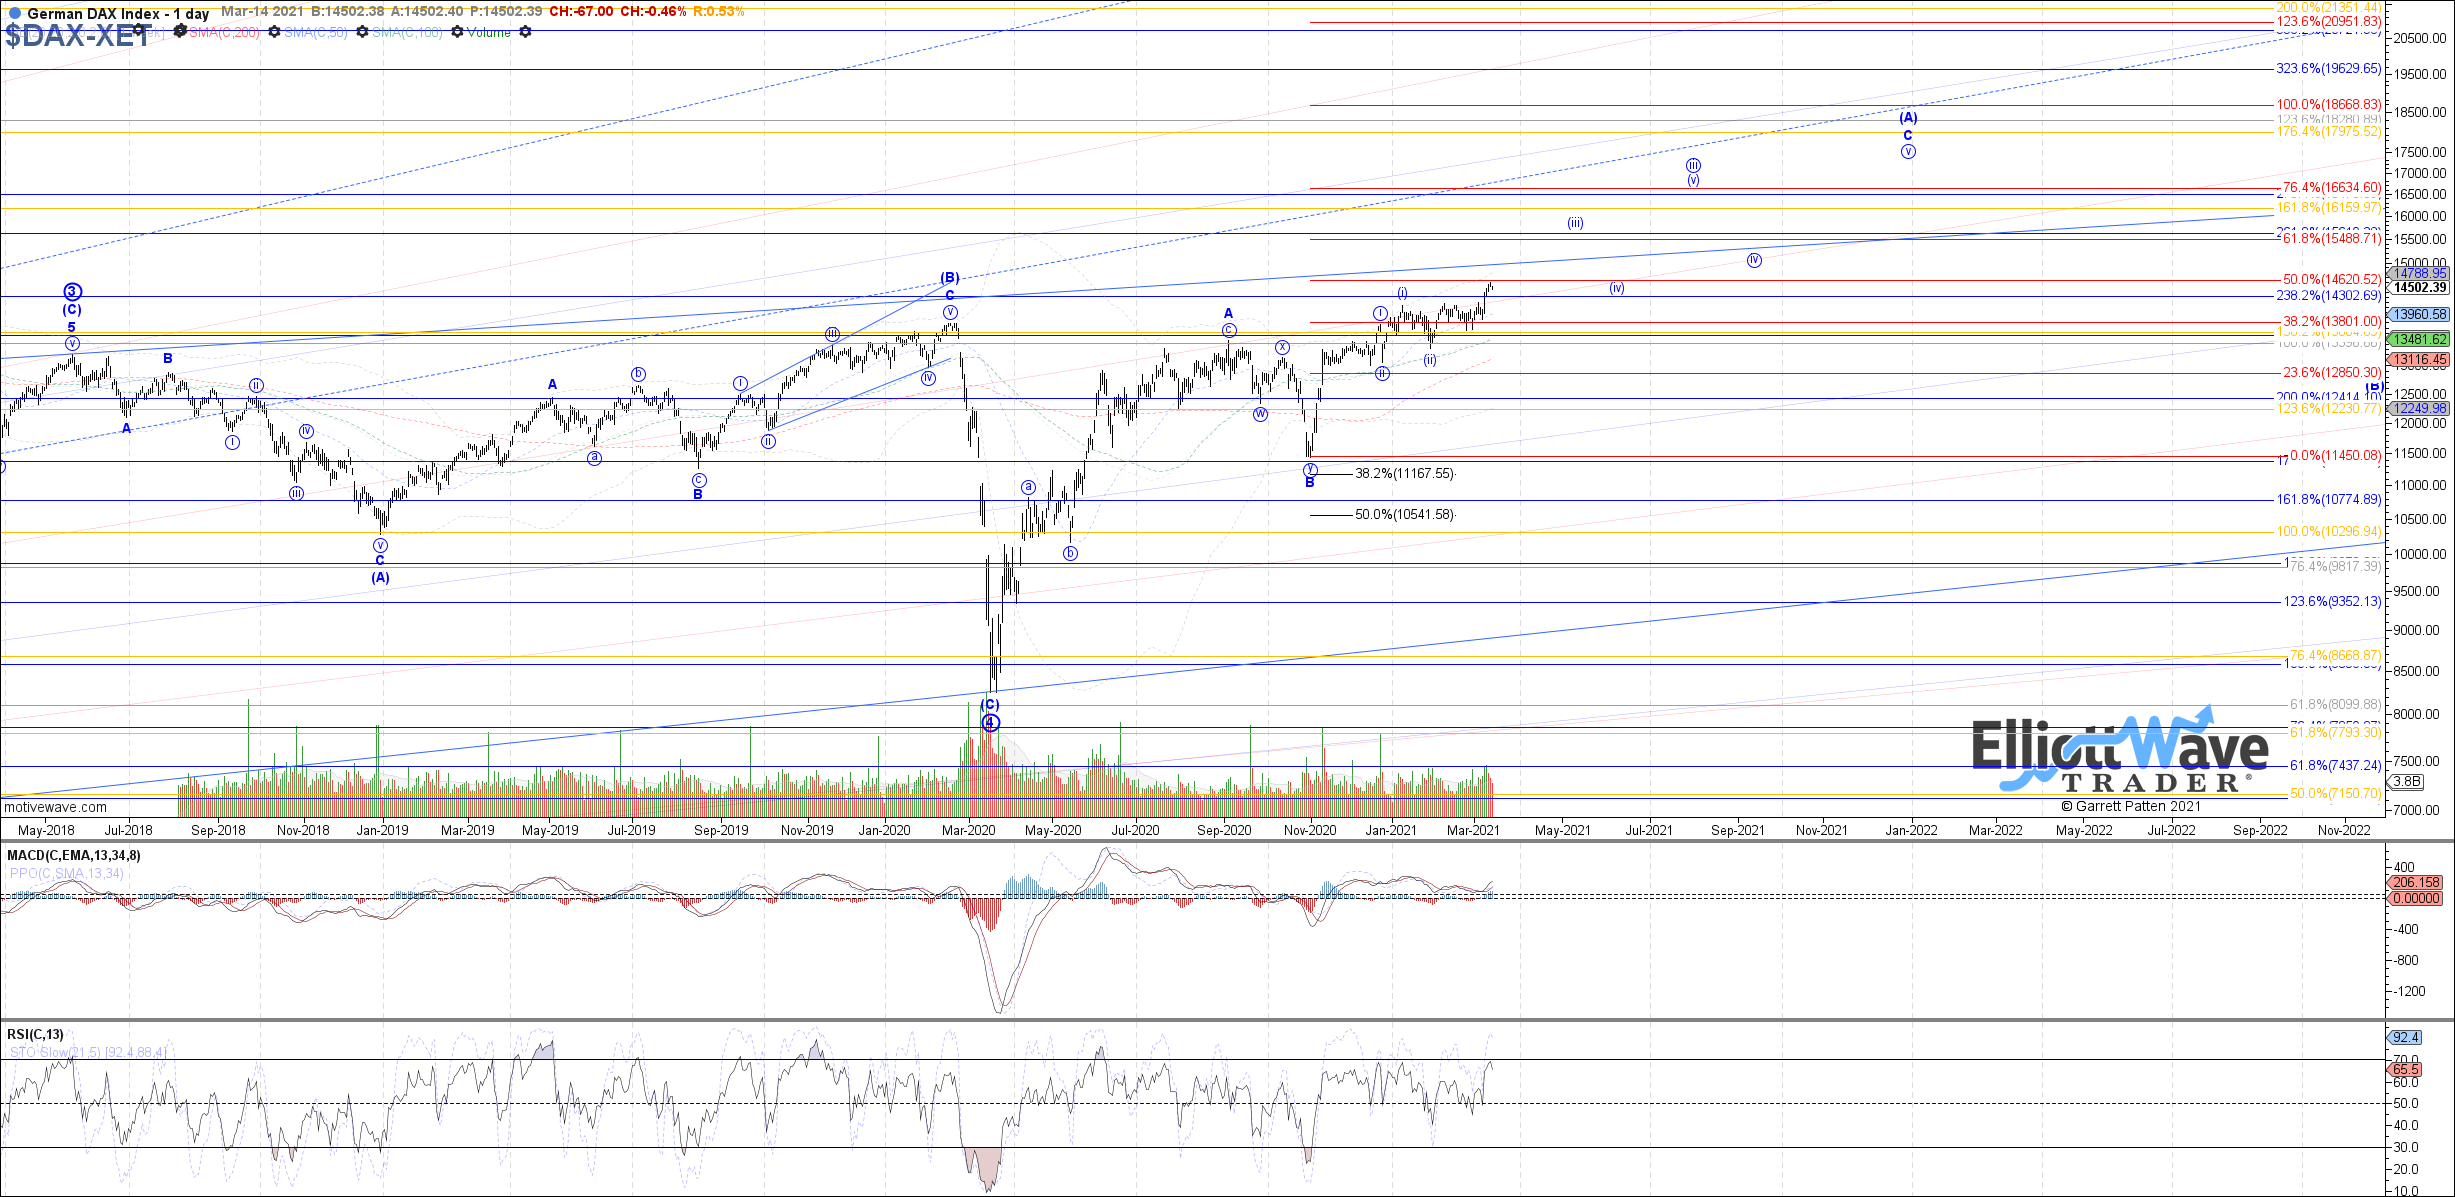
DAX: The DAX traded strongly higher last week, breaking out cleanly above the prior high on the month and the February high and therefore following expectations for wave 3 of iii currently filling out. Price is still a little bit shy of reaching the ideal 14770 fib target before wave 3 of iii completes, so ideally a little more near-term upside to begin this week before consolidating in wave 4 of iii. Overall, as long 14210 holds as support we can continue looking higher.
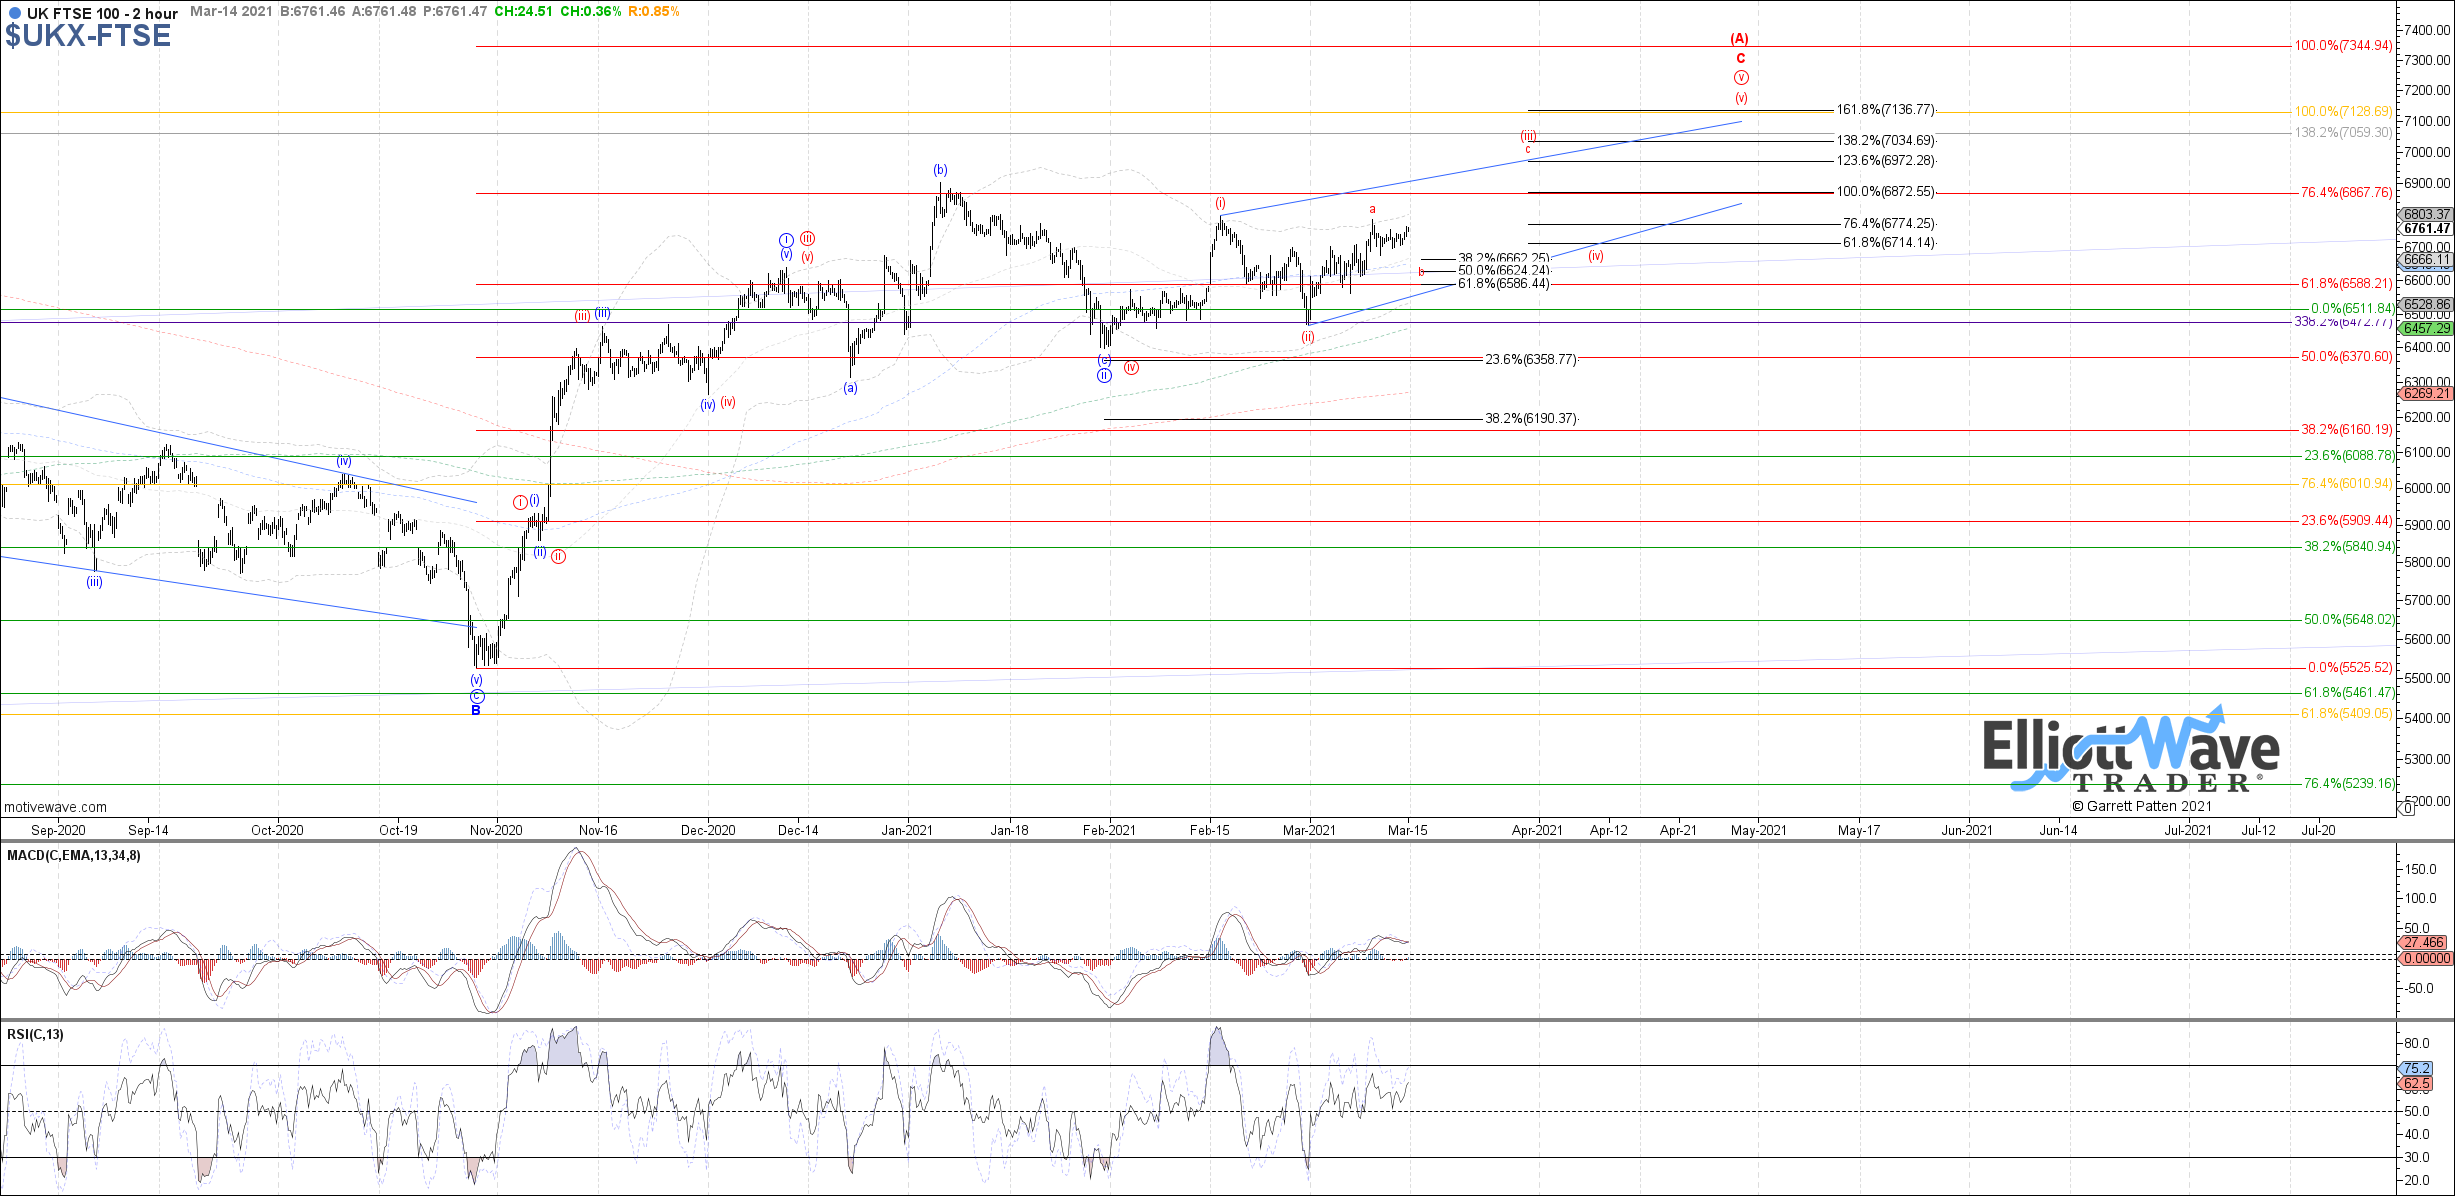
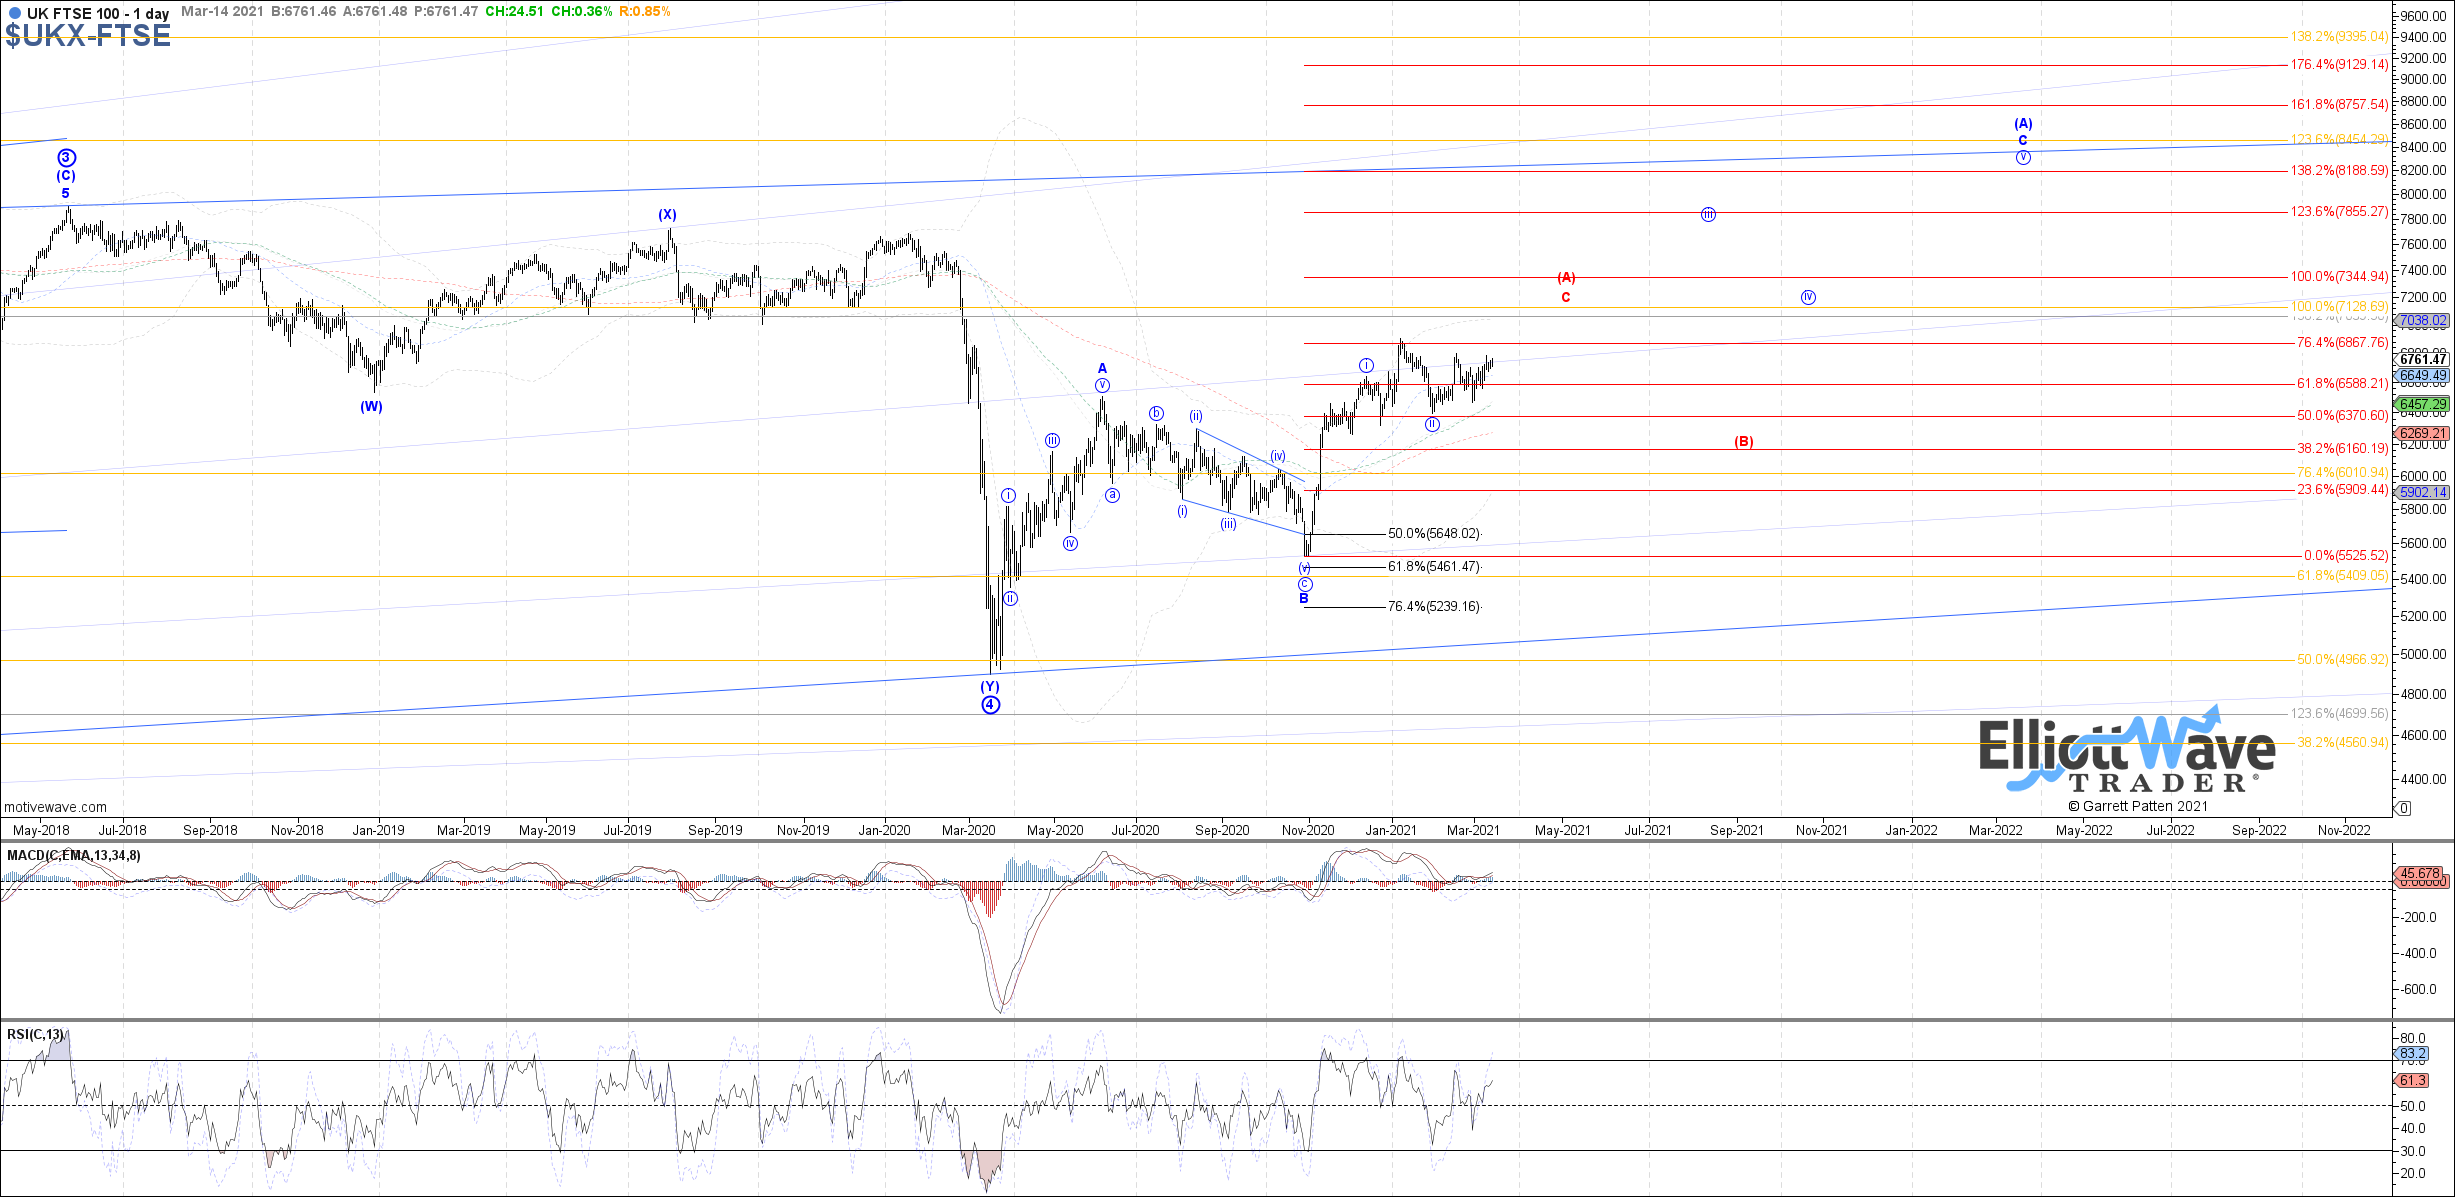
FTSE: The FTSE started off initially higher last week, but then consolidated sideways from there into Friday’s close. So far price is still holding and trying to fill out the diagonal structure off the January low, which fits best as an ending diagonal for red wave v of C. Therefore, as long as price is holding above 6660 – 6585 as current support for red wave b of (iii), then further upside can be expected with 6970 as the ideal target to reach as wave c of (iii).
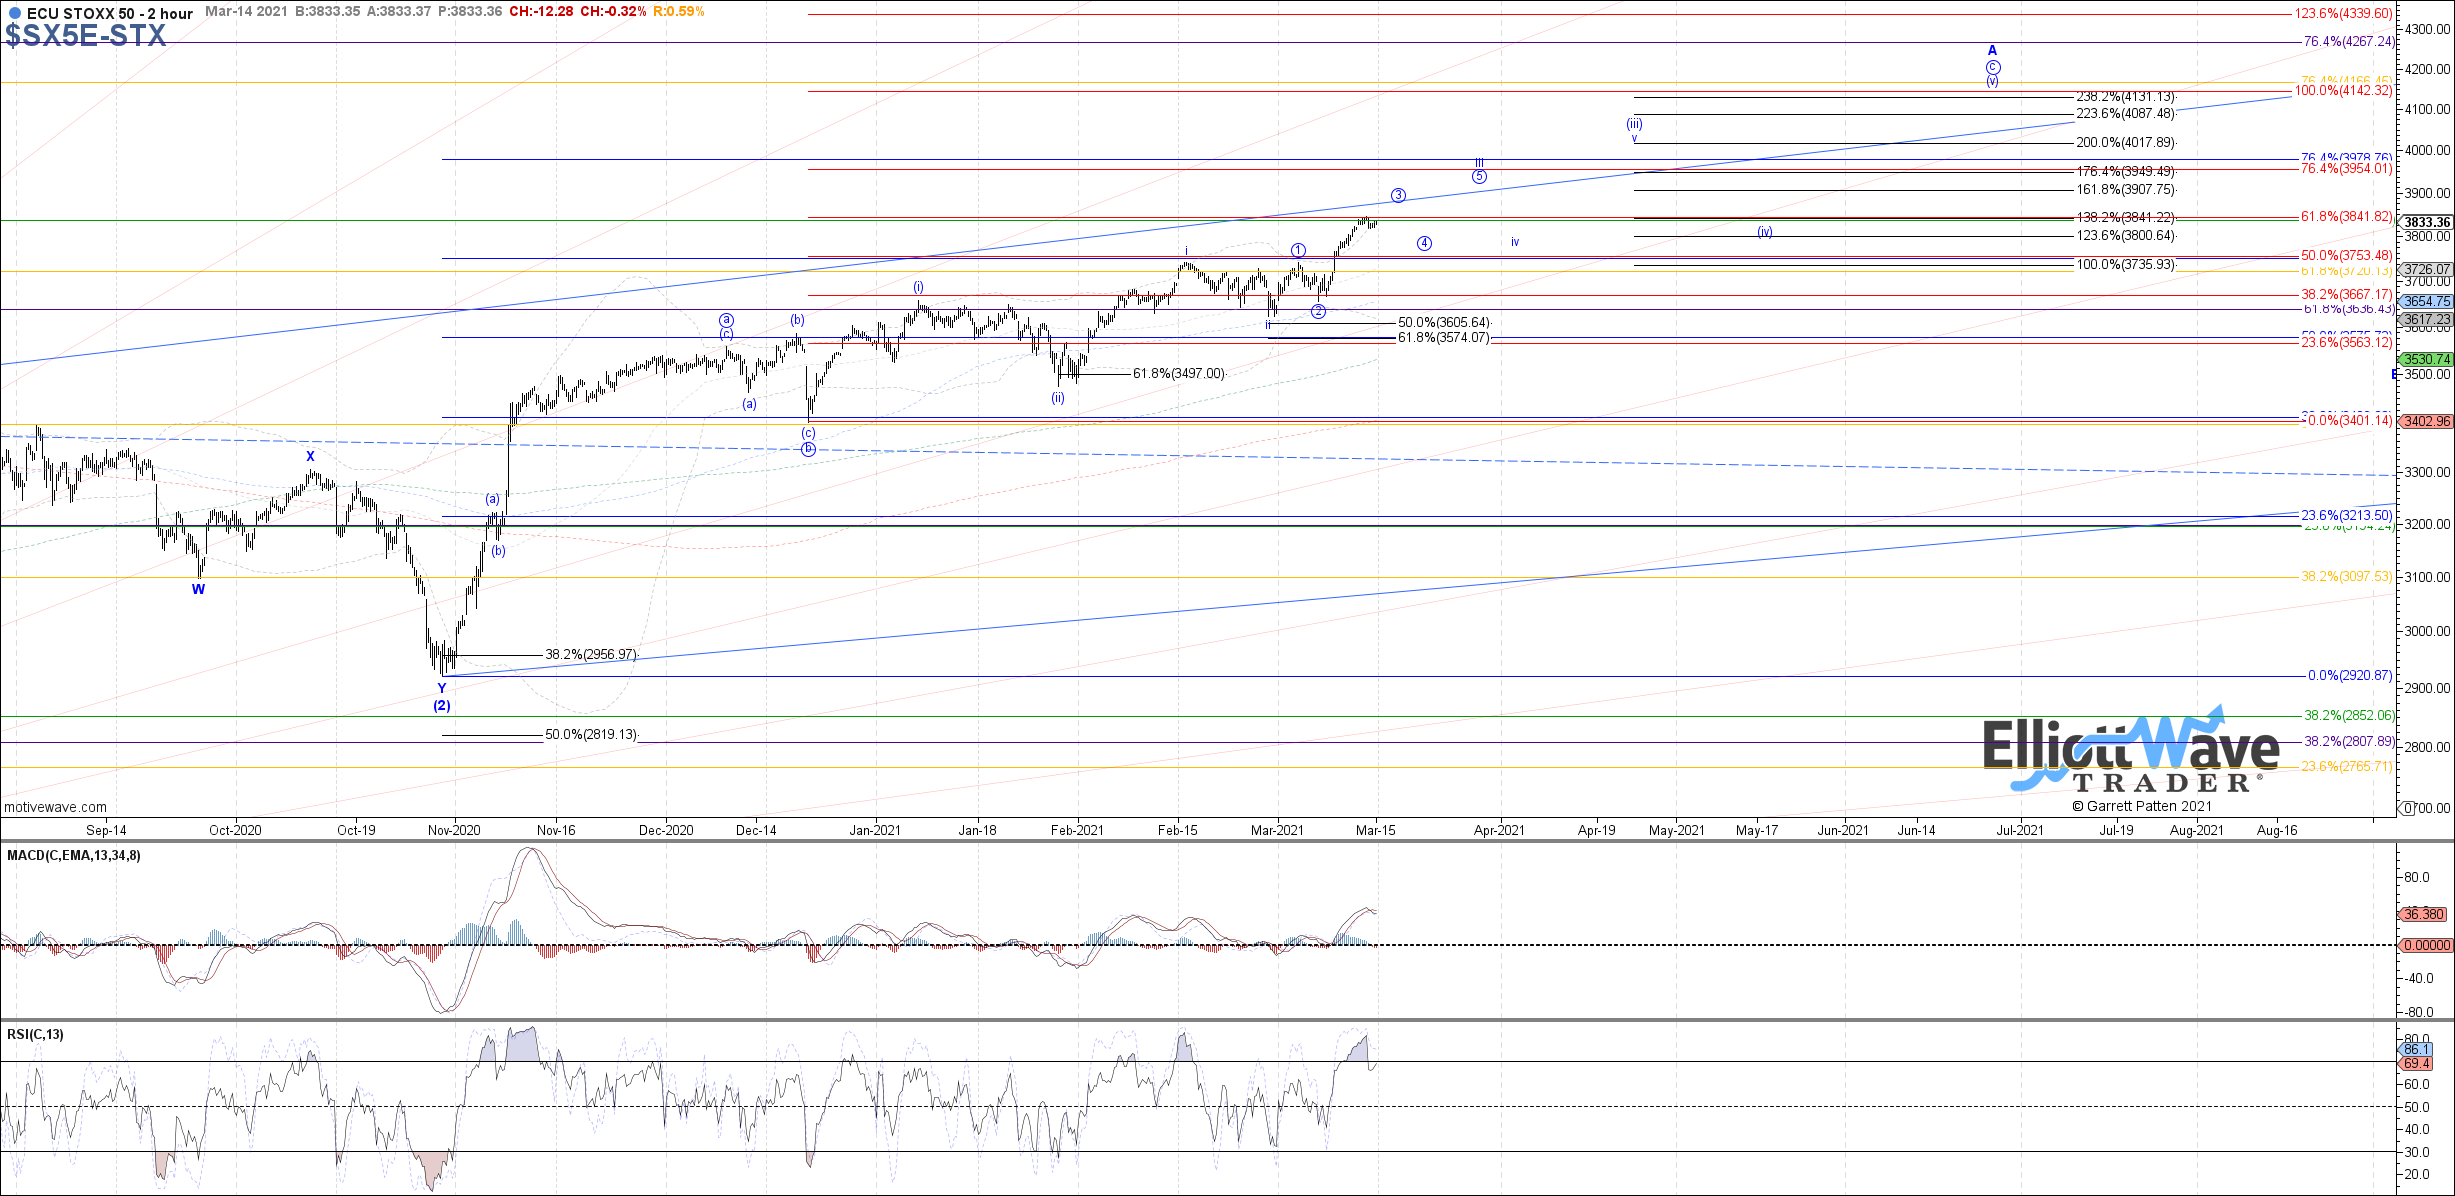
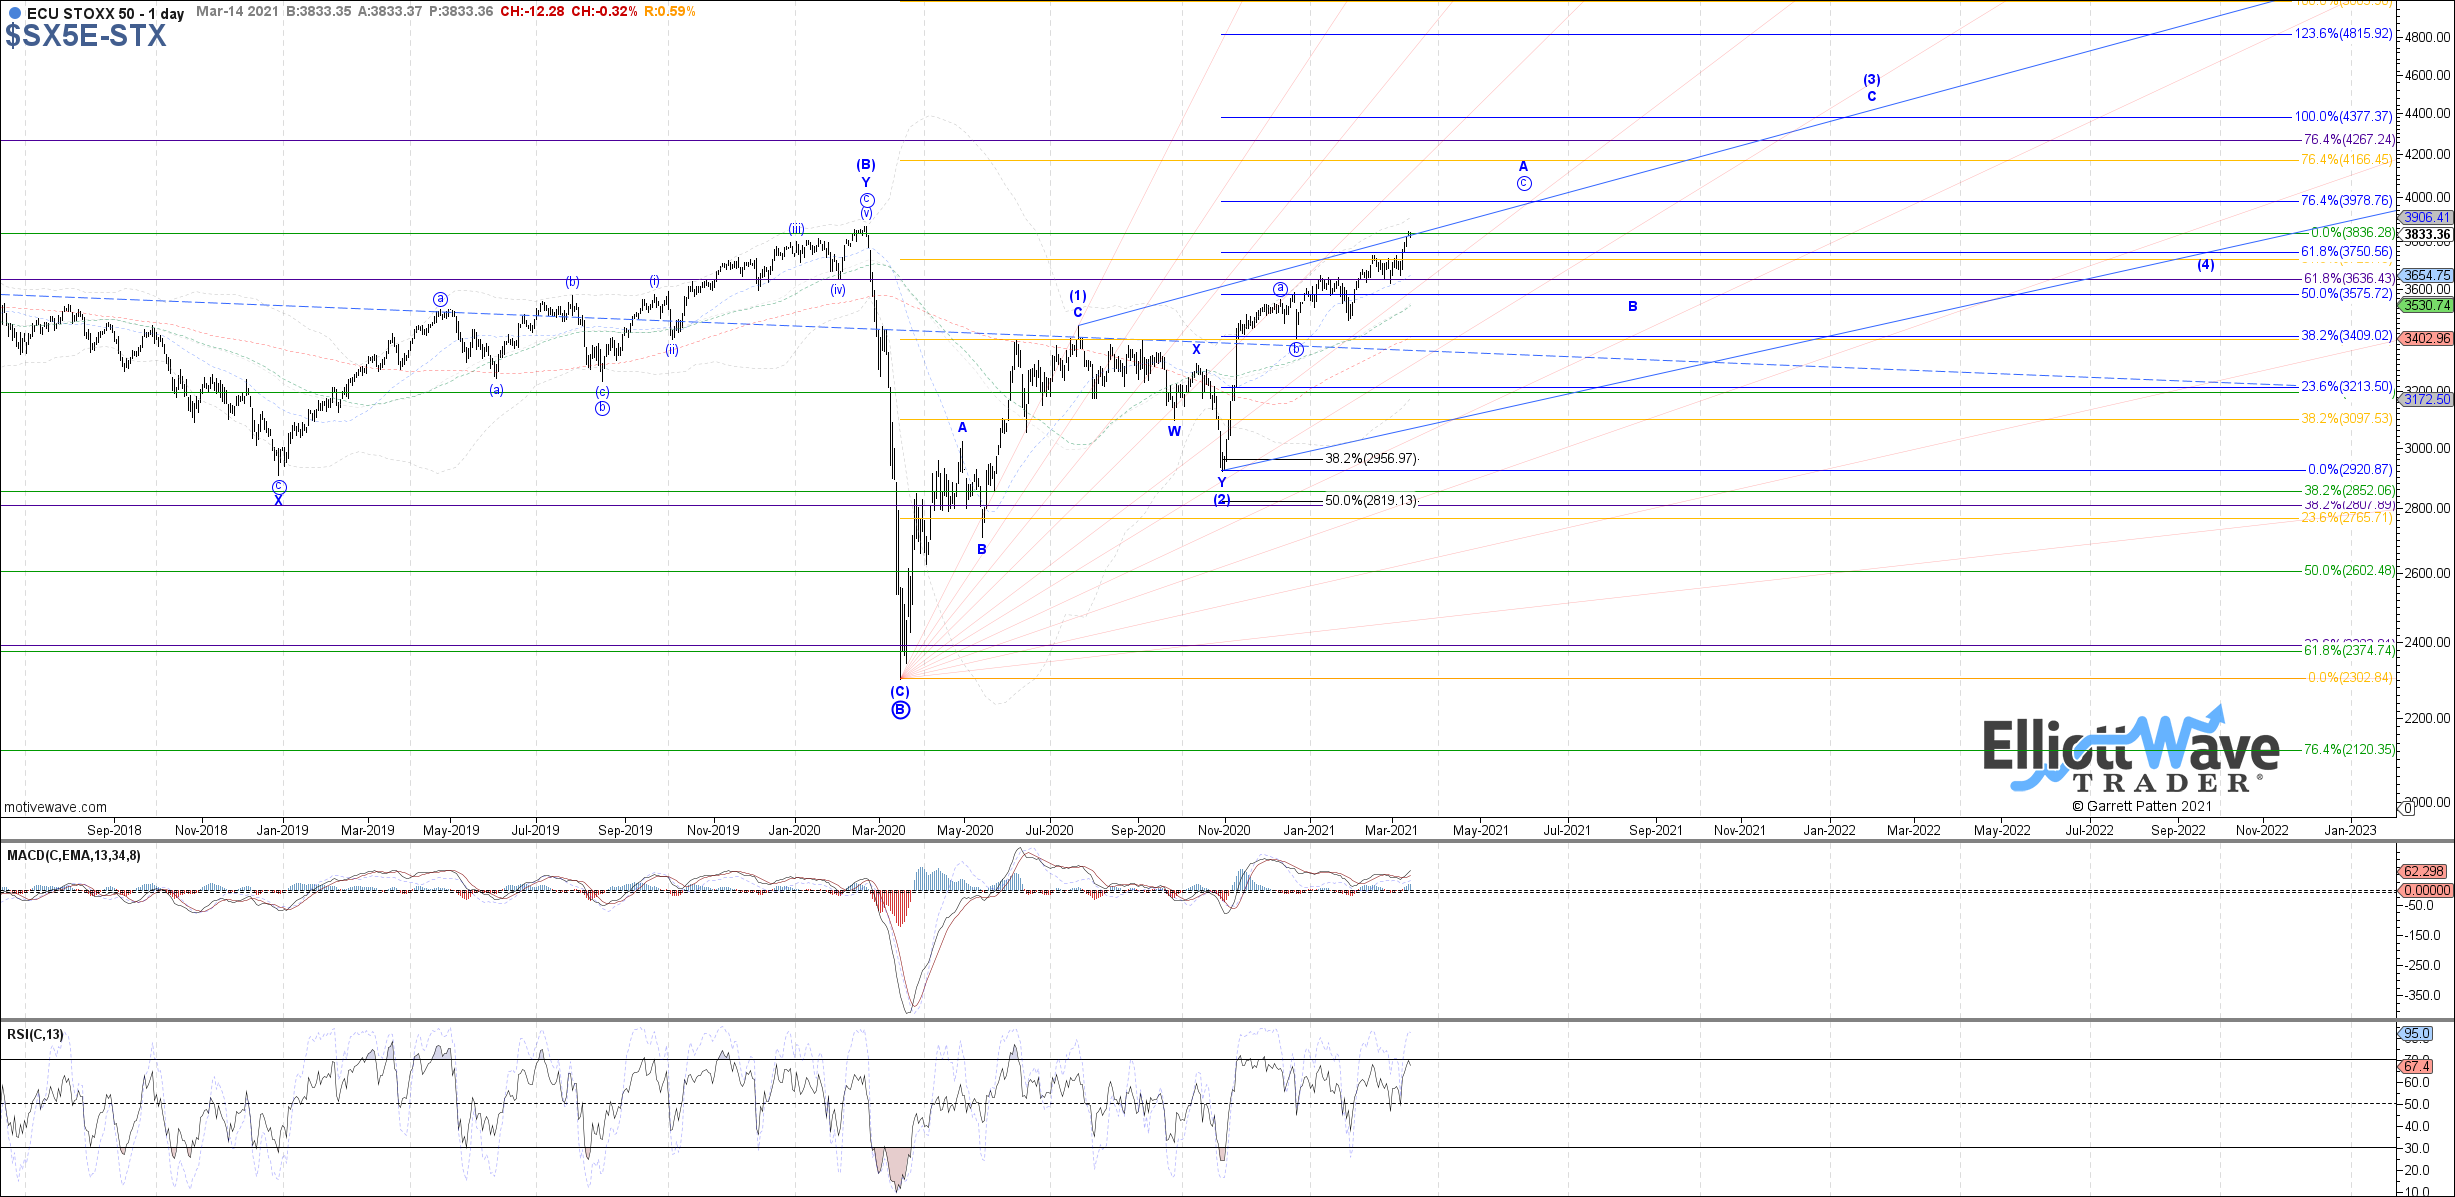
STOXX: The STOXX also traded strongly higher last week, breaking out above the prior high on the month and the February high like the DAX. Therefore, price is cooperating with expectations that wave 3 of iii is filling out, with 3855 as the ideal minimum target to reach in this case before price completes wave 3 of iii and consolidates in wave 4 of iii next. Overall, as long as price is above 3740, further upside can be expected.
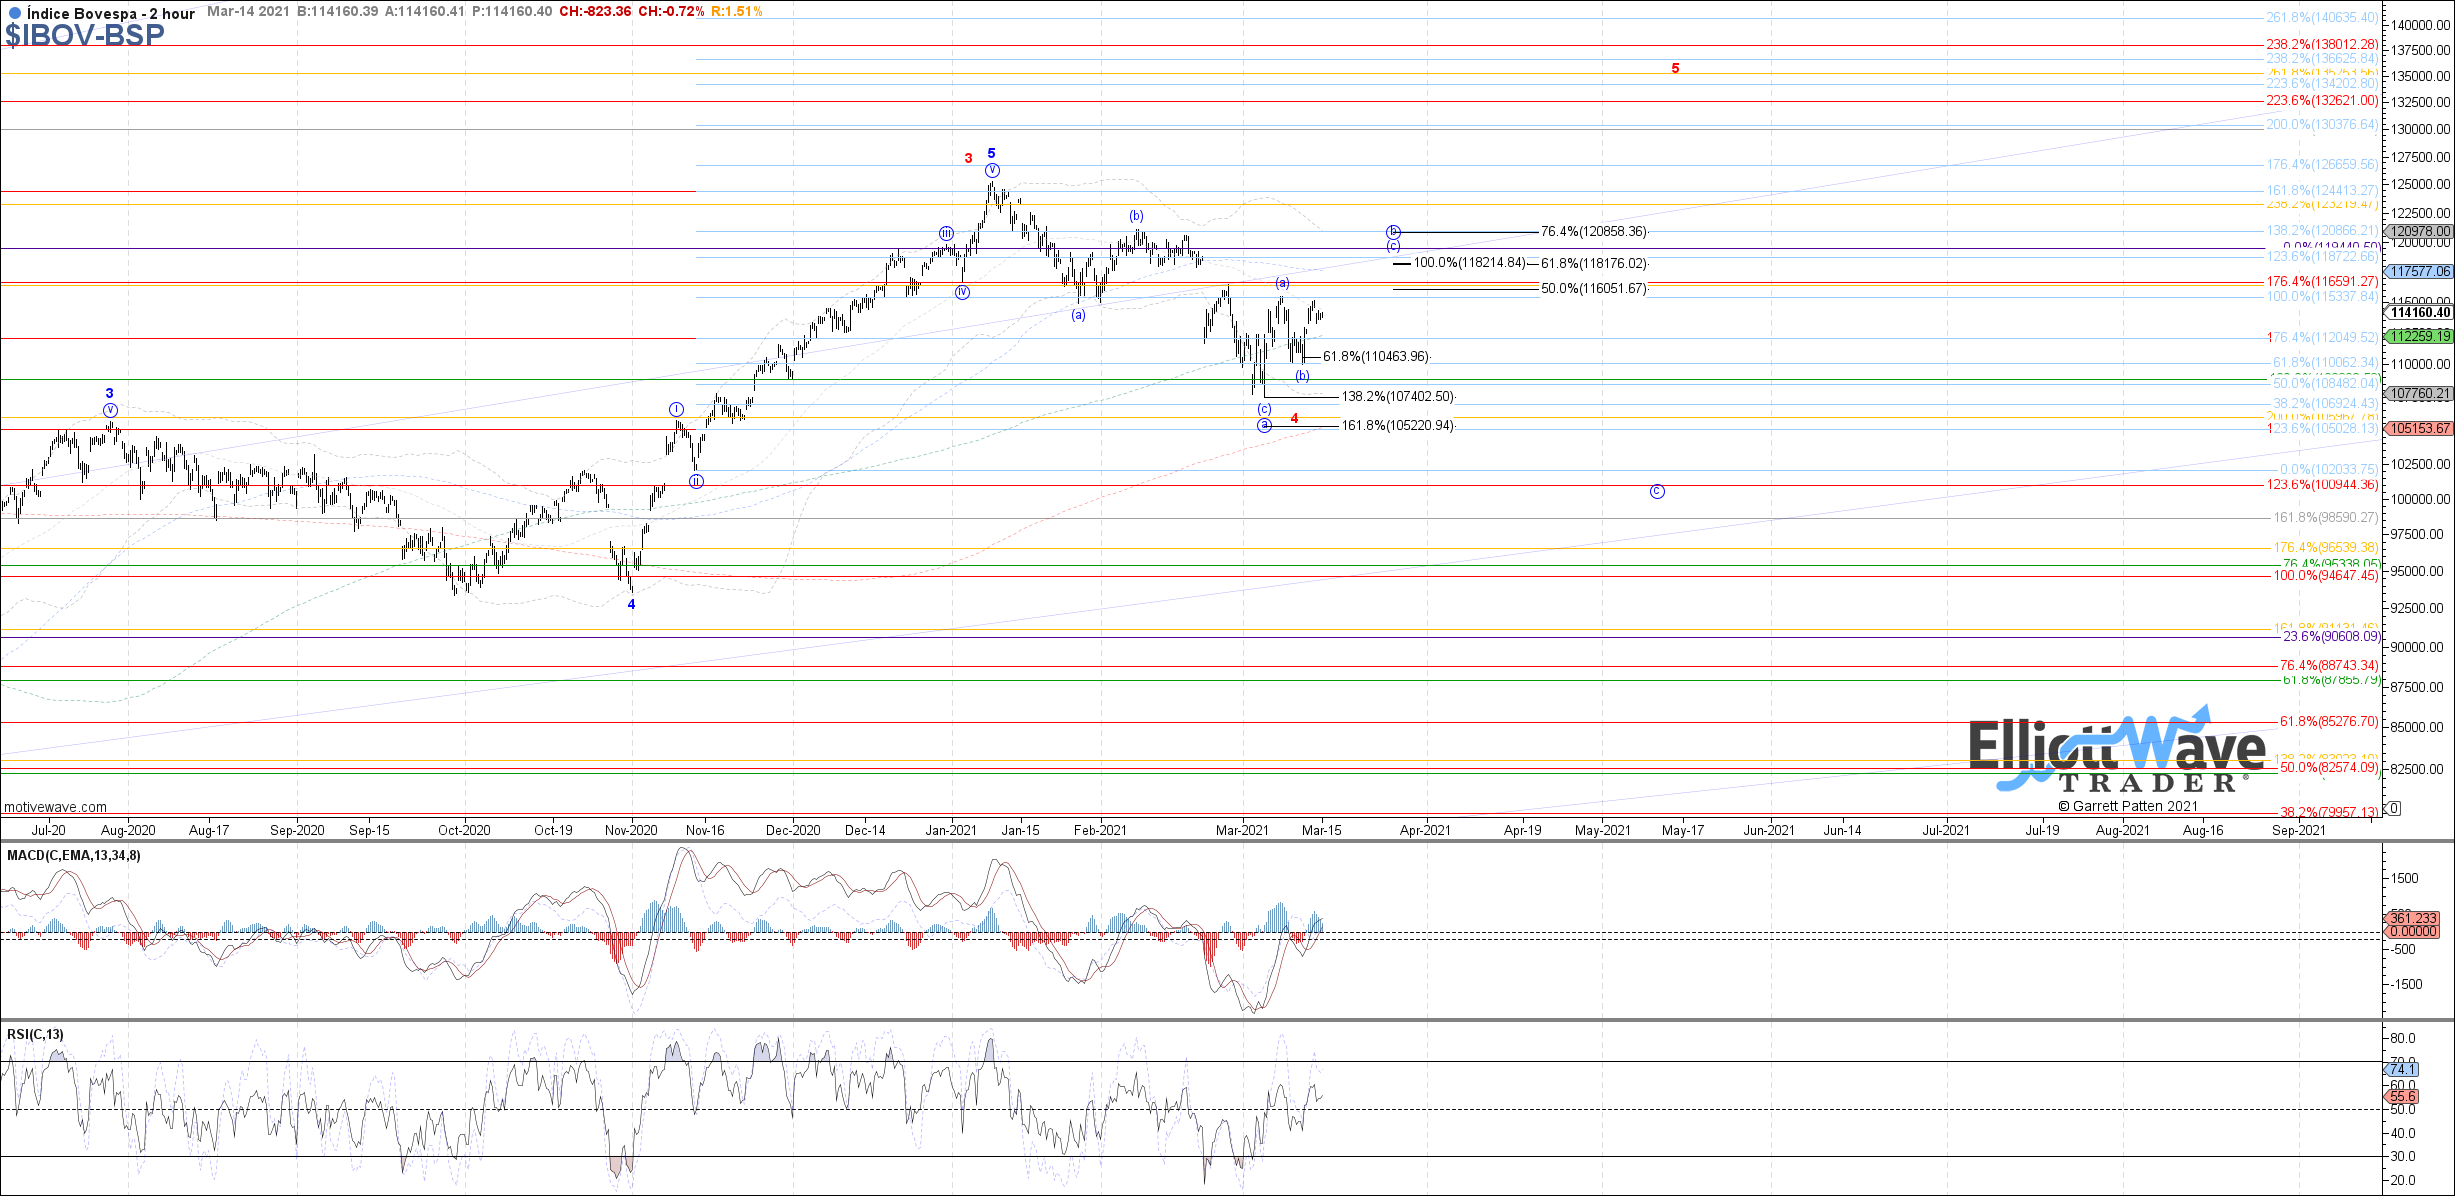
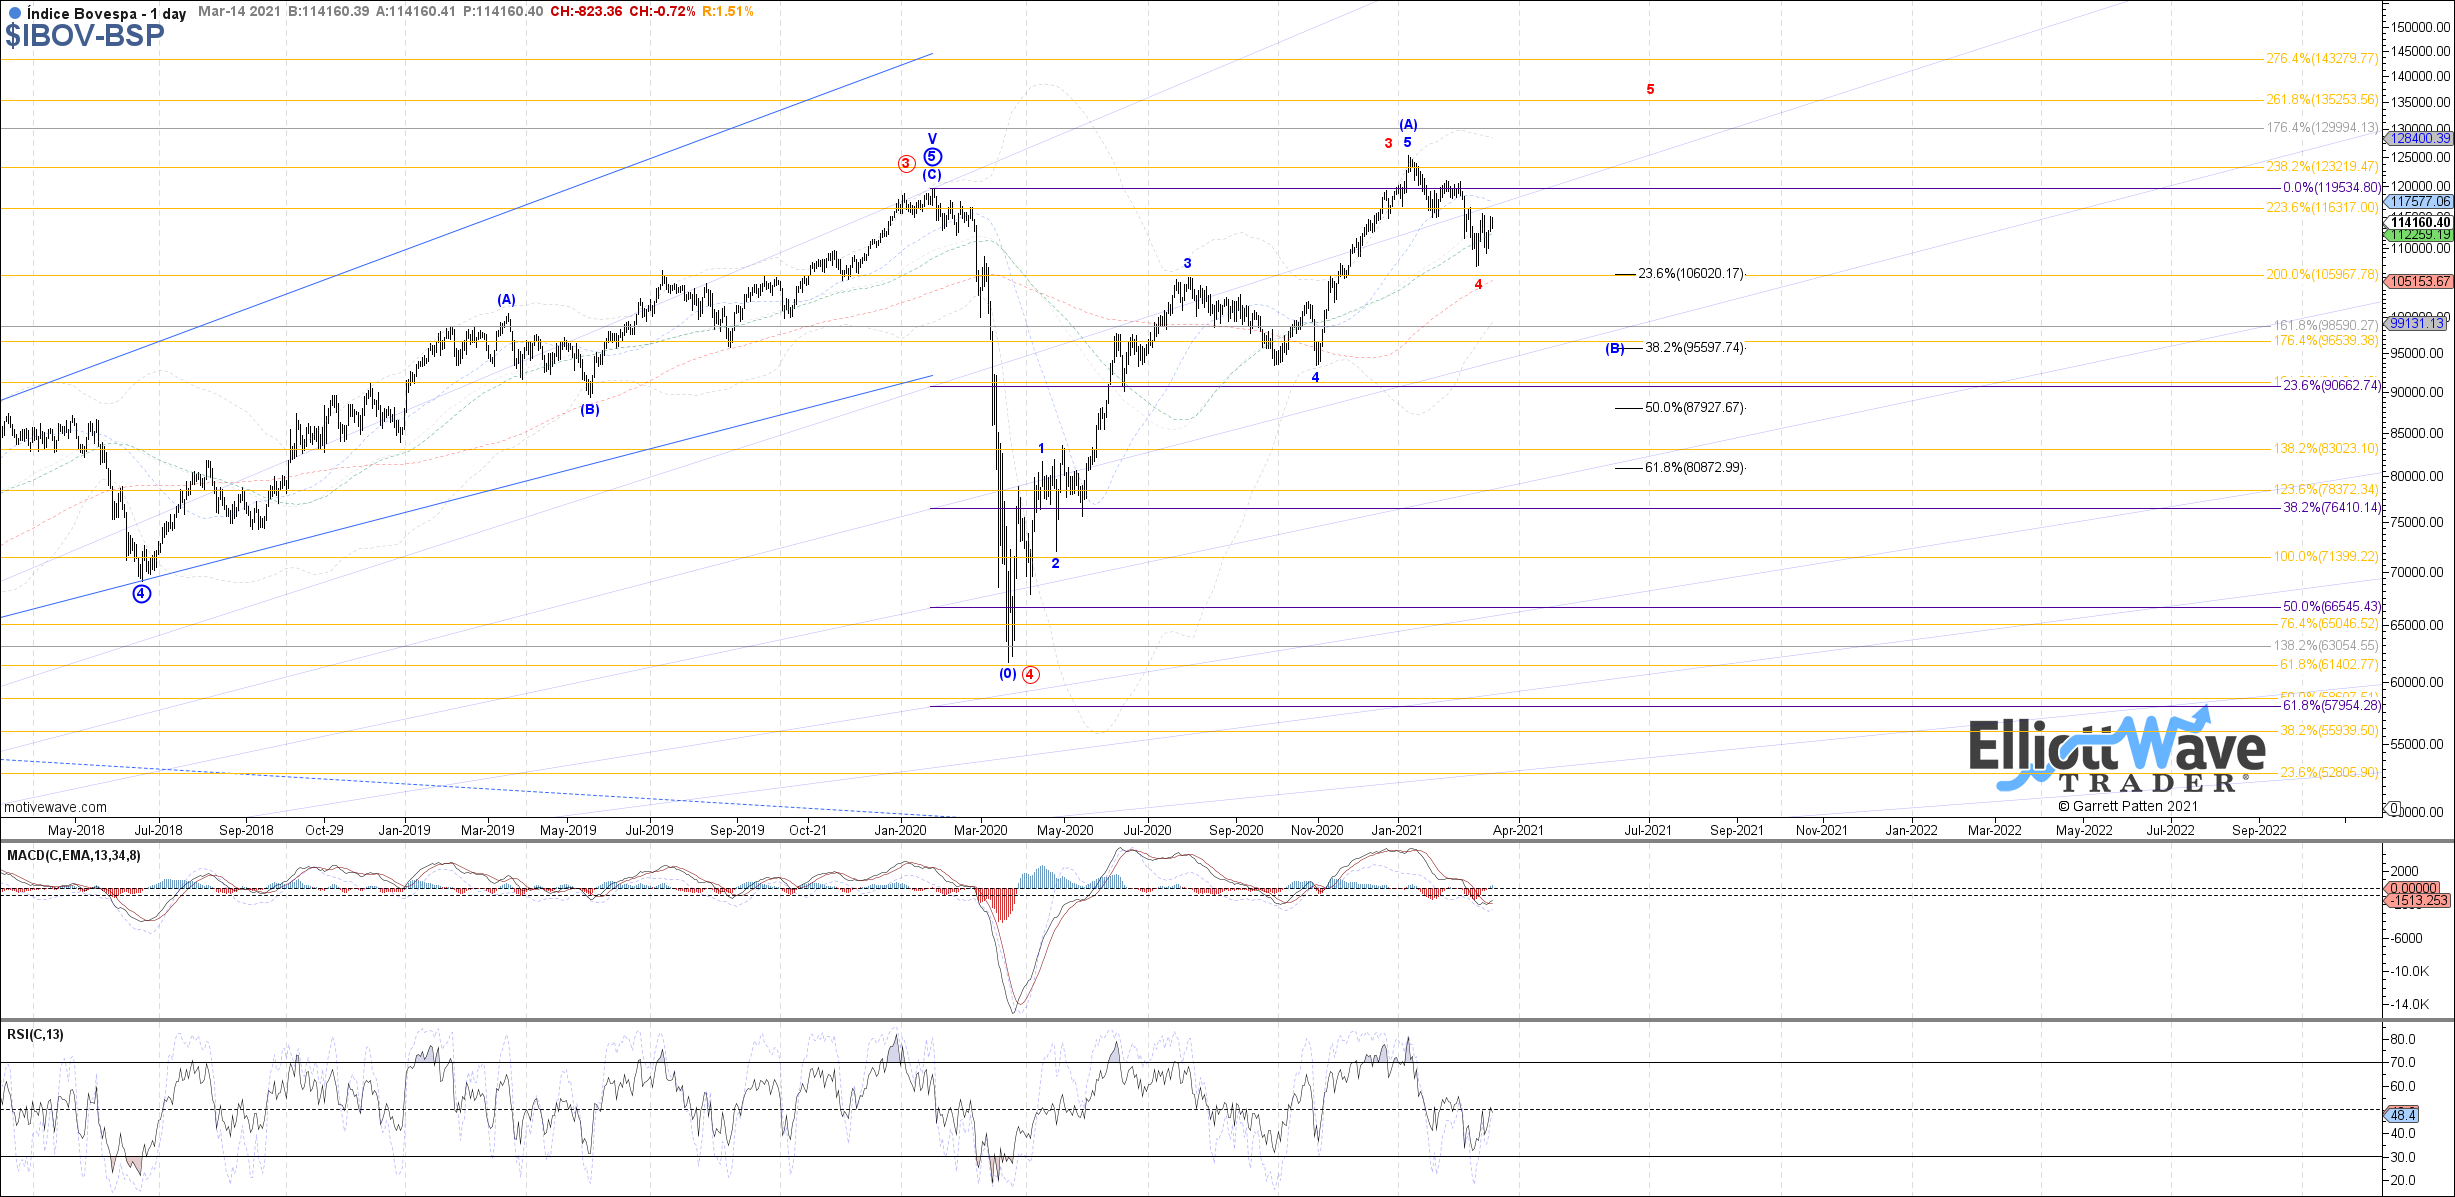
IBOV: The Bovespa started off initially lower last week, testing the .618 retrace of the bounce off the March low which has so far held. Price turned up from that support into Friday’s close, which can be viewed as the potential start to blue wave (c) of b. If so, then there is room for more near-term upside, with 118175 as the ideal target above as the .618 retrace and the (a)=(c) fib. Above there and 120860 would be the next fib resistance to watch, above which opens the door to a new high as red wave 5.
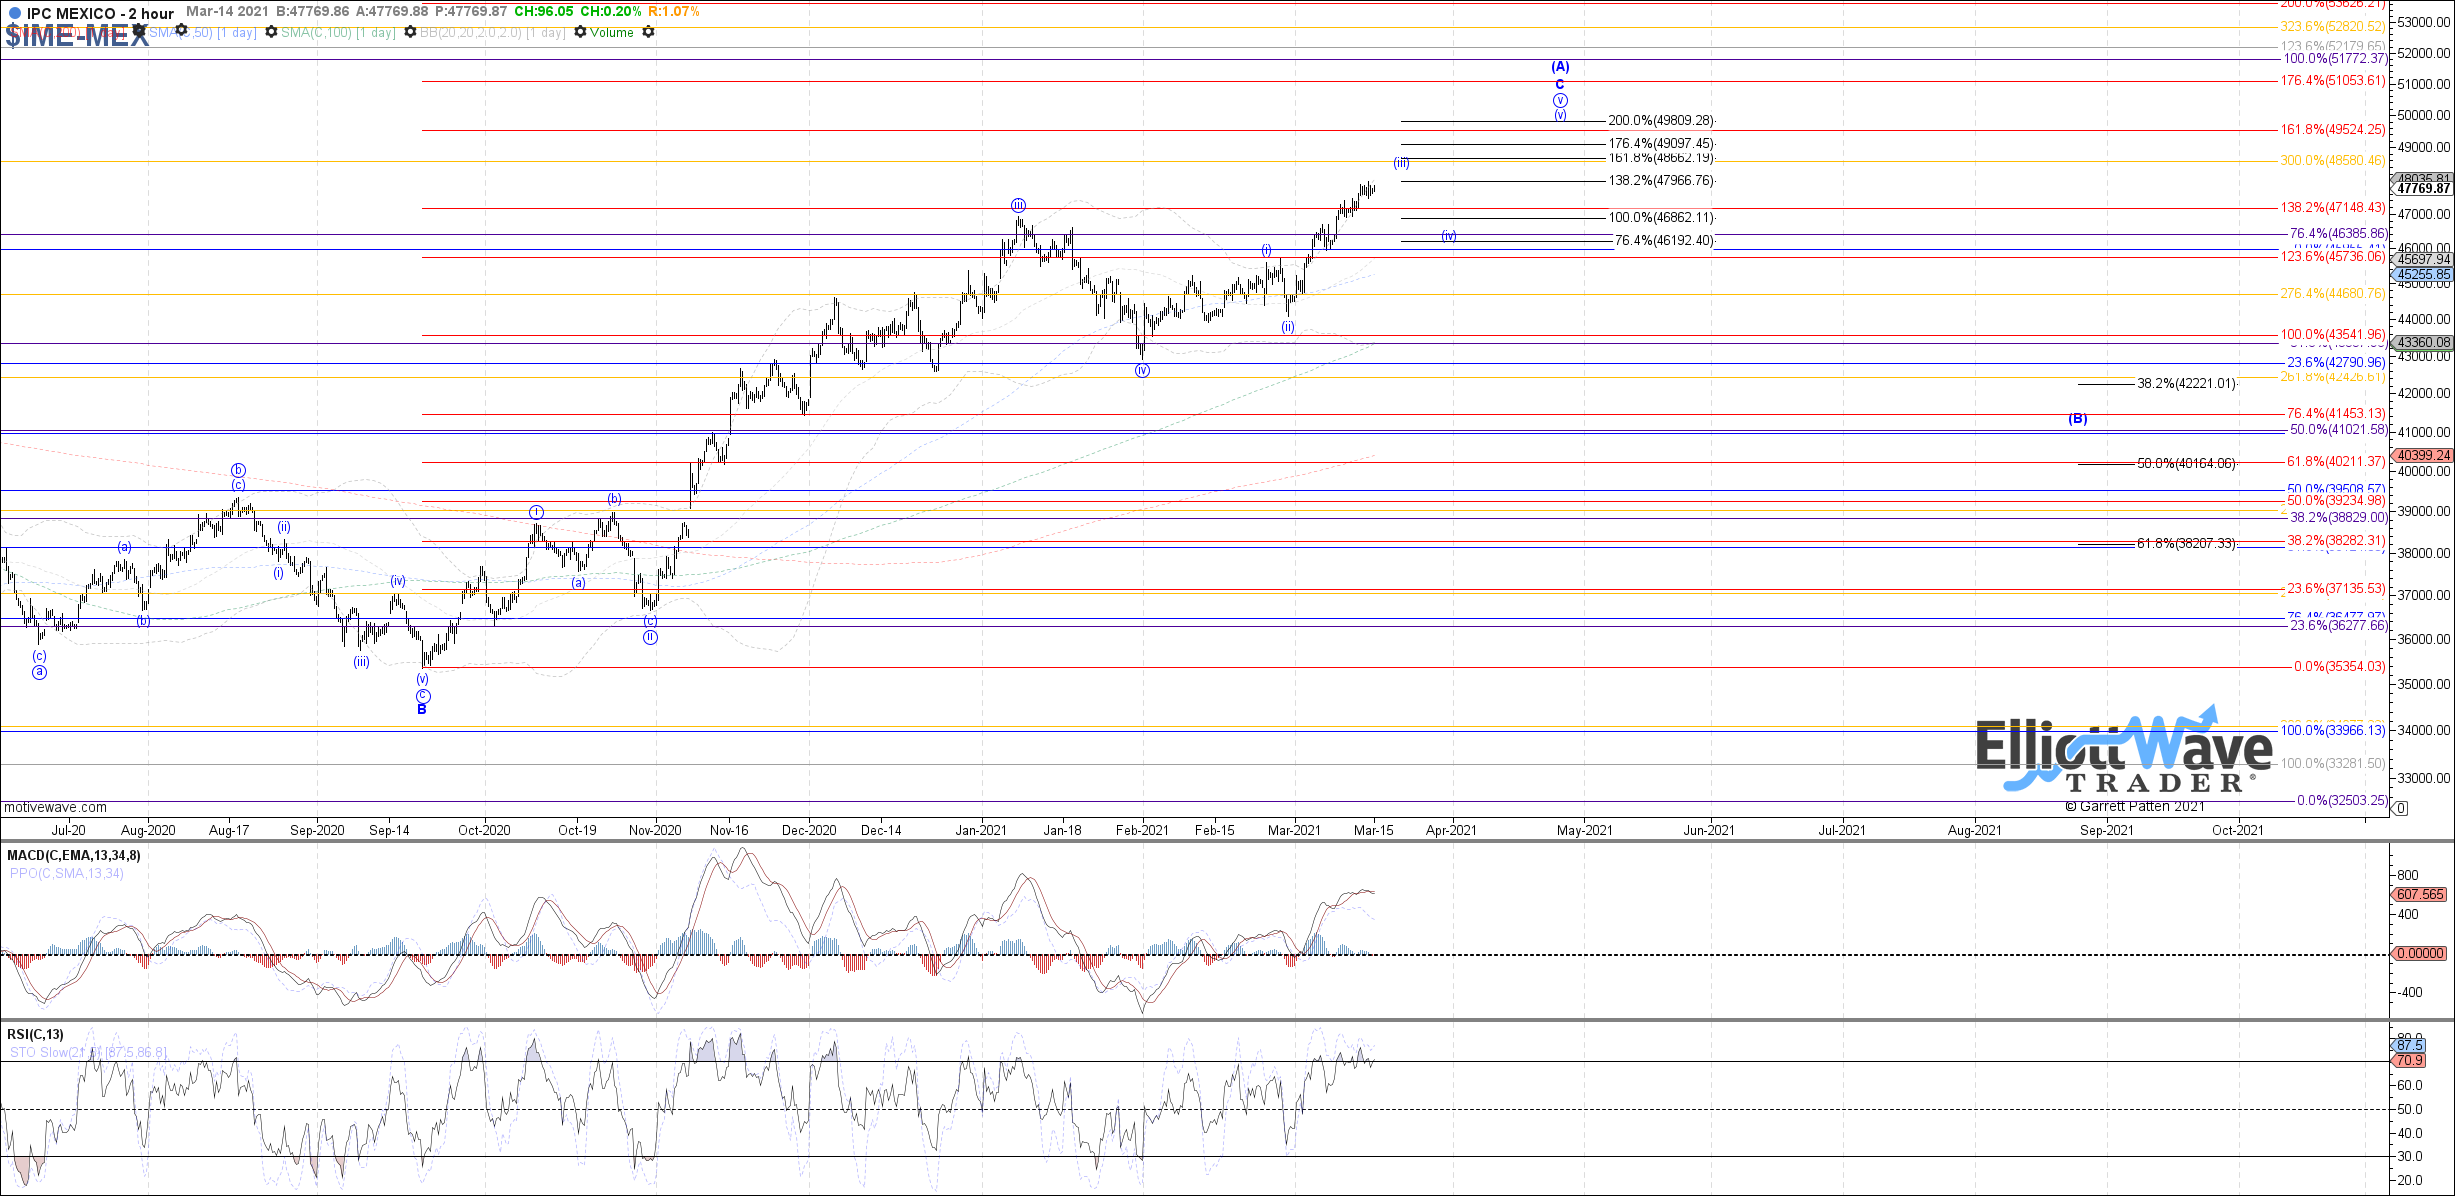
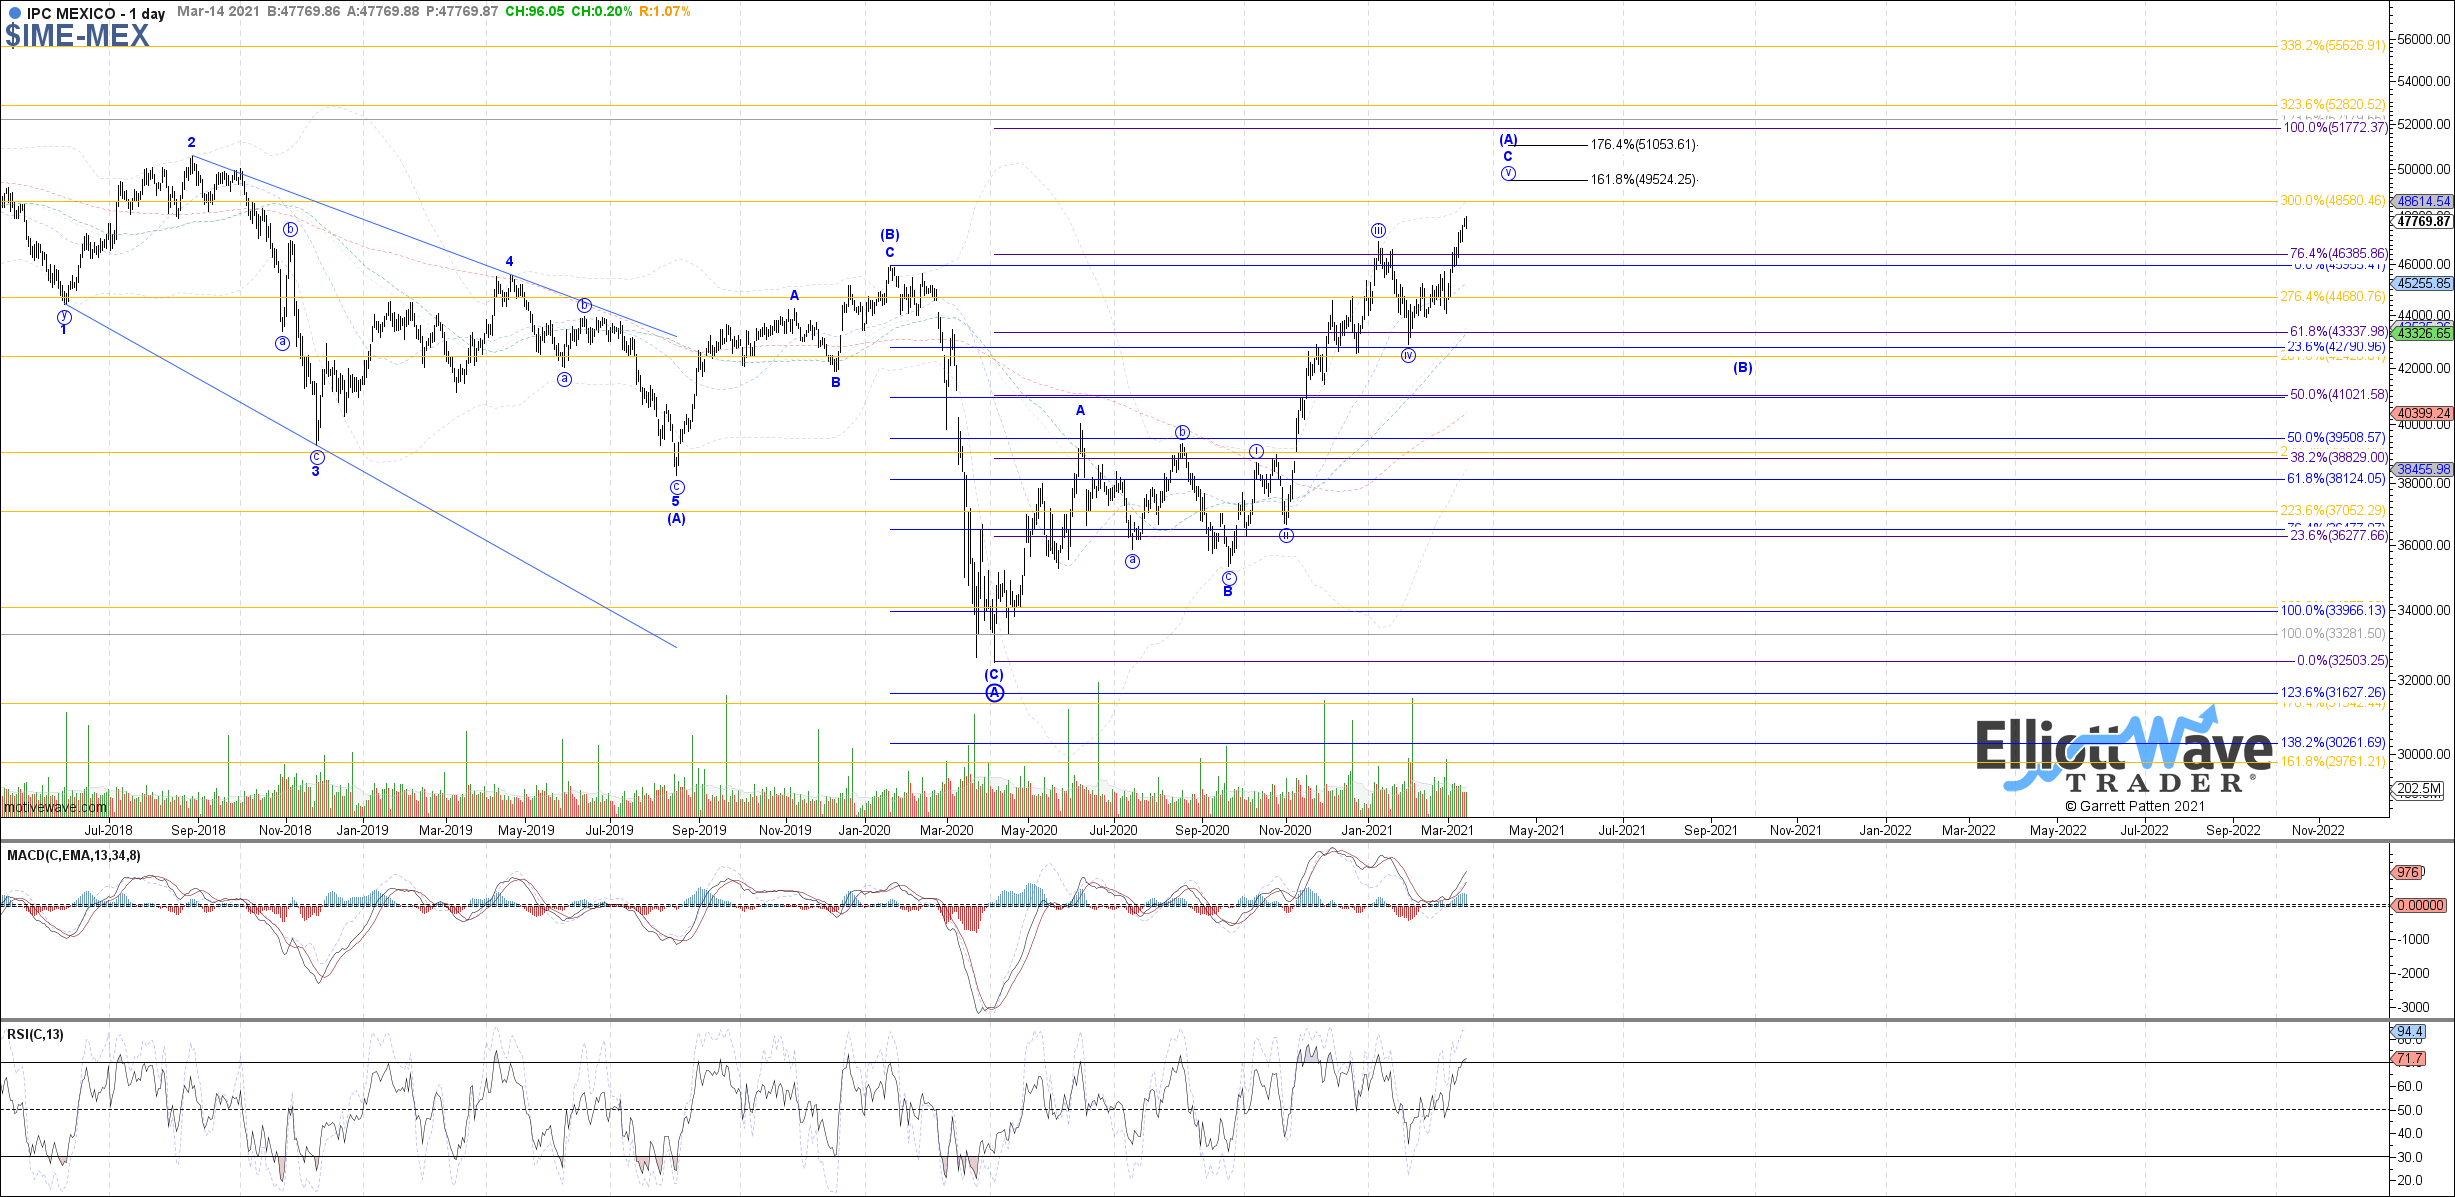
IPC: The IPC continued higher last week, ultimately exceeding the prior January high and therefore electing to follow the path as an extension of wave C of (A). 47965 – 48660 is near-term resistance to watch as a potential target for wave (iii) of v, which if holds can setup a consolidation next as wave (iv) of v with 46860 – 46190 as support. Price would need to break below there to suggest a more significant top in place.