World Markets Report - Europe/Americas: Holding A Higher Low
 By
By
EUROPE/AMERICAS
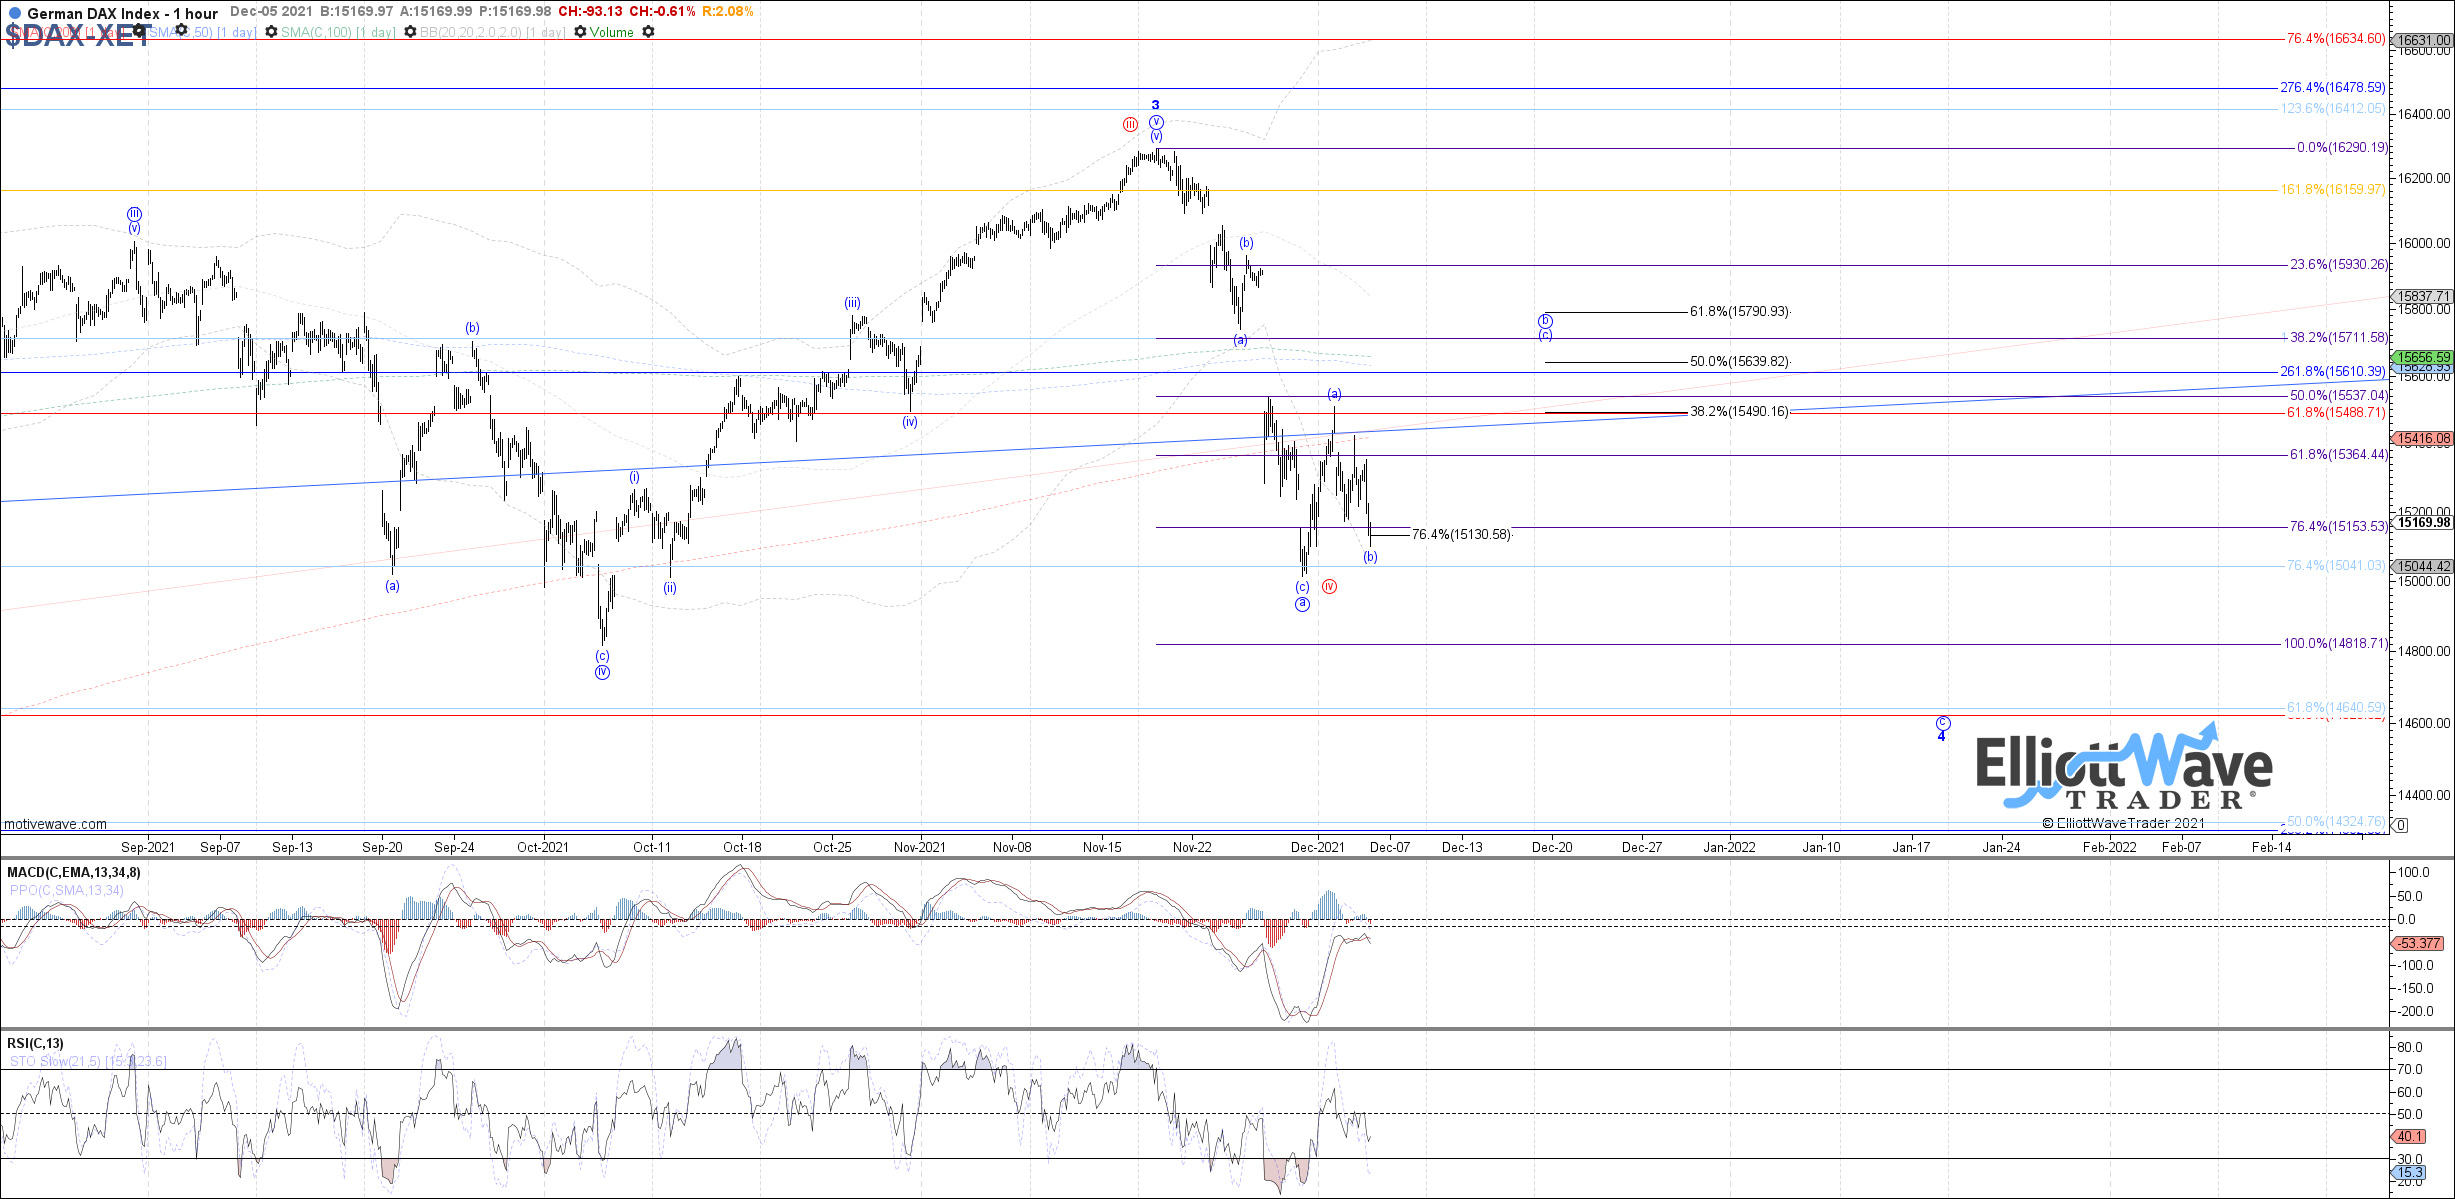
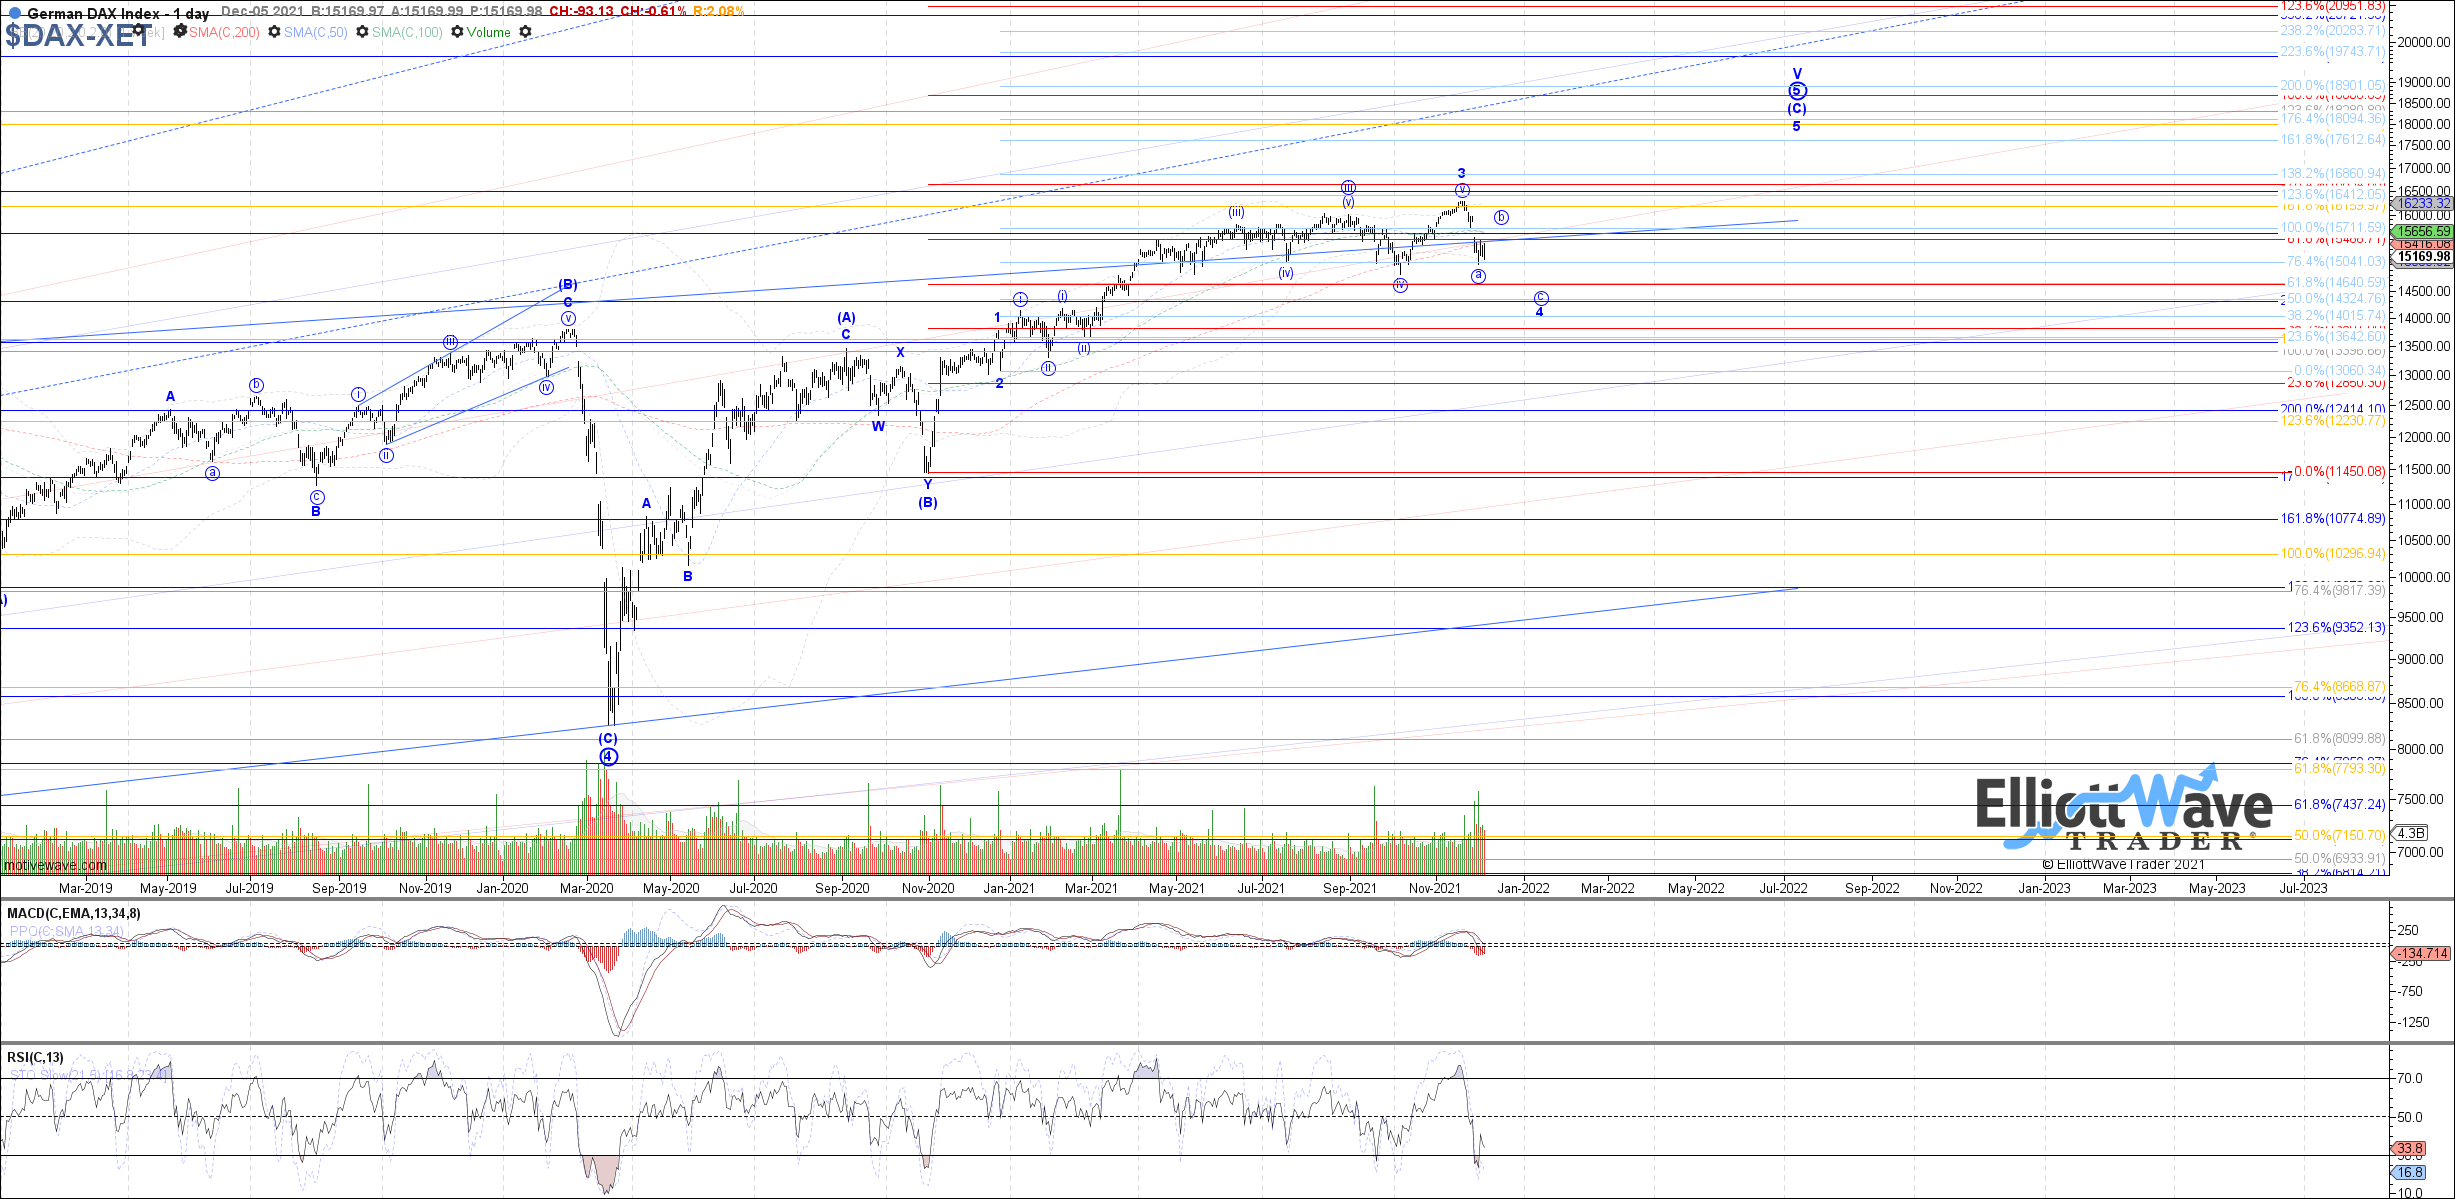
DAX: The DAX continued to stretch lower initially last week, but managed to get a decent bounce mid-week and so far is trying to hold a higher low. Therefore, ideally last week’s low completed at least an a-wave down within the blue count, and can try for more near-term upside in a wider flat b-wave with 15640 – 15790 as the next fib resistance above. Otherwise, the alternative if price drops directly back below last week’s low from here would be either an extension of blue wave a or red wave iv, and potentially even the start to blue wave c already.
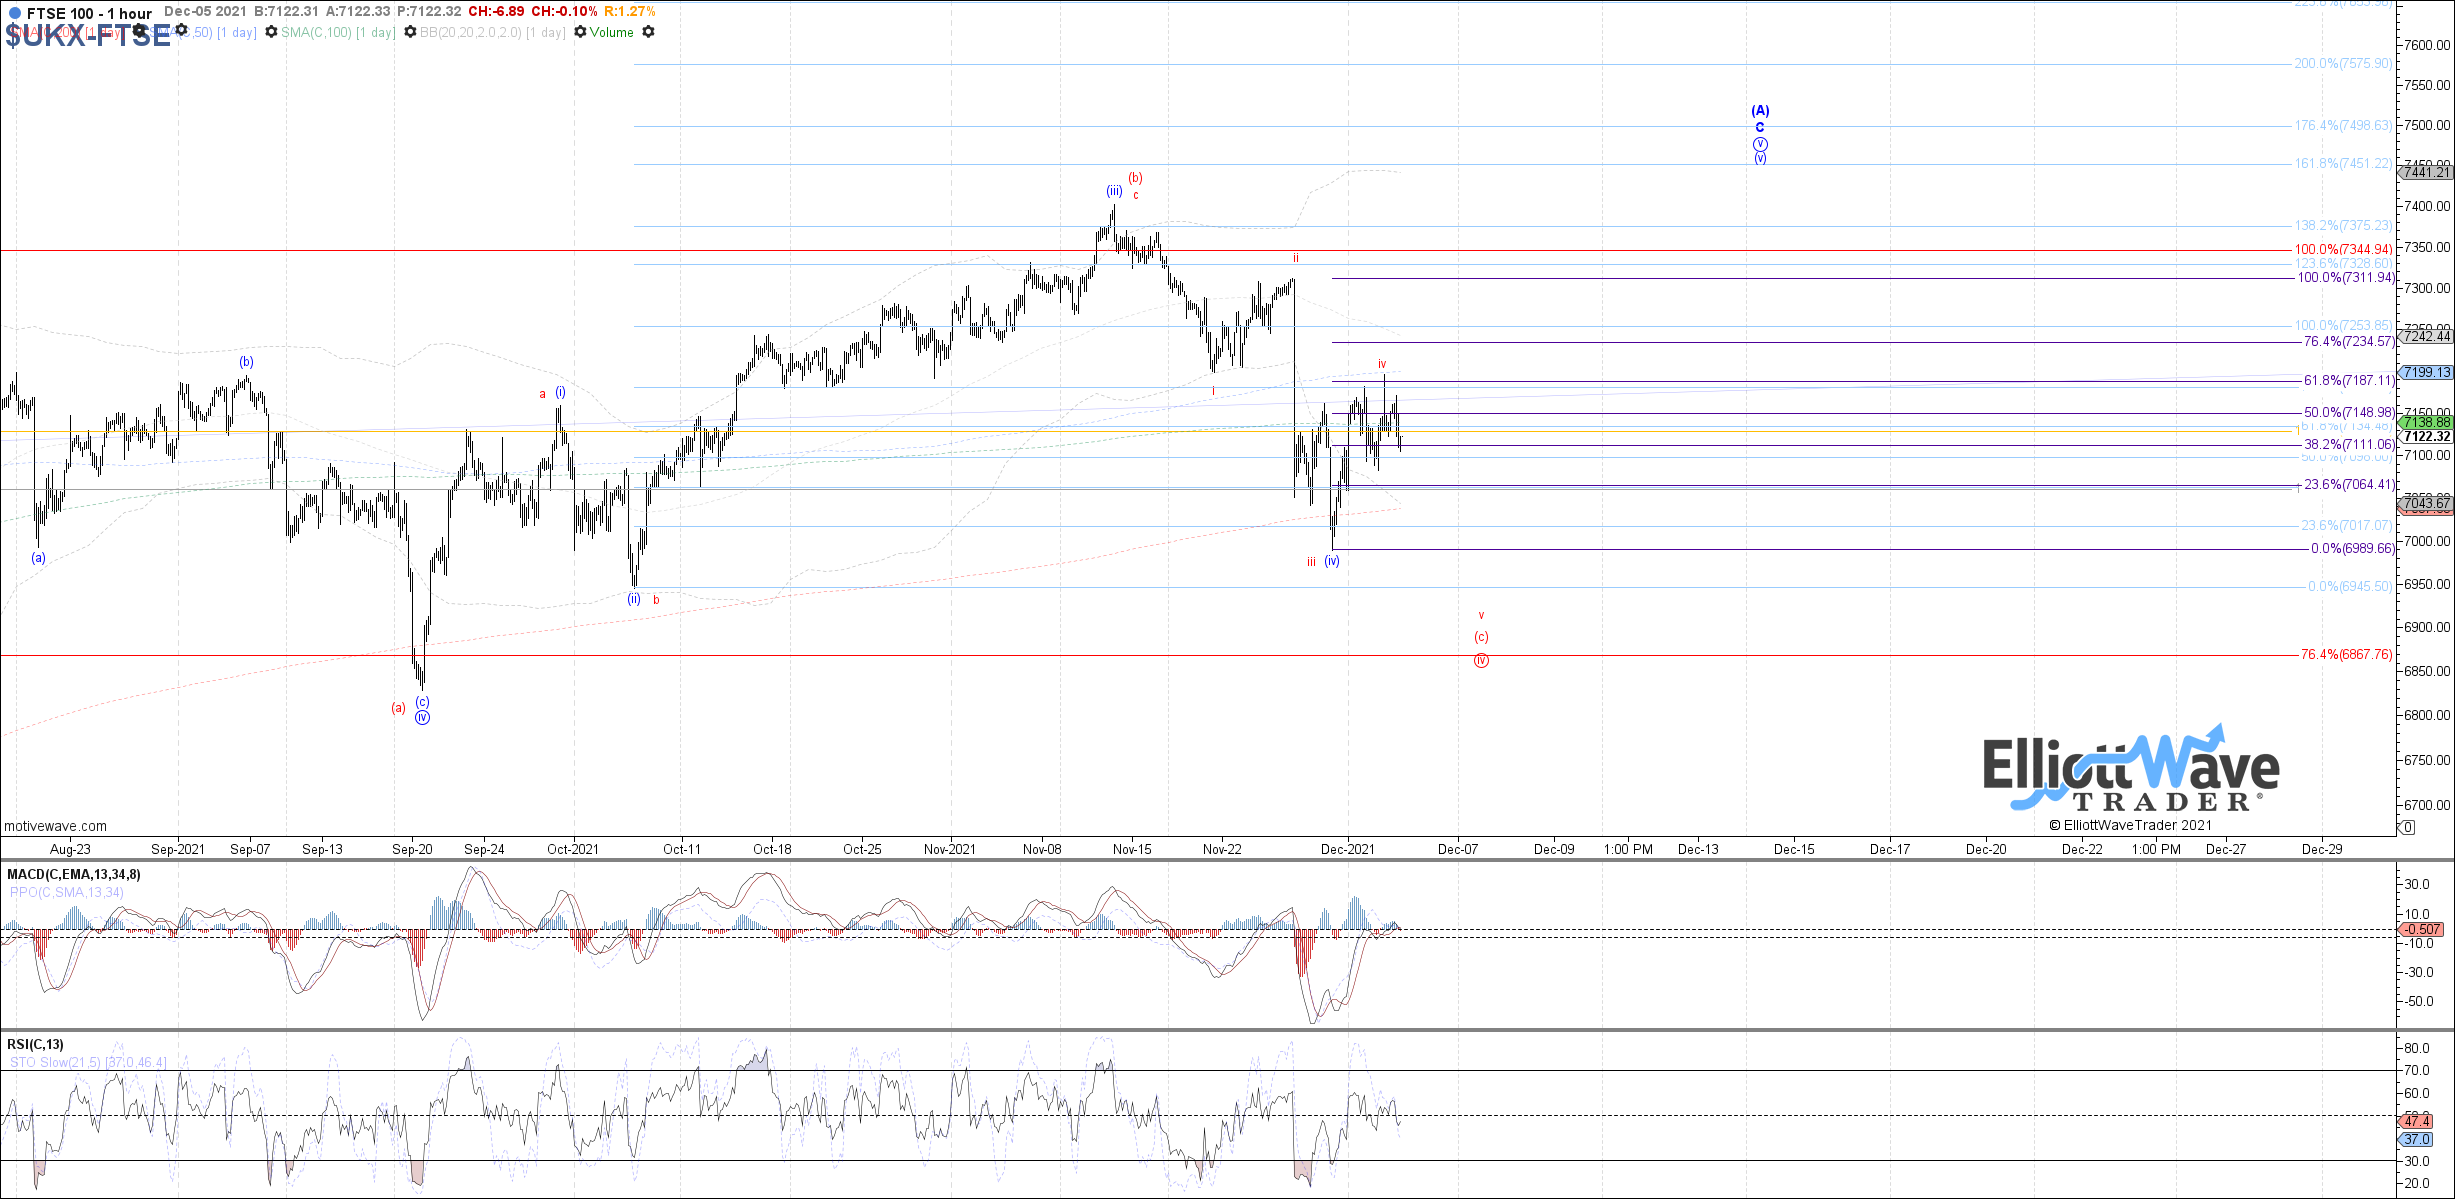
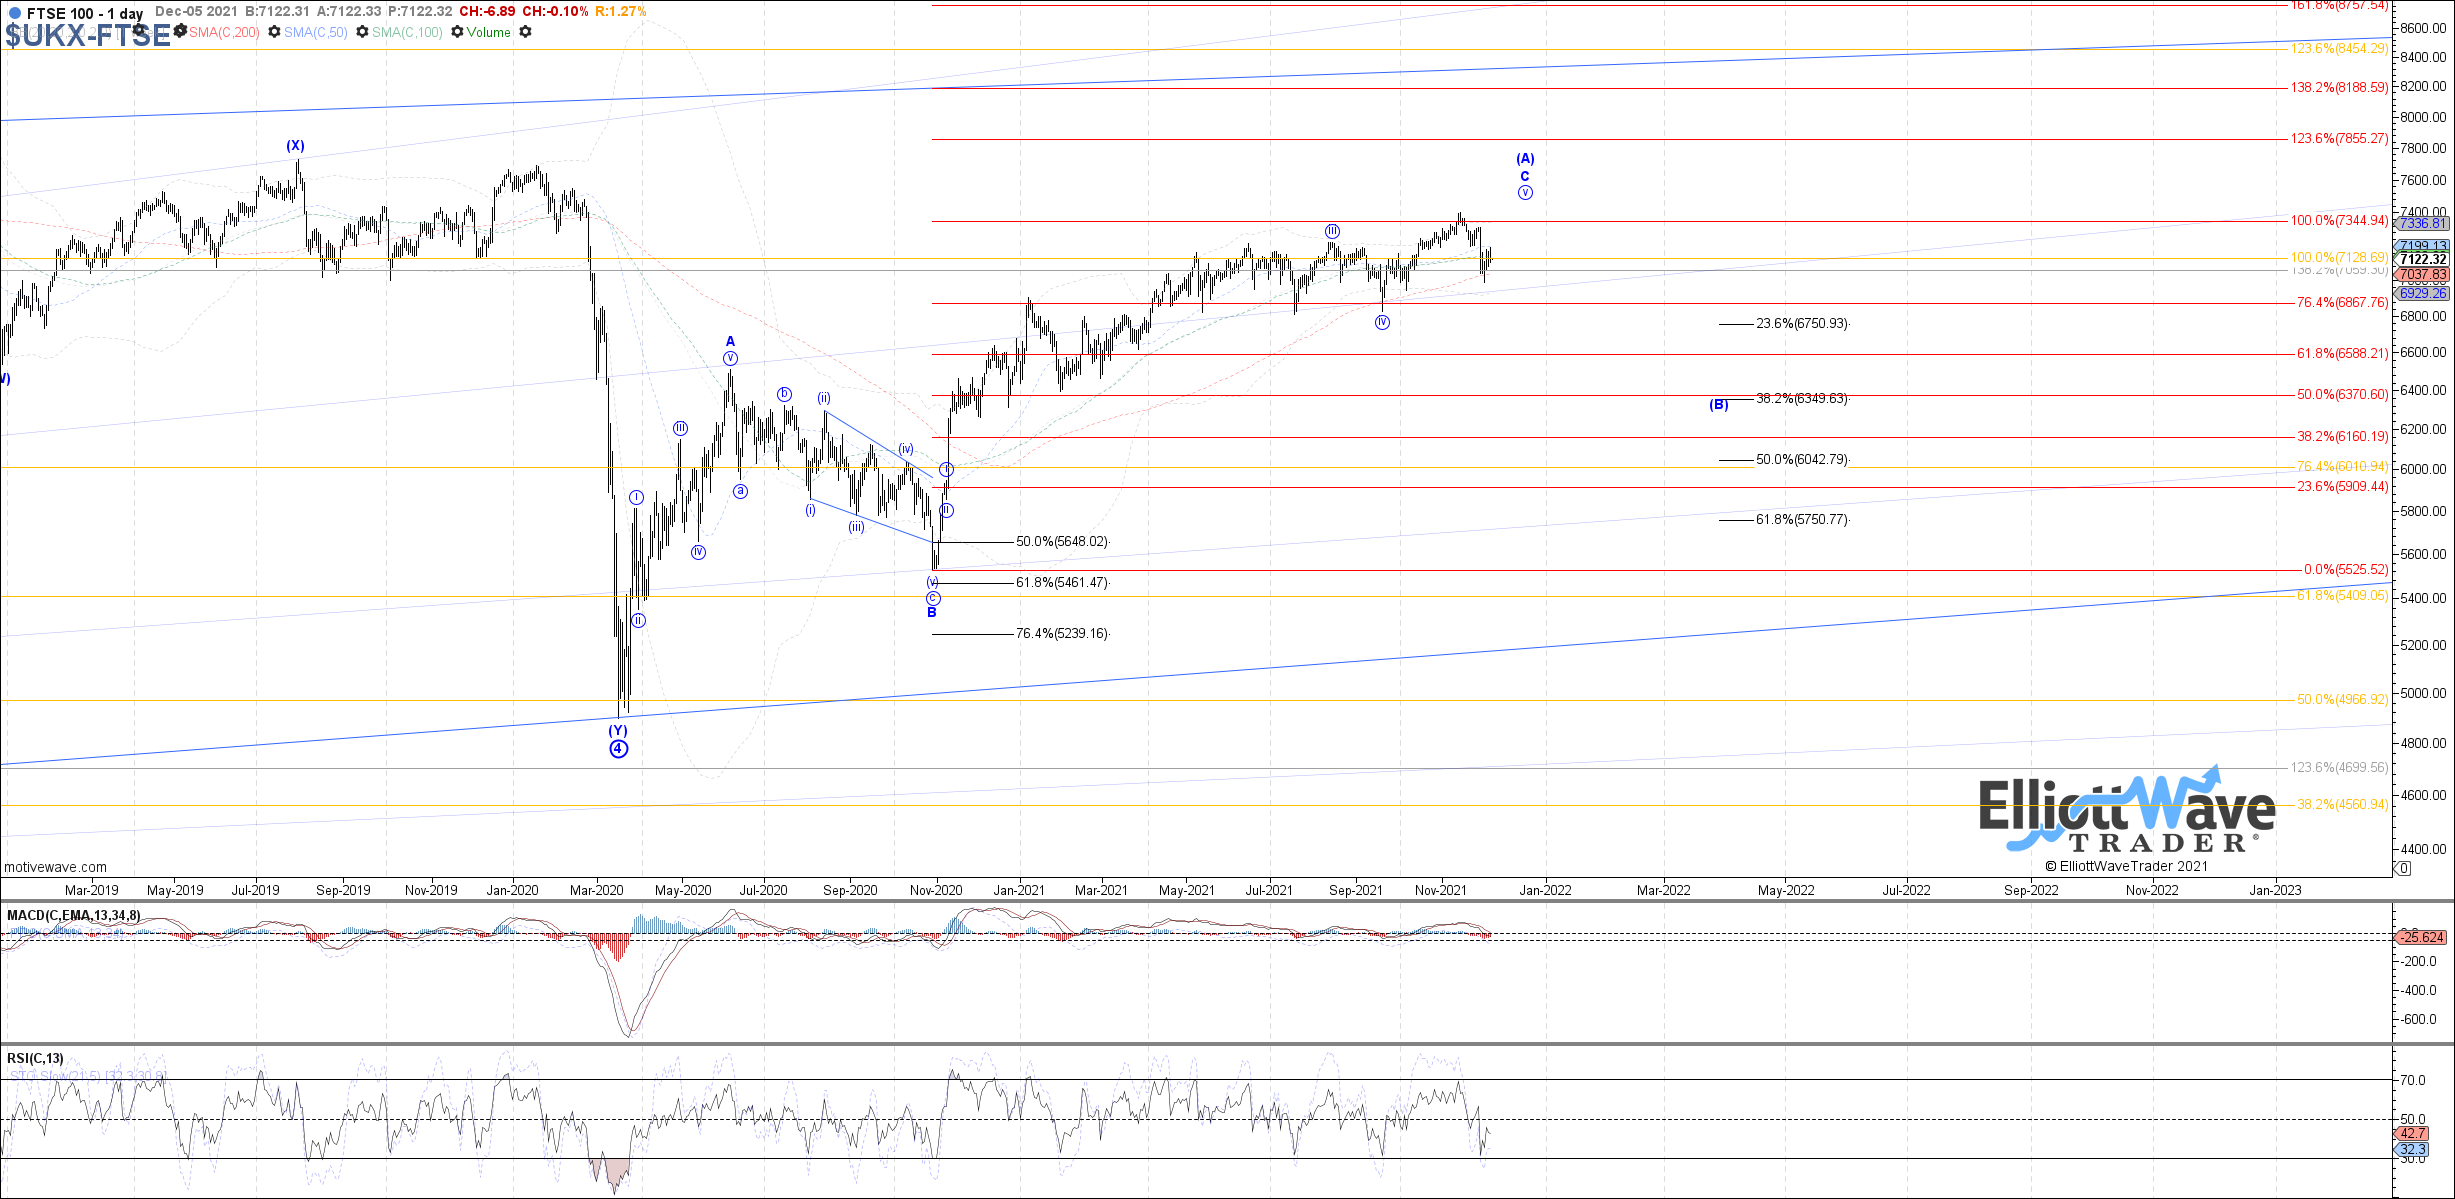
FTSE: The FTSE continued initially lower last week as well, but then proceeded to bounce during the second half of last week and is currently holding up even a bit better relative to the DAX going into Friday’s close. Therefore, odds for the potential that price attempts more near-term upside looks reasonably favorable, which should at least lead to a test of the next fib resistance at 7235 as the .764 retrace. Beyond there and a new high as blue wave (v) becomes a possibility. The bearish alternative is that price is turned directly down to a new low from here as red wave v of (c), but would need to get below 7065 to start favoring that path.
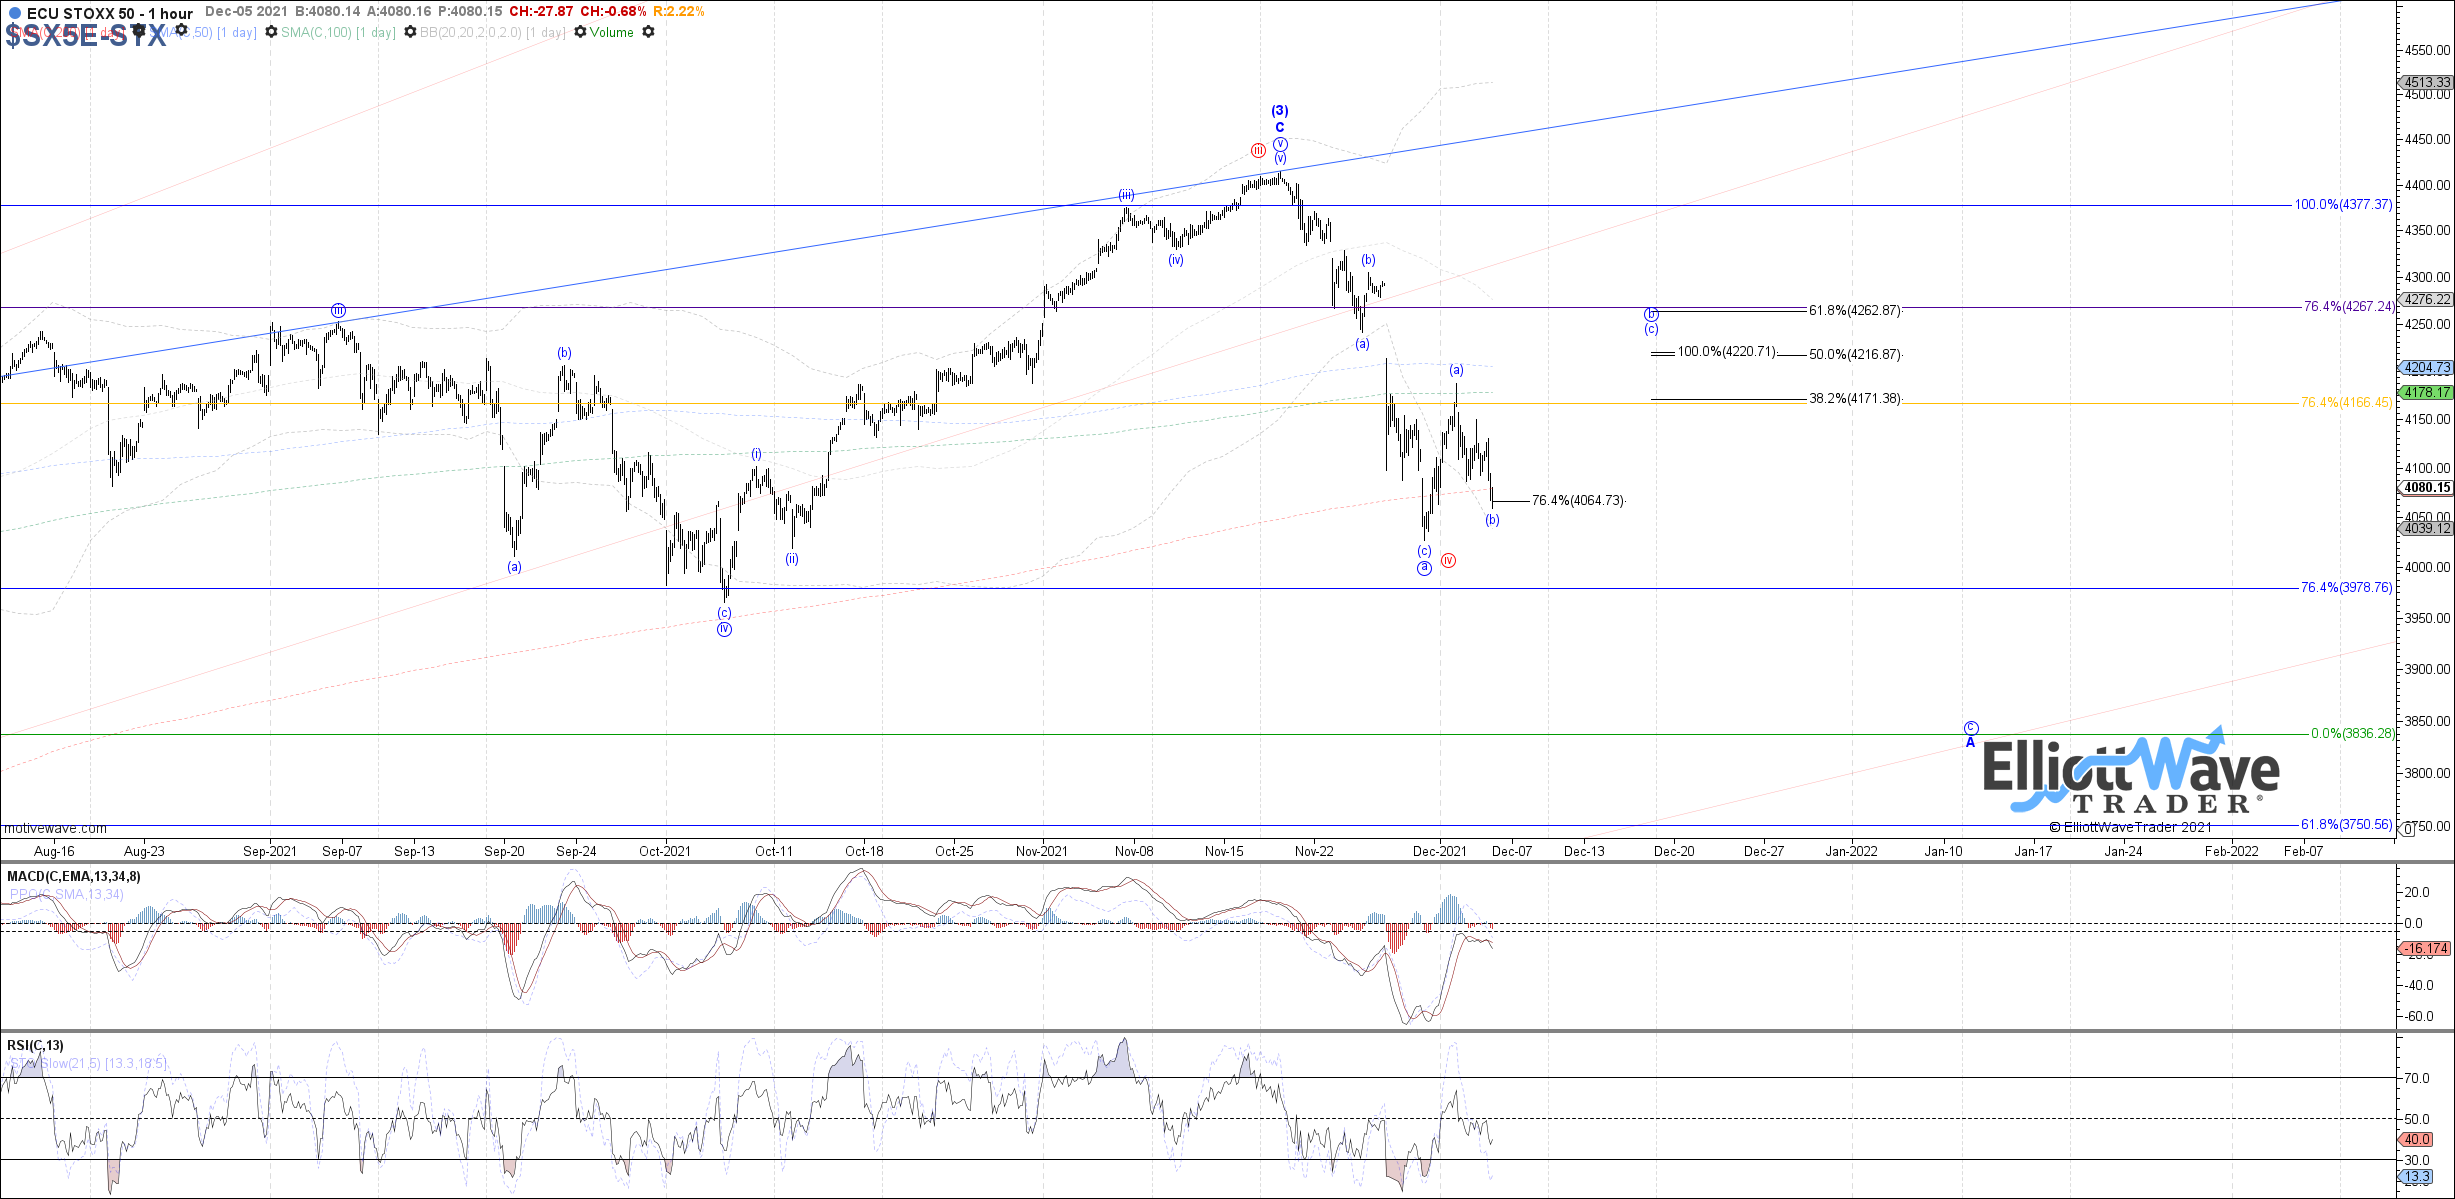
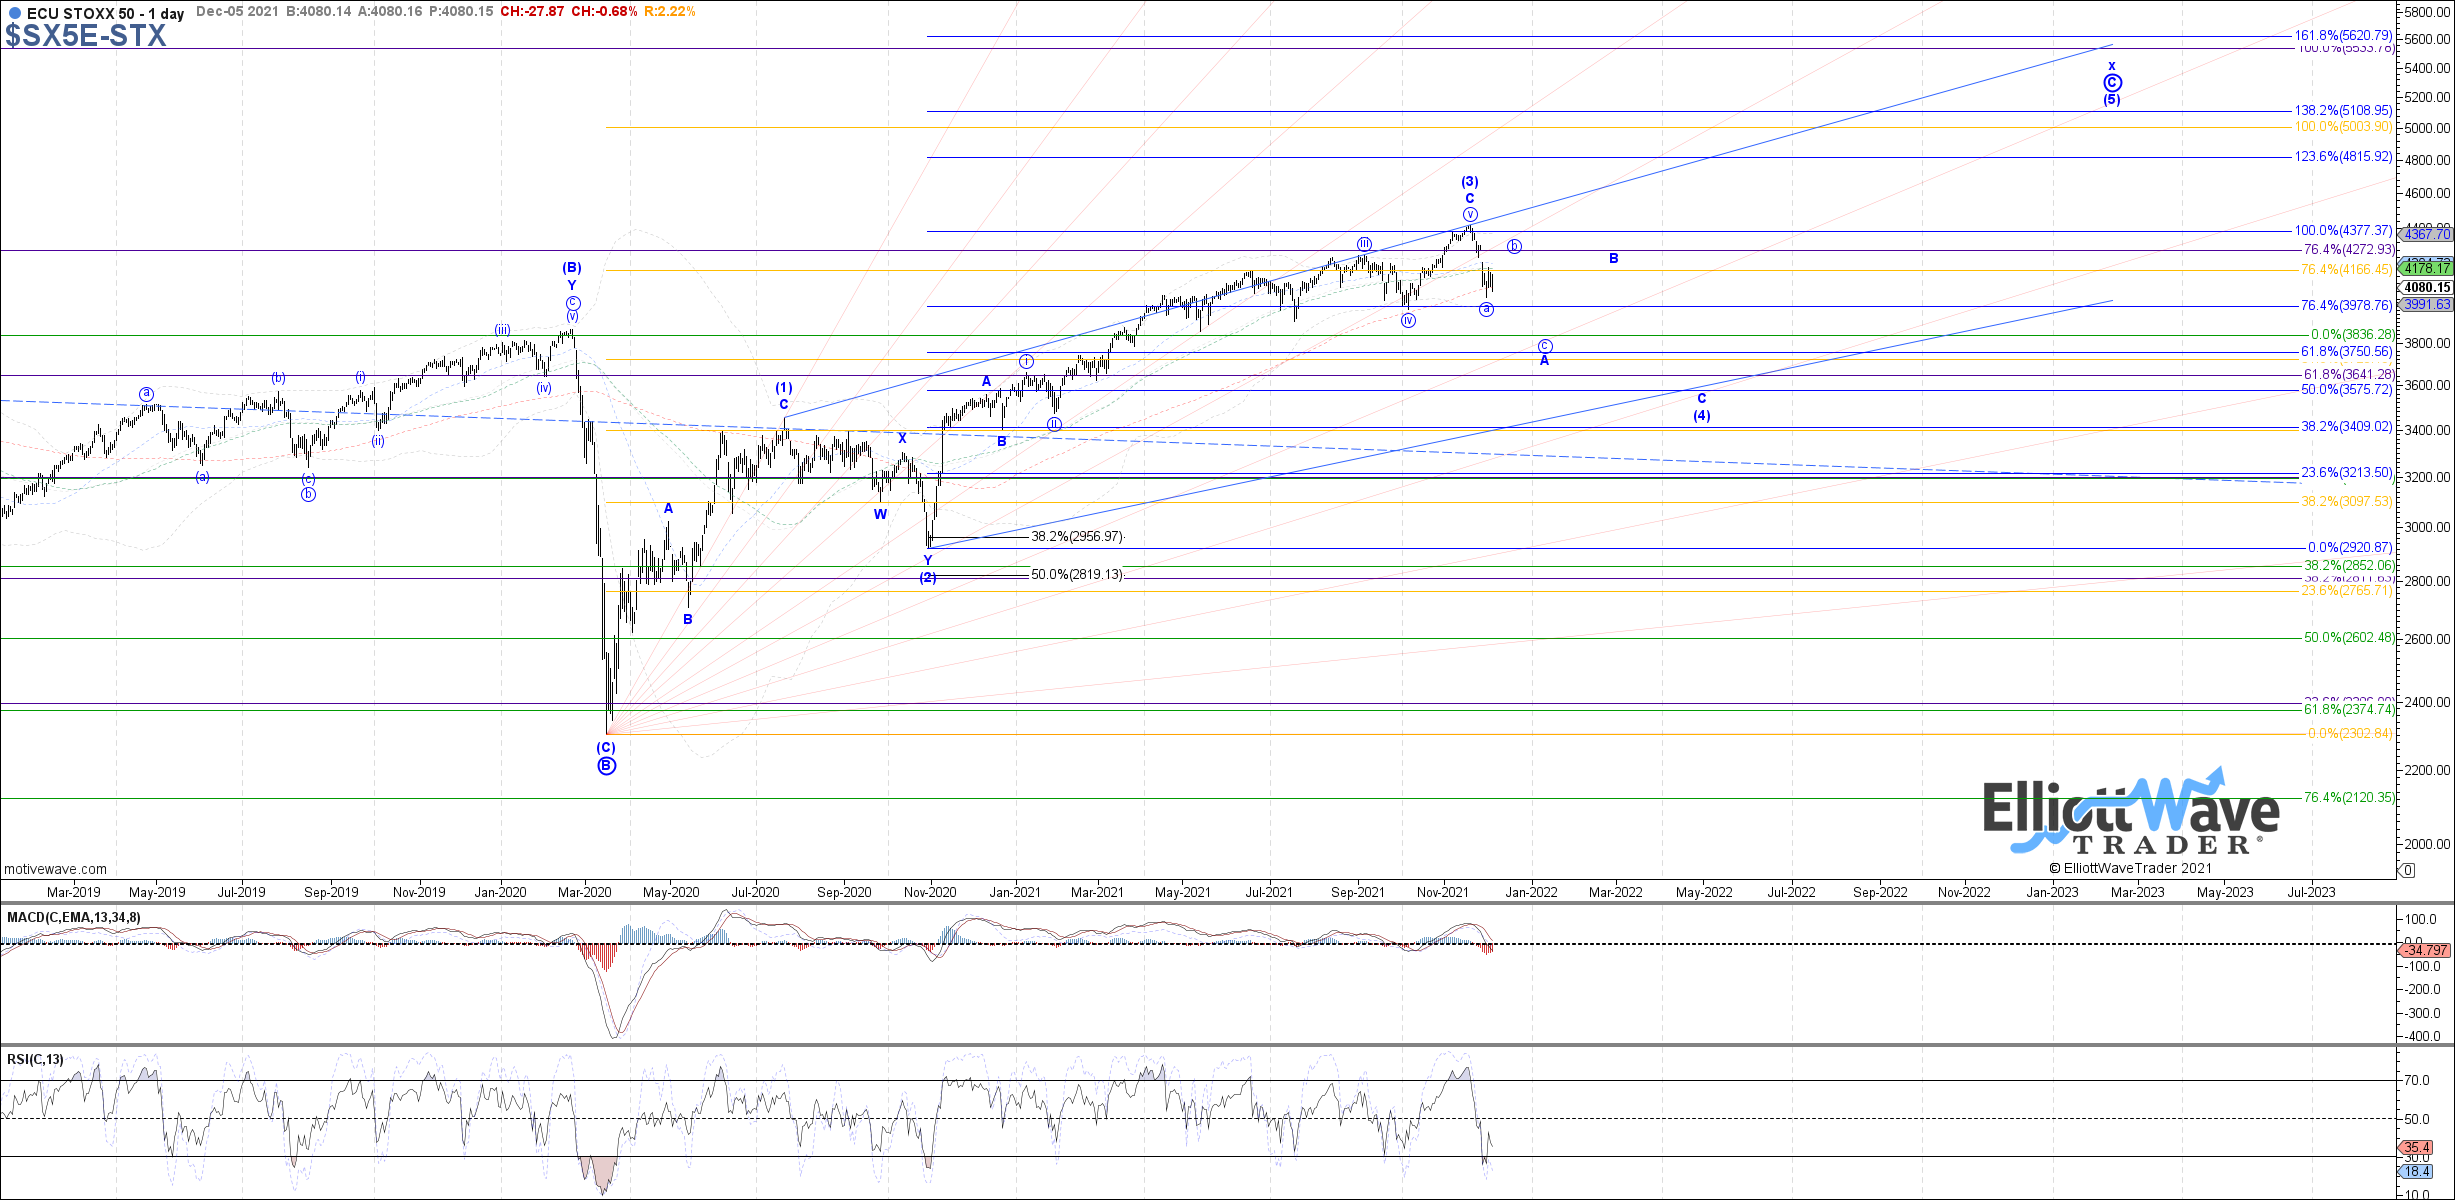
STOXX: The STOXX also traded initially lower last week, but managed a decent bounce mid-week and is now trying to hold a higher low. Therefore, last week’s low very reasonably counts as at least an a-wave down complete from the November high, allowing for more near-term upside in a wider flat b-wave with 4215 – 4265 as overhead resistance. Otherwise, the alternative if price drops directly back below last week’s low from here would be either an extension of blue wave a or red wave iv, and potentially even the start to blue wave c already.
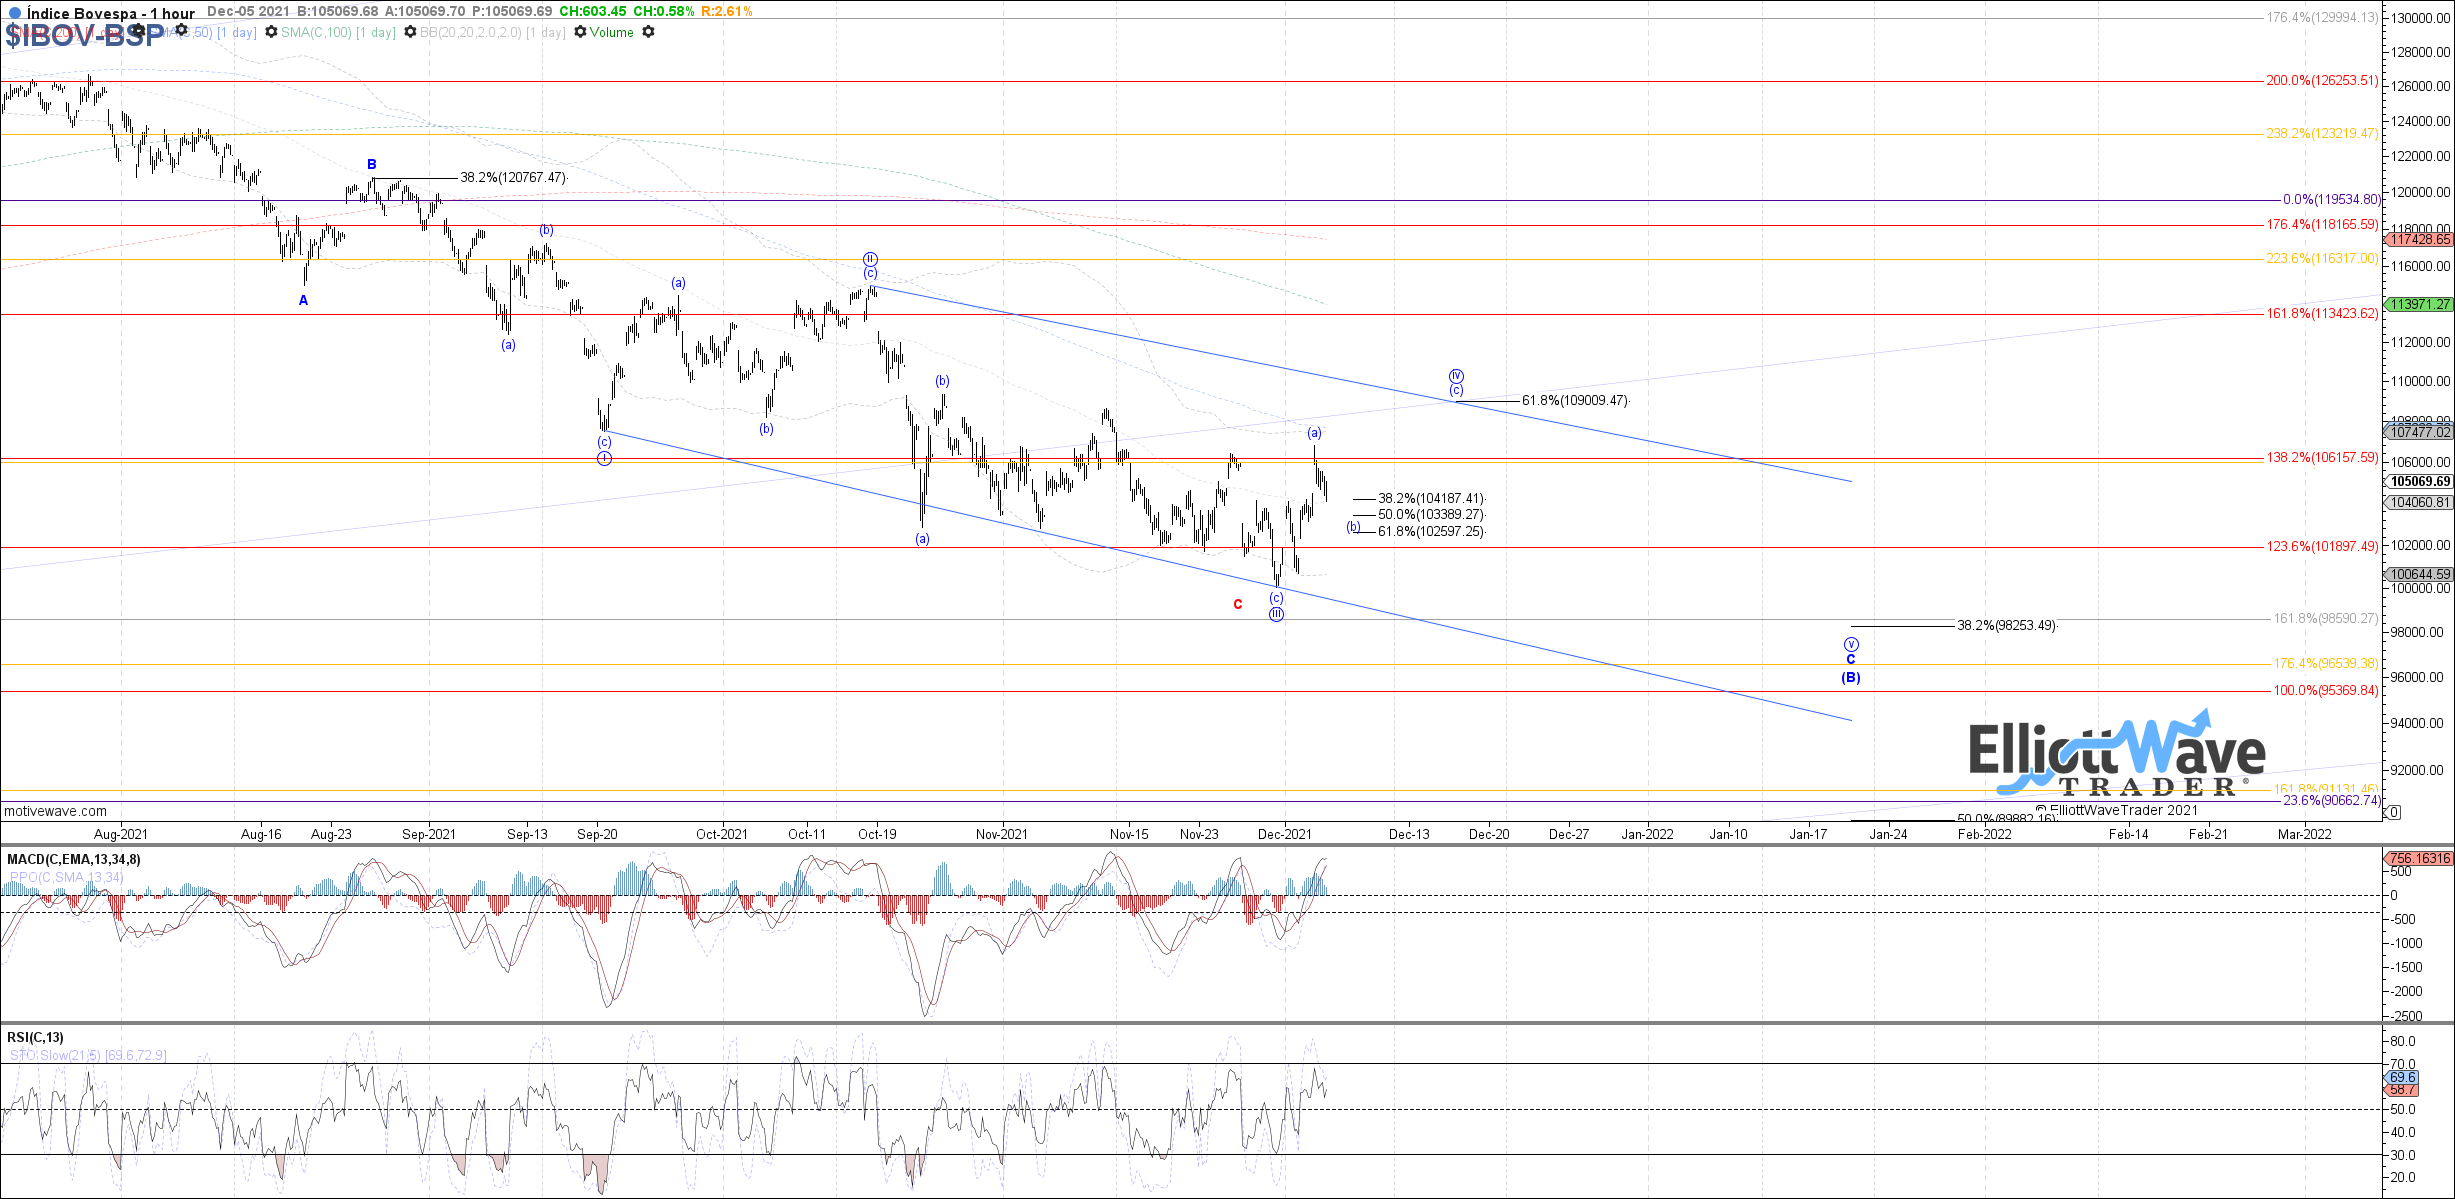
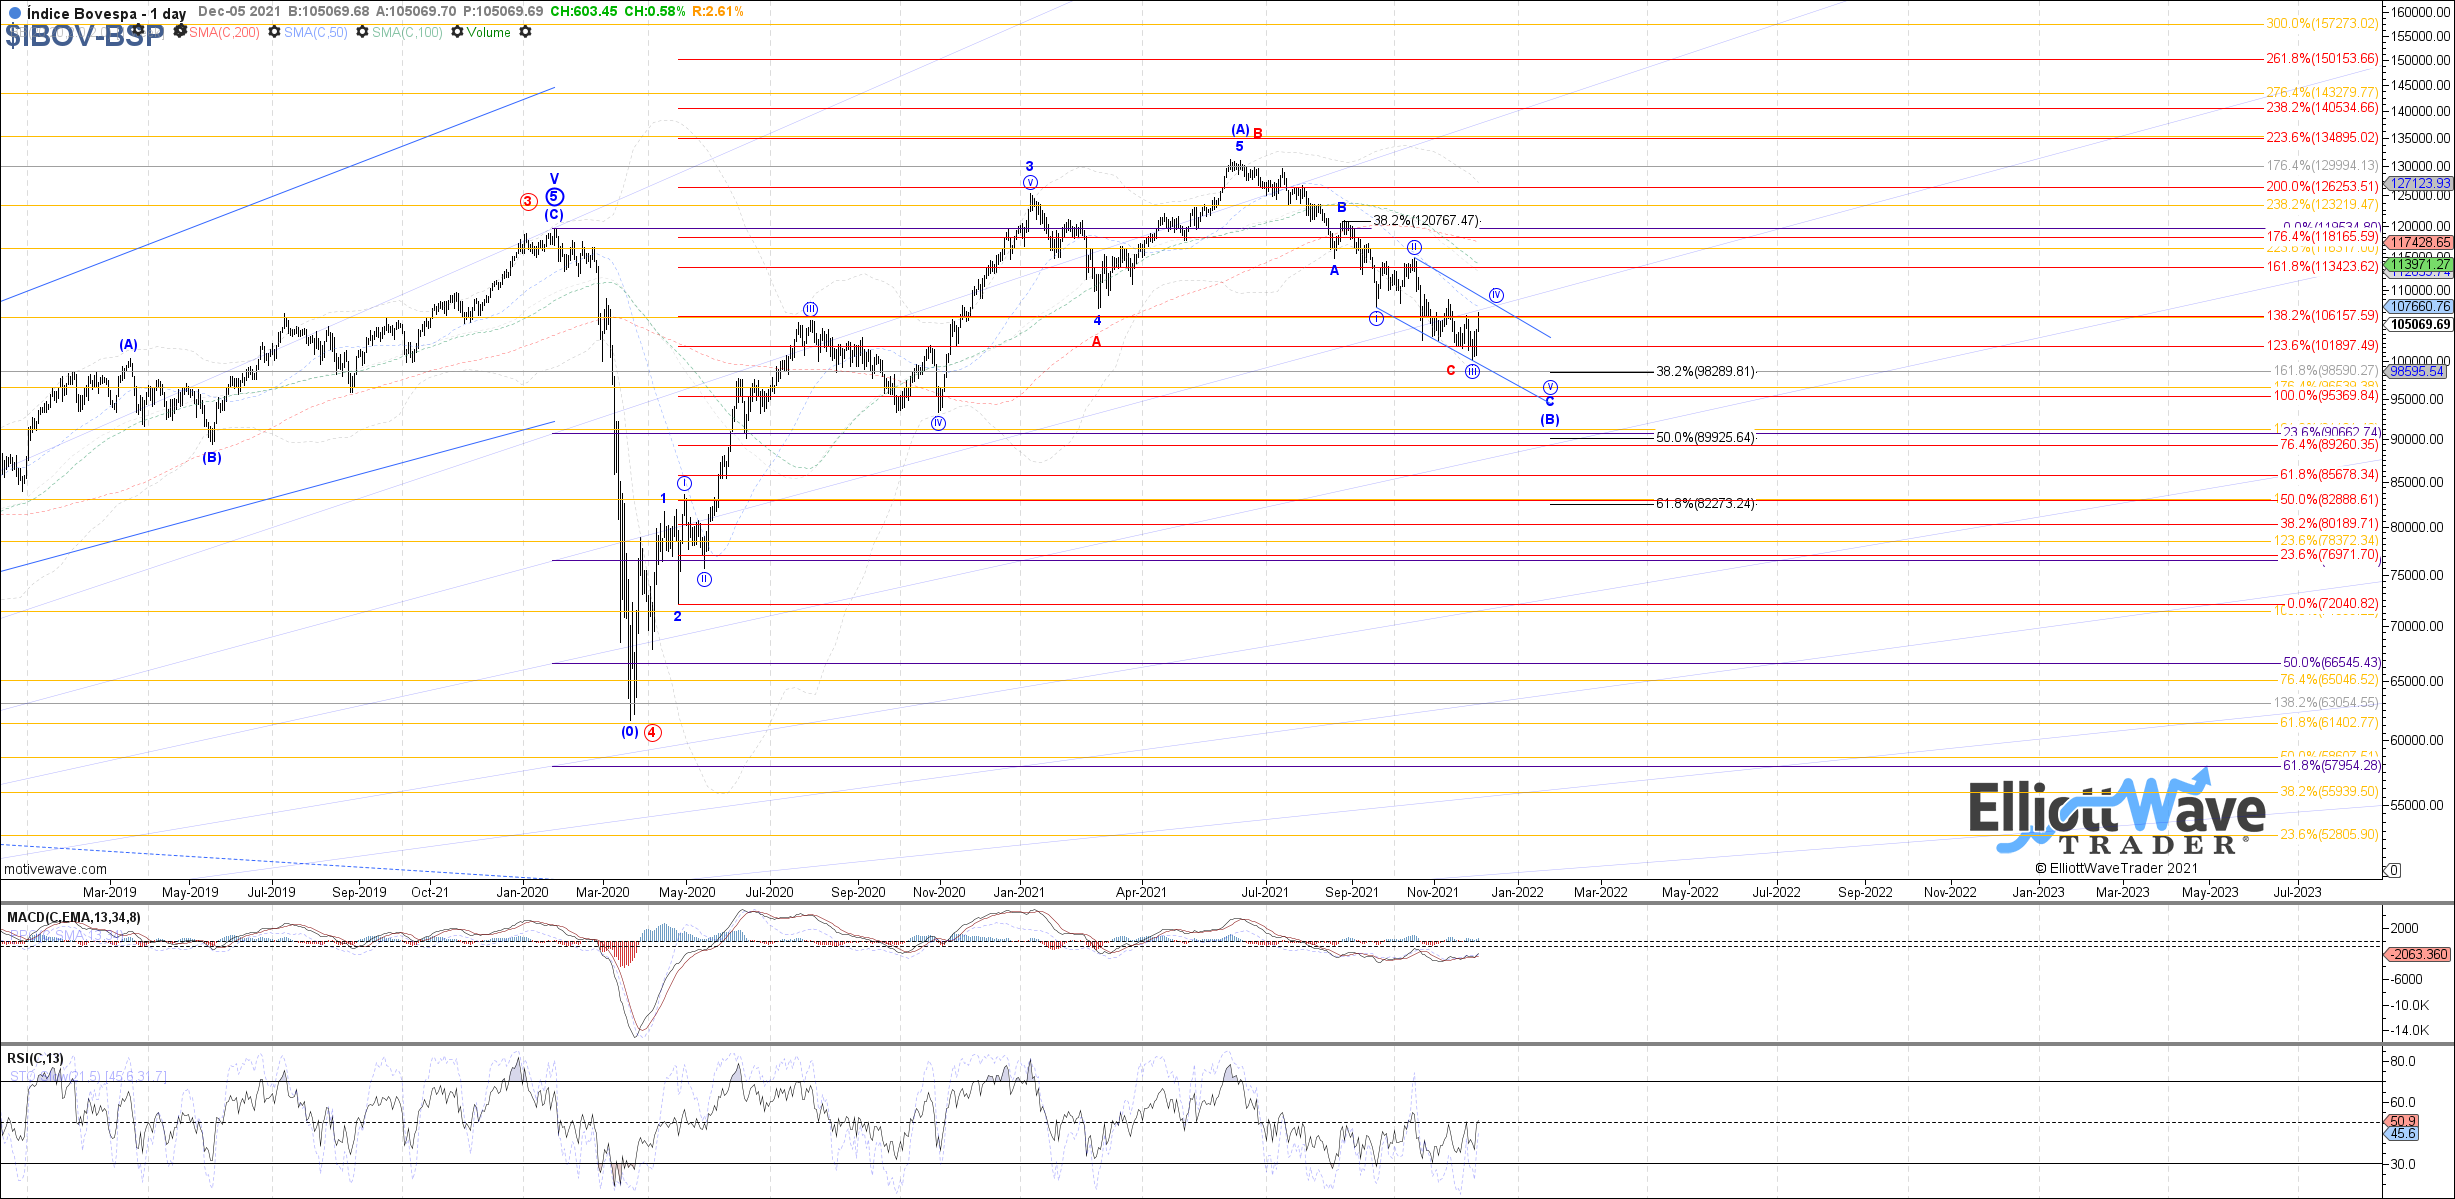
IBOV: The Bovespa started off initially lower last week, but rebounded strongly by the end of the week, briefly exceeding the prior week’s high. Along with some substantial positive divergence that has been building for several months, price may be trying to suggest it is closer to attempting a bottom to this correction off the June high. If 104185 – 102595 holds as support for the current pullback it can setup at least a trip up towards 109010 as resistance for a wave iv of C bounce in blue.
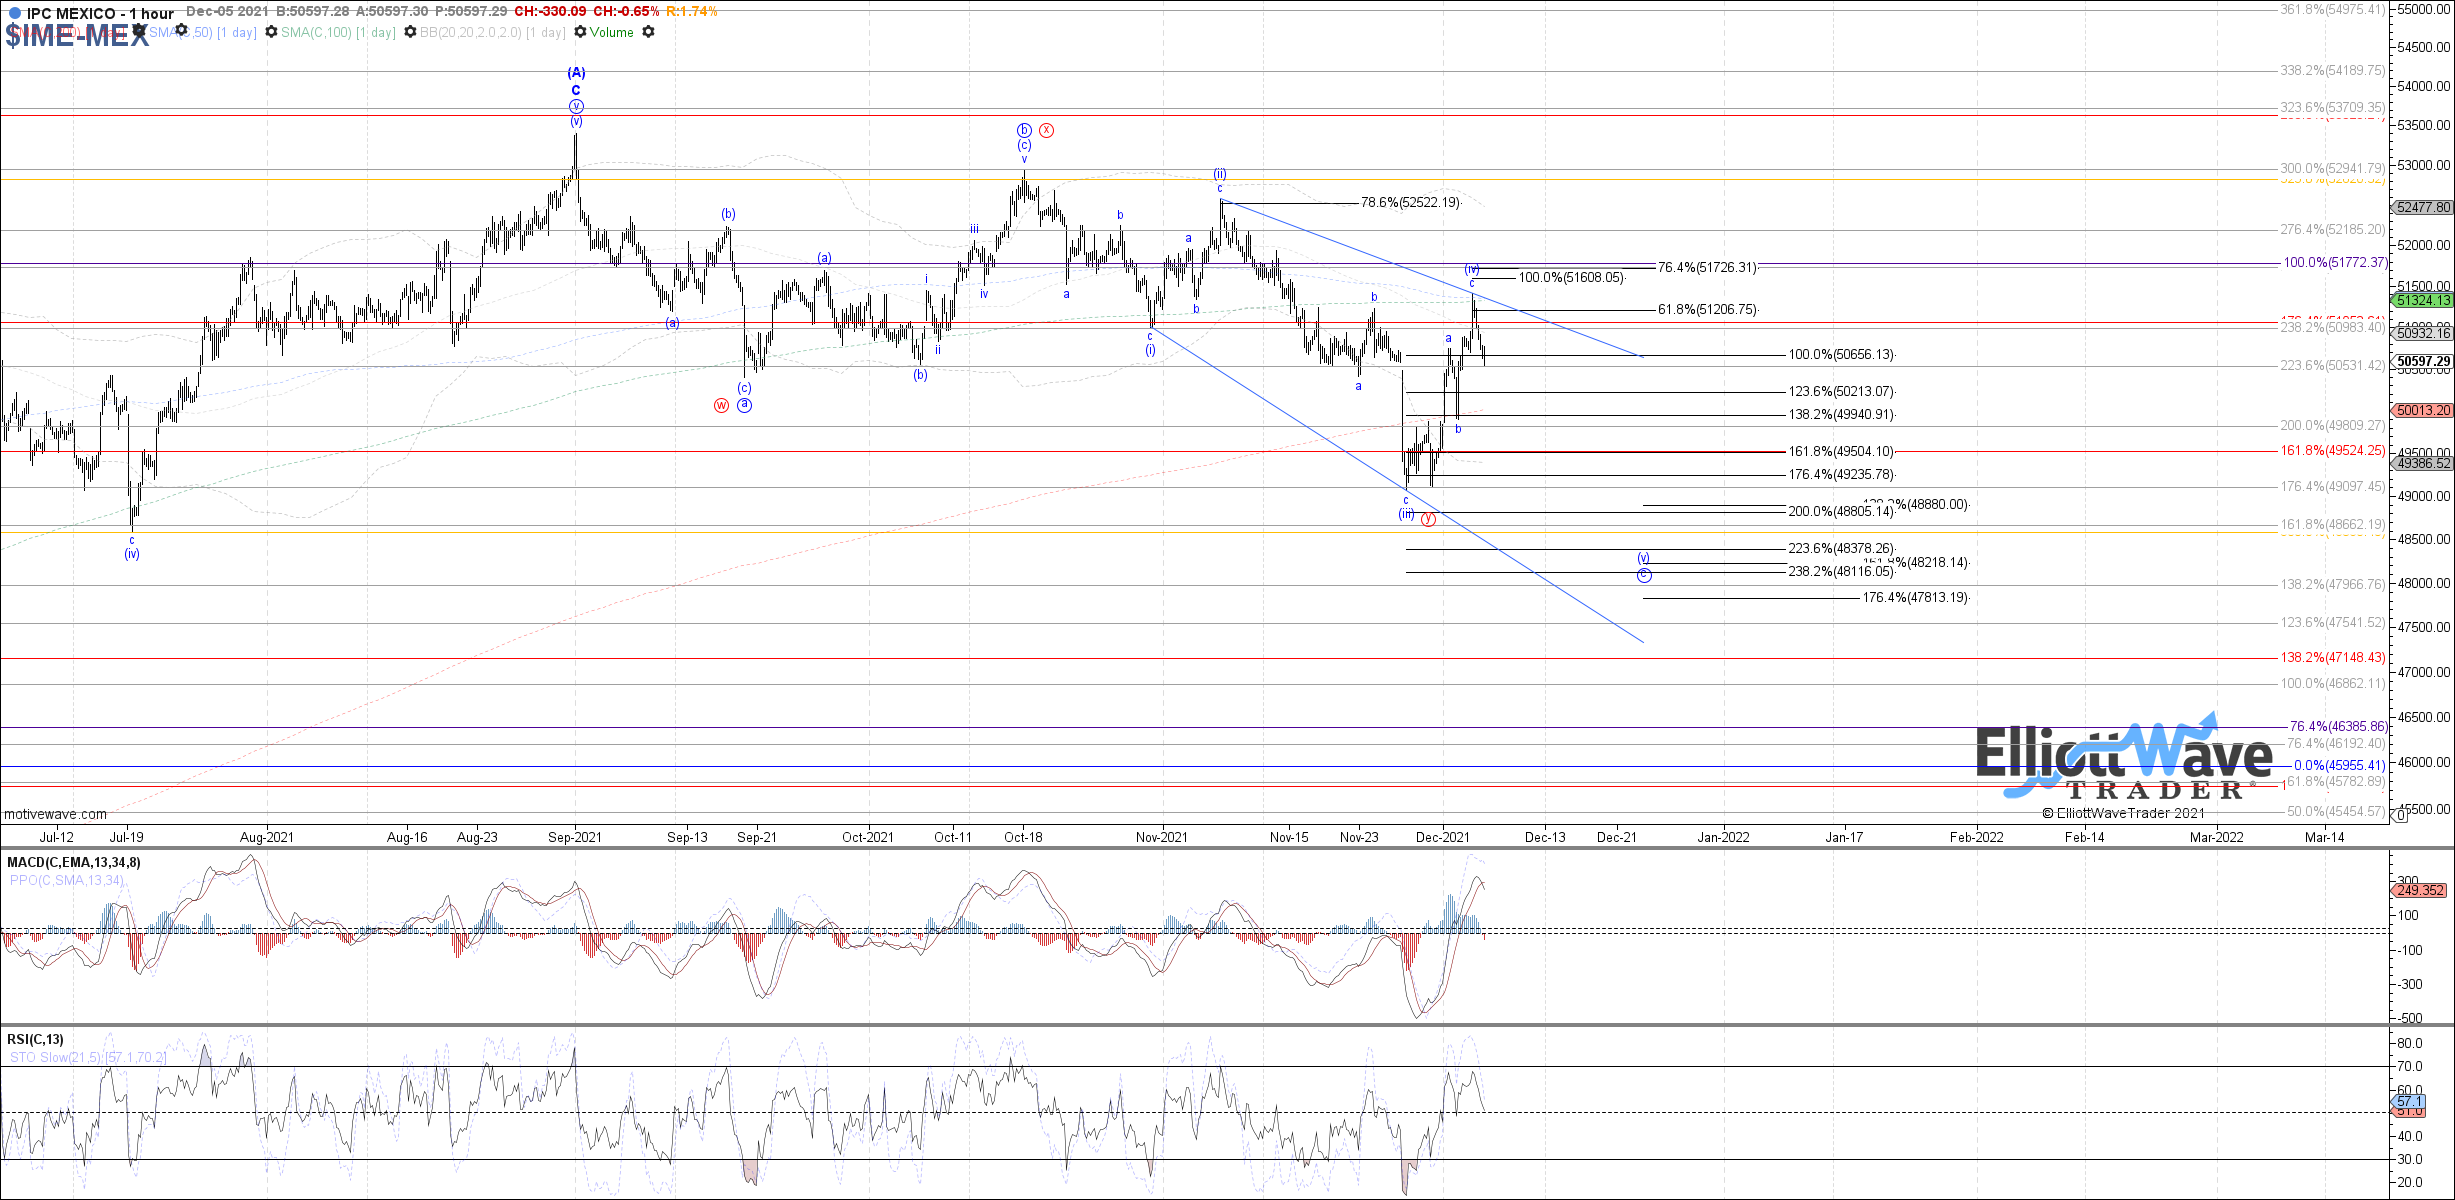
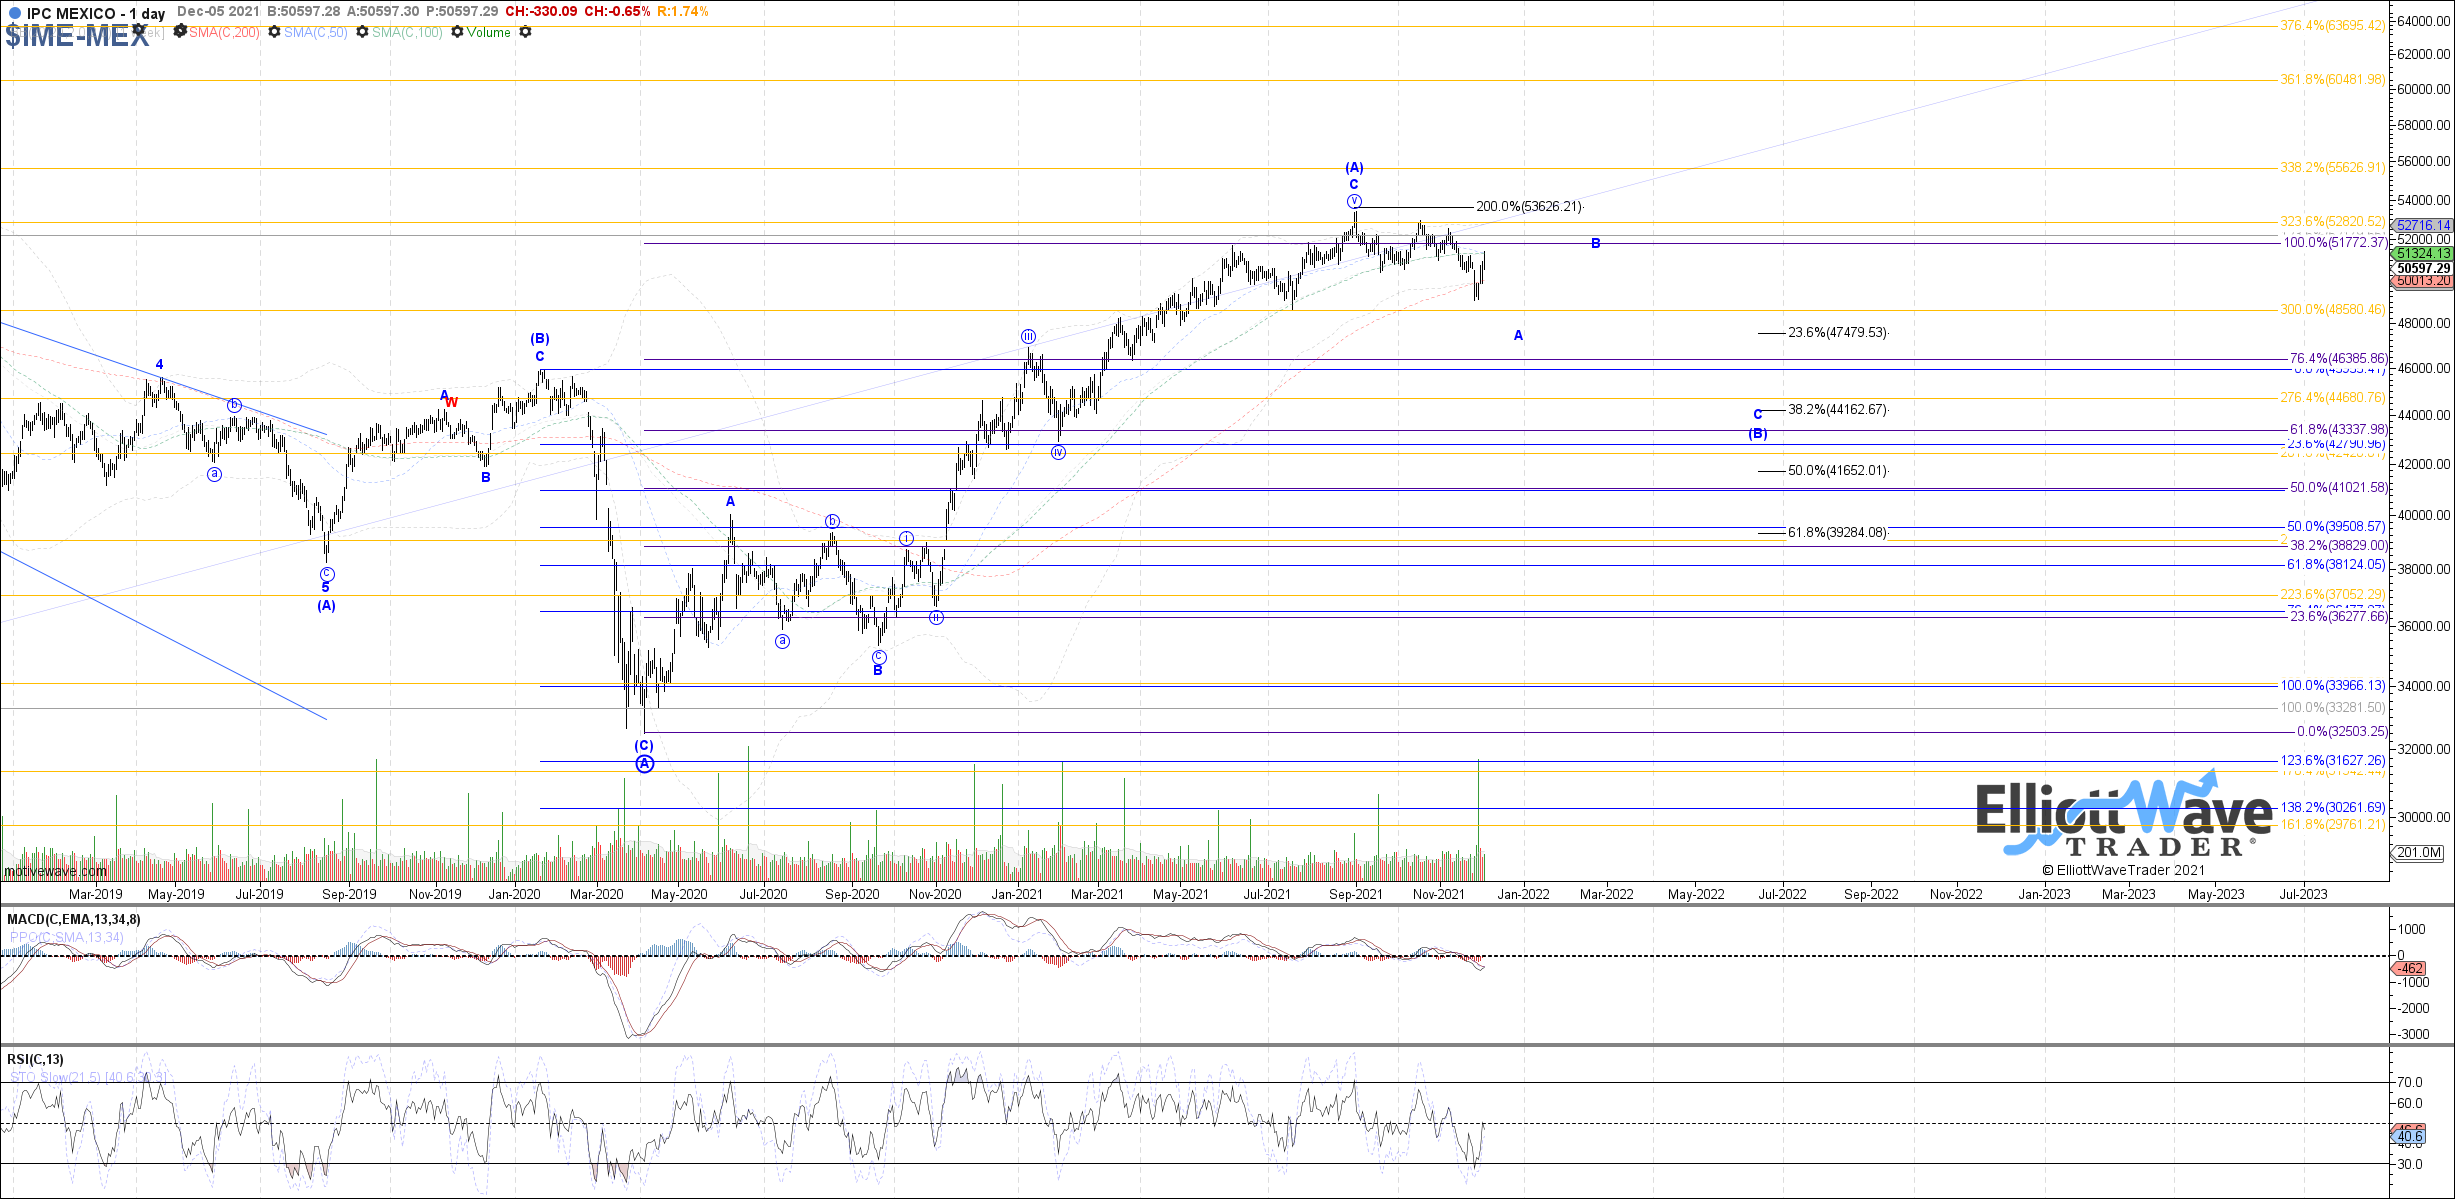
IPC: The IPC started off with some relative strength last week, holding above the prior week’s low and continuing to bounce into Friday’s close. Therefore, price fulfilled expectations for a wave (iv) of c bounce which really should have completed into last week’s high if the correct count. A break below 49900 is needed to confirm the likely start to wave (v) of c though. Otherwise, back above last week’s high begins to open the door to an initial 3 waves down from the September high complete as a wxy.