World Markets: Potential for Local Tops
 By
By
EUROPE/AMERICAS
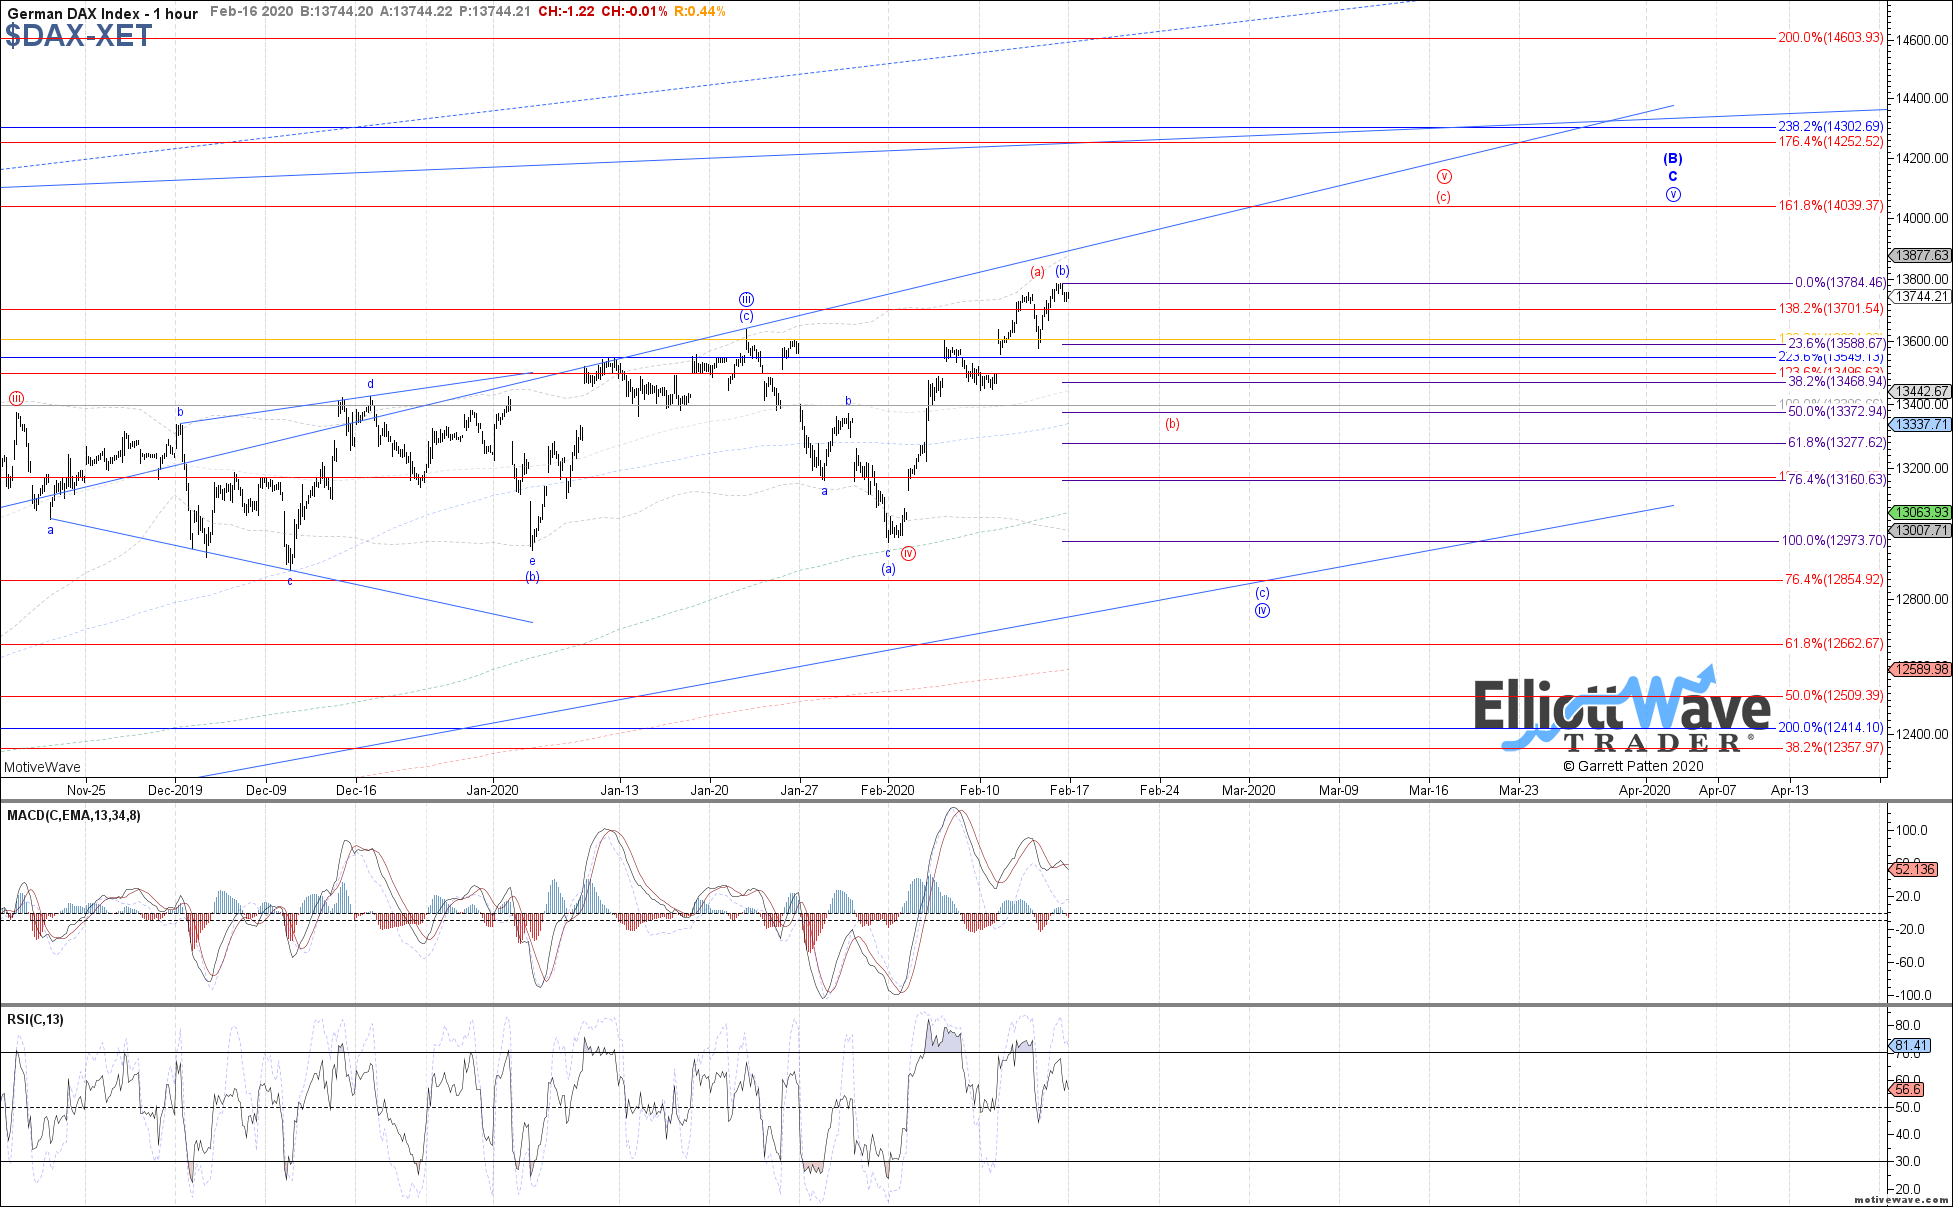
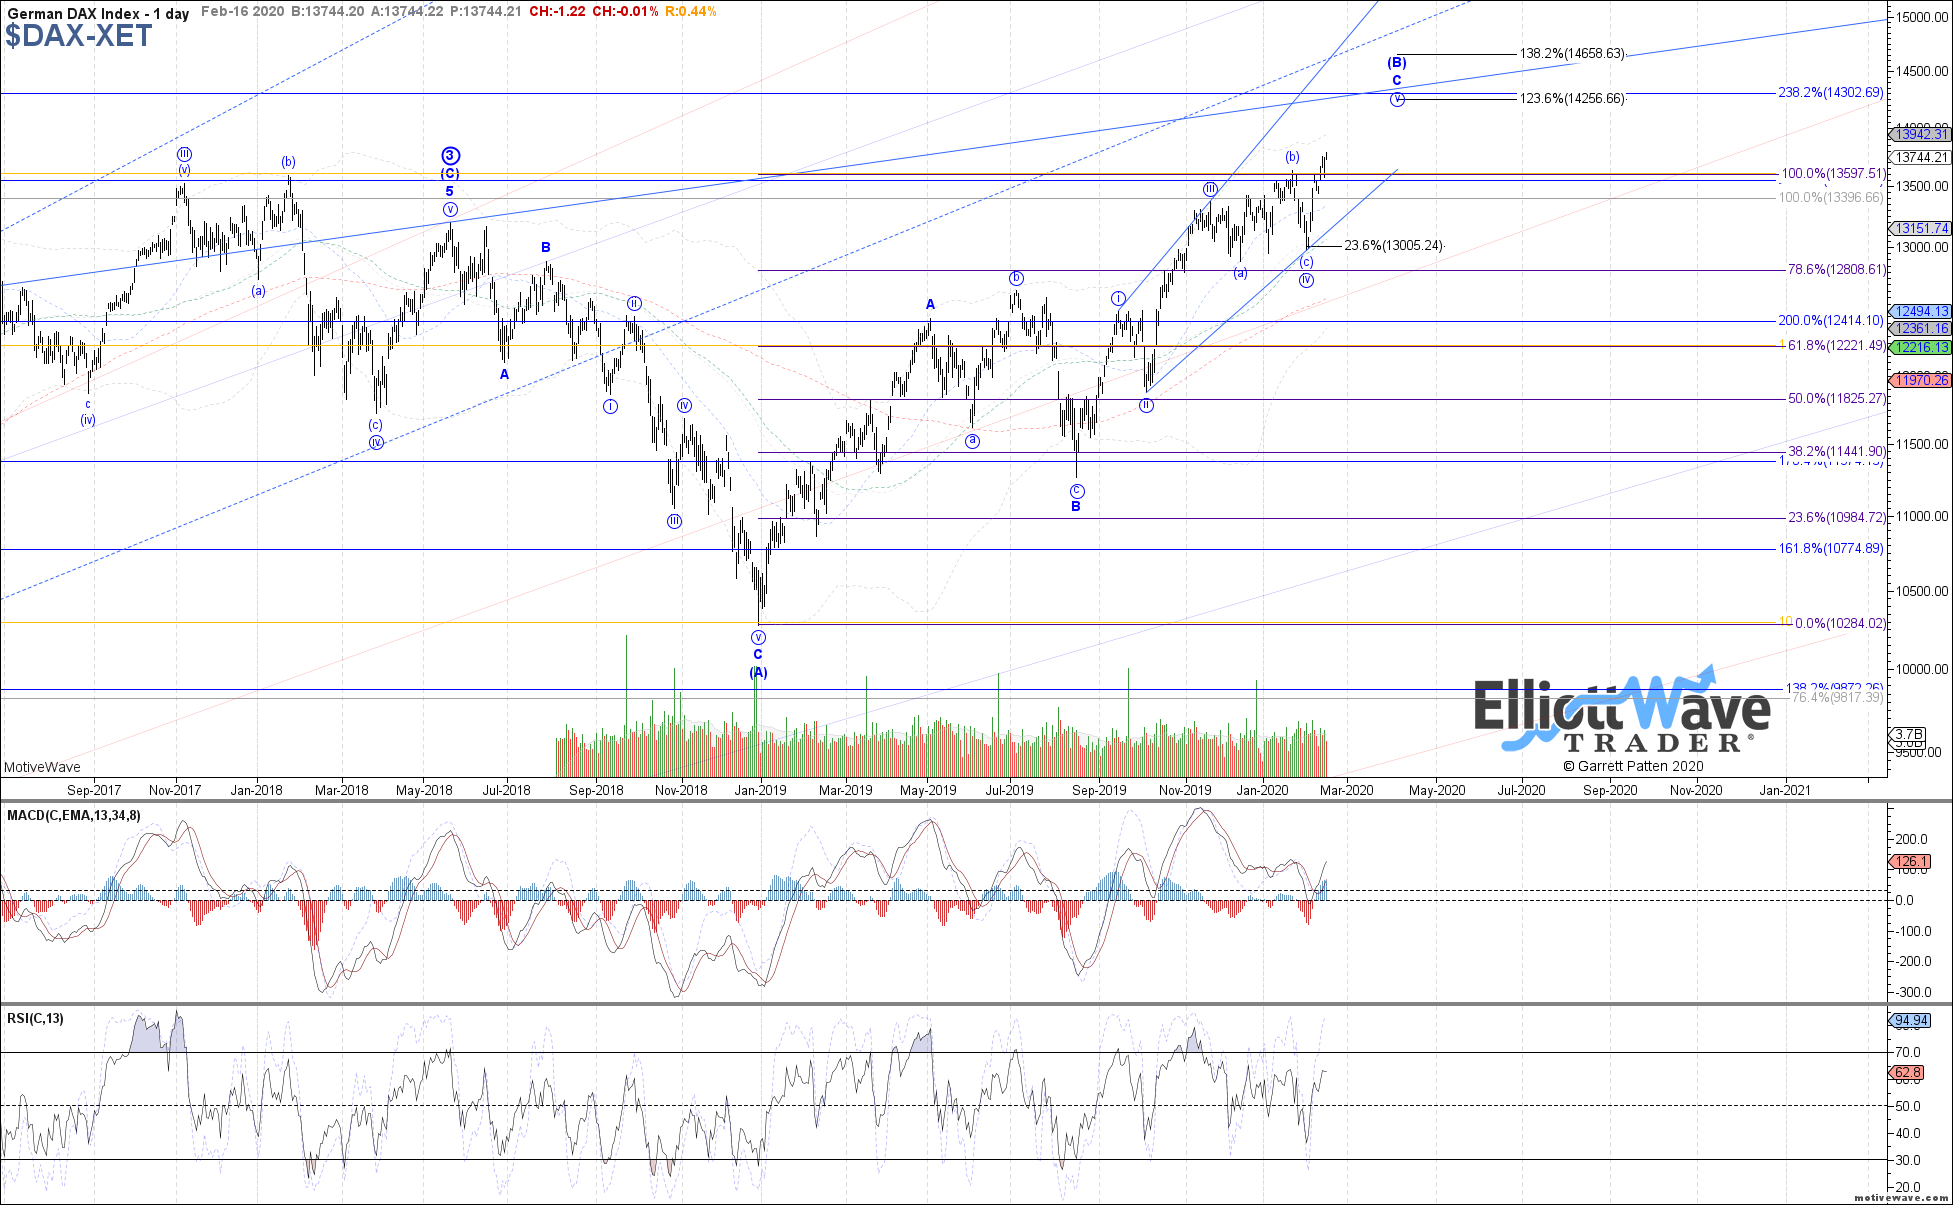
DAX: The DAX continued higher last week, likely as an extension of either blue wave (b) or red wave (a). The latter remains the more likely path at this time, but I still see odds in favor of at least a near-term pullback in red wave (b) of v next. A break below 13580 is now the signal of a local top in place, after which 13470 – 13275 becomes the target support for red wave (b) of v, below which and the door opens to the blue (c)-wave.
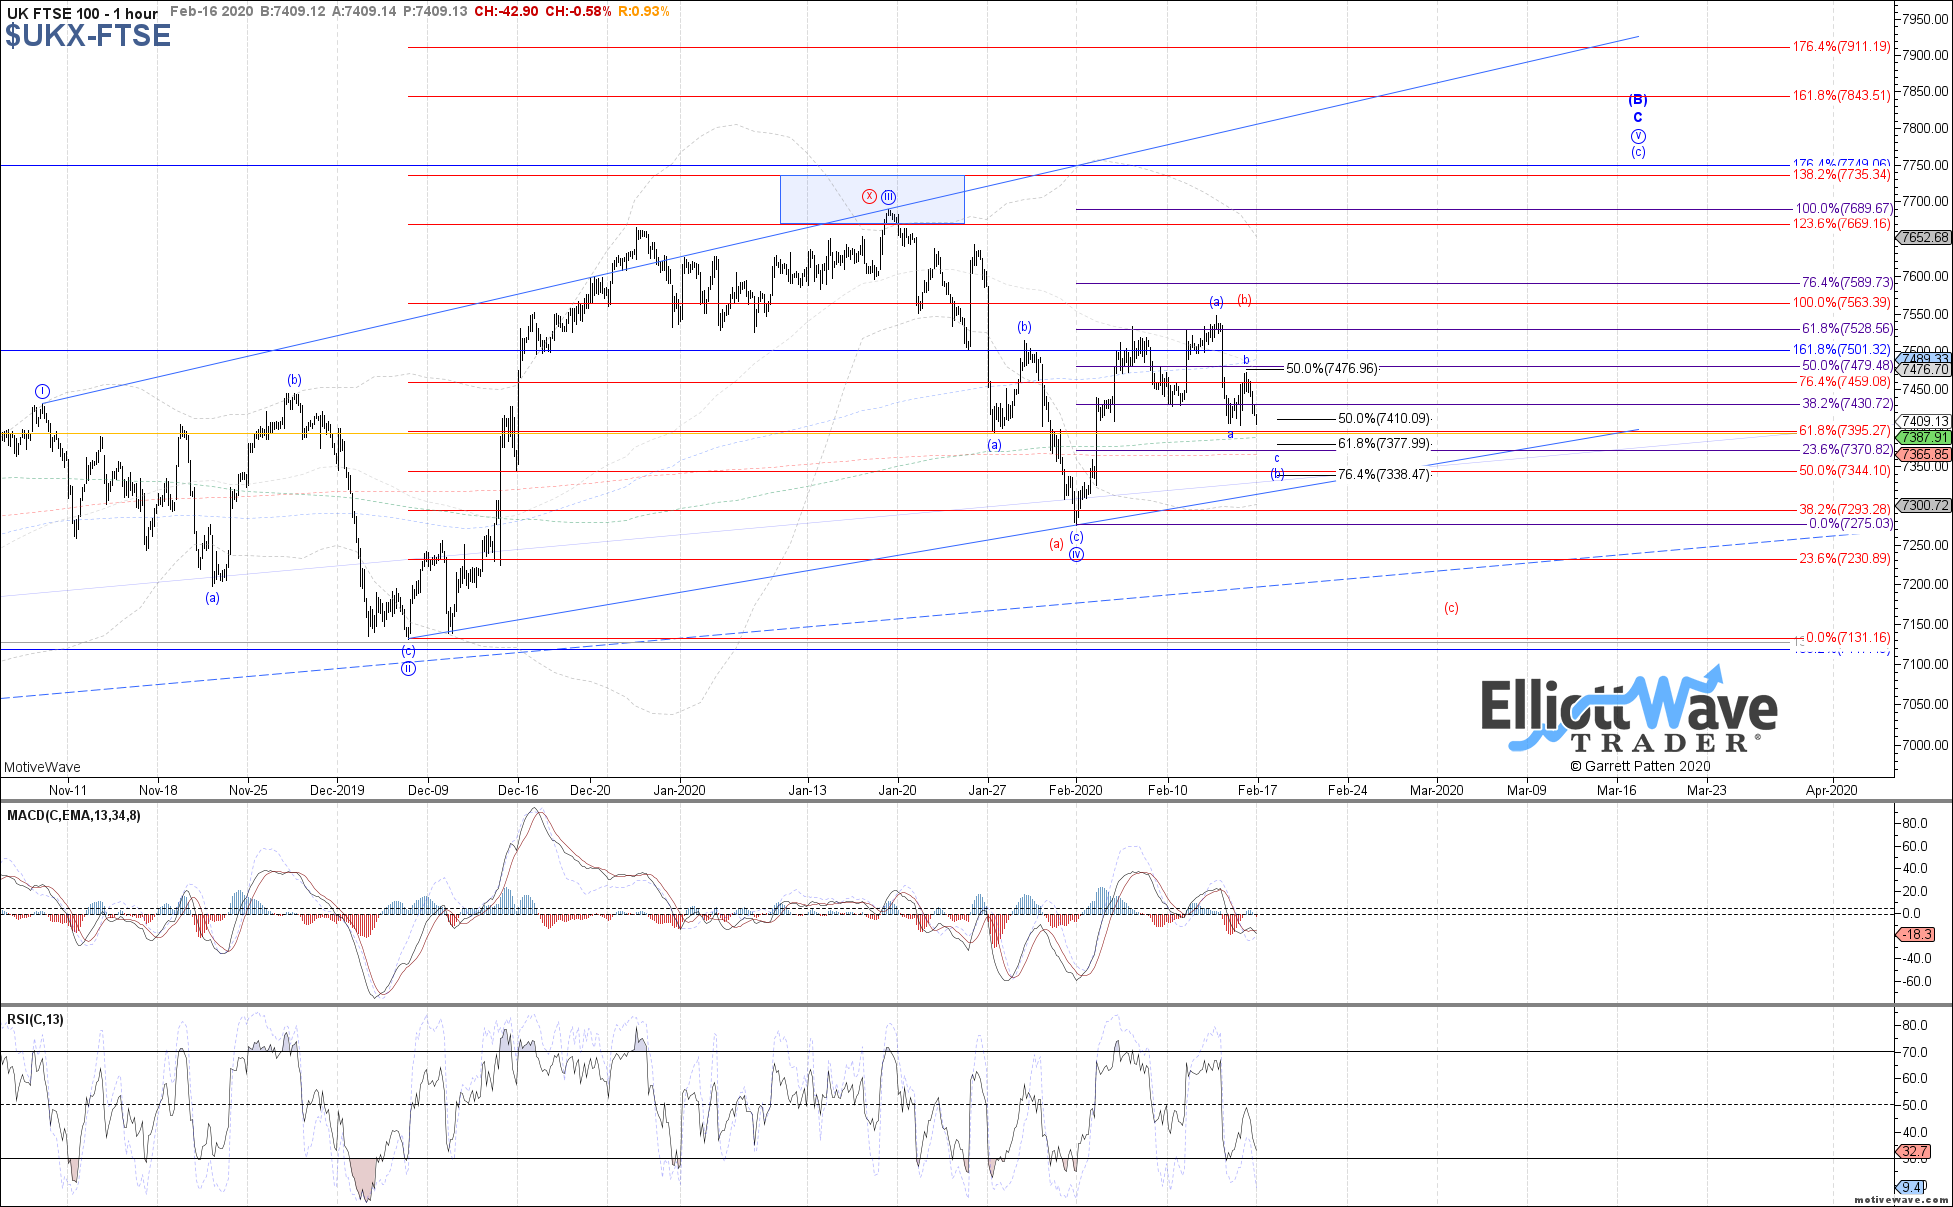
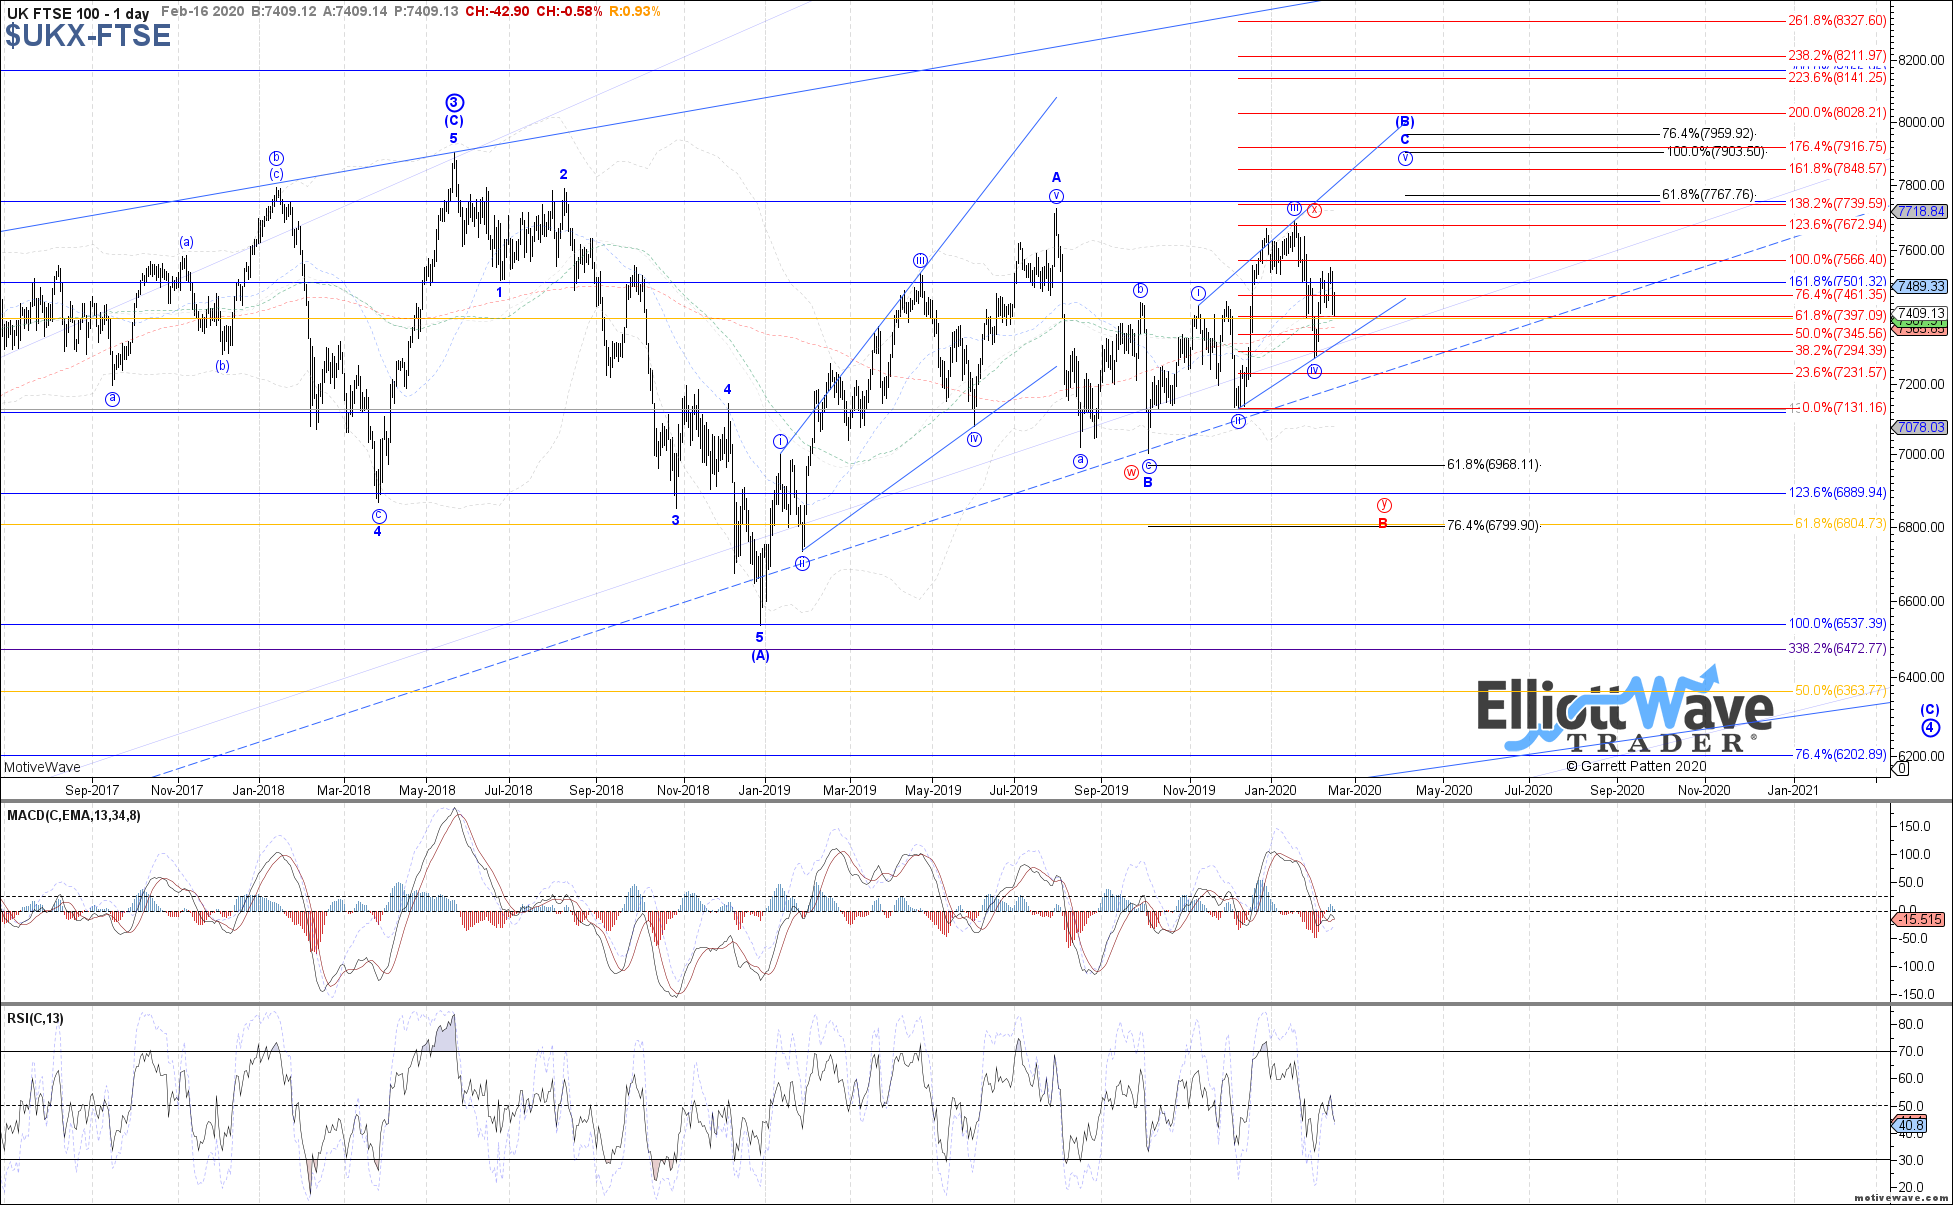
FTSE: The FTSE started off initially higher last week to test the .618 retrace at 7530, but the proceeded to roll over into Friday’s close. Therefore, last week’s high should have completed either blue wave (a) of v or red wave (b). If the former is the case, then 7375 – 7340 is support that should hold for blue wave (b) of v. A break below there opens the door to heading below the Feb low in the red (c)-wave.
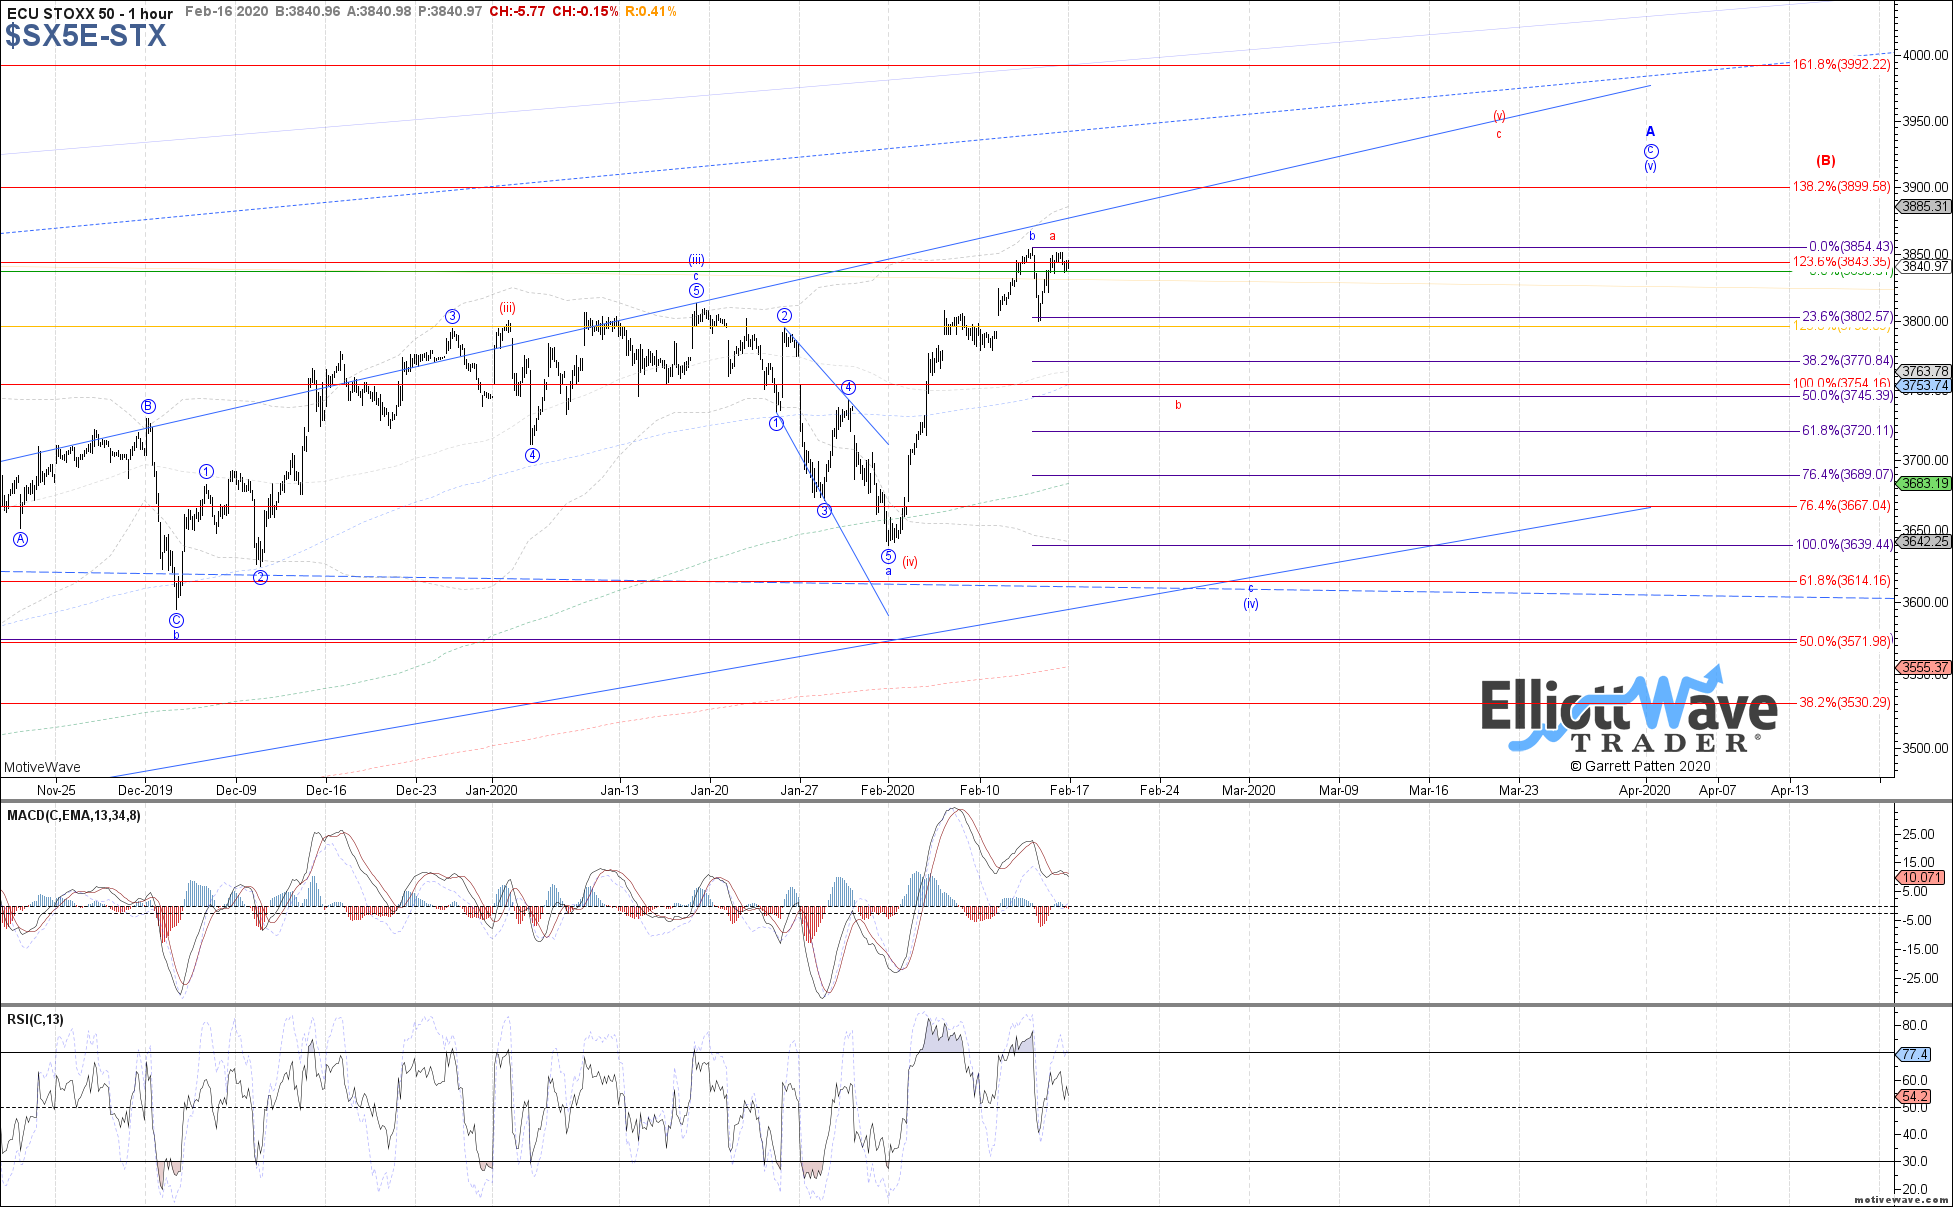
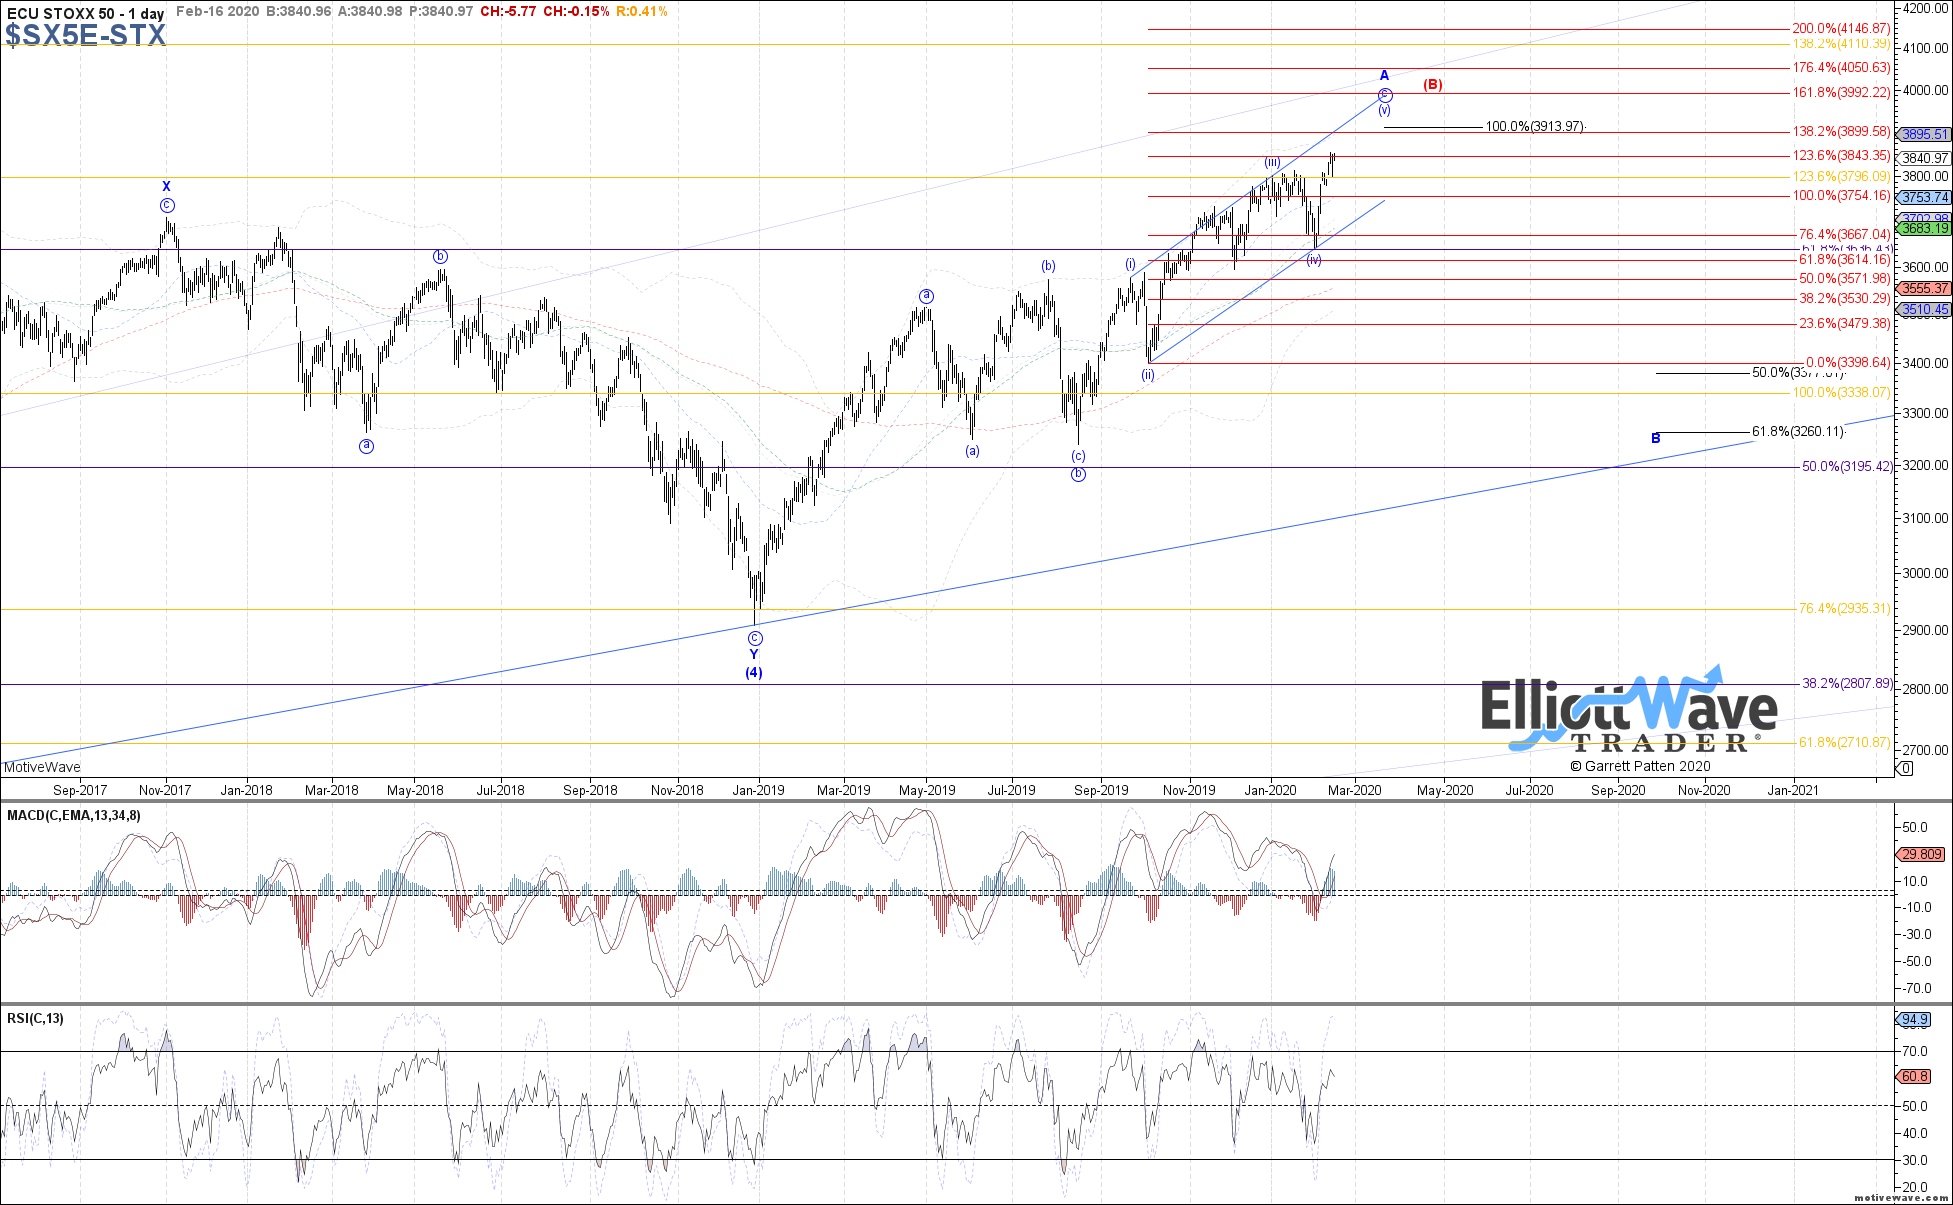
STOXX: The STOXX continued higher last week, likely as an extension of either blue wave b or red wave a of (v) like the DAX. The latter remains the more likely path, but I still see the potential for a local top to be attempted in this region for at least a corrective pullback in red wave b of (v). Below 3800 should signal a local top in place, after which 3770 – 3720 becomes the target support for red wave b of (v), a break of which would open the door to the blue c-wave again.
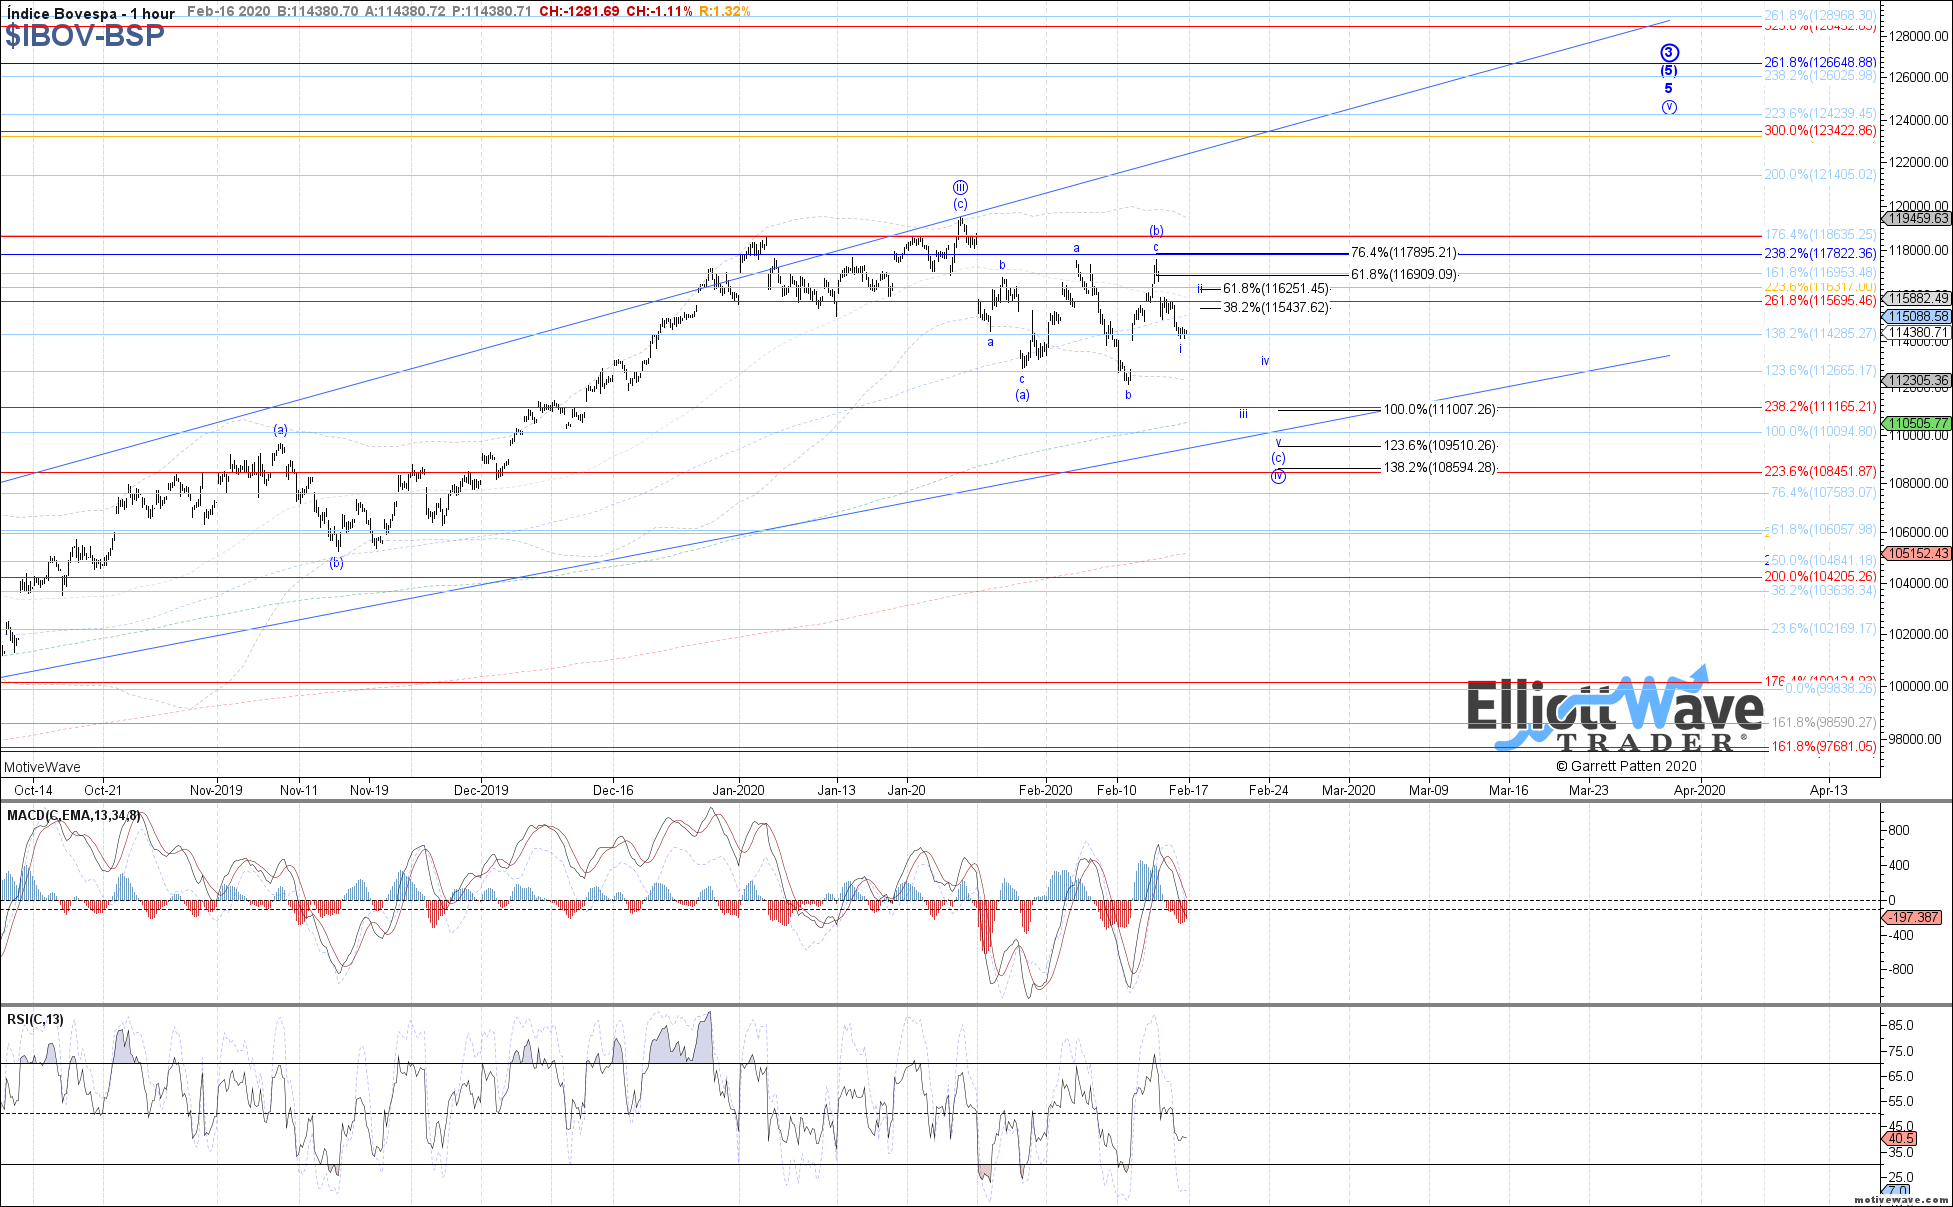
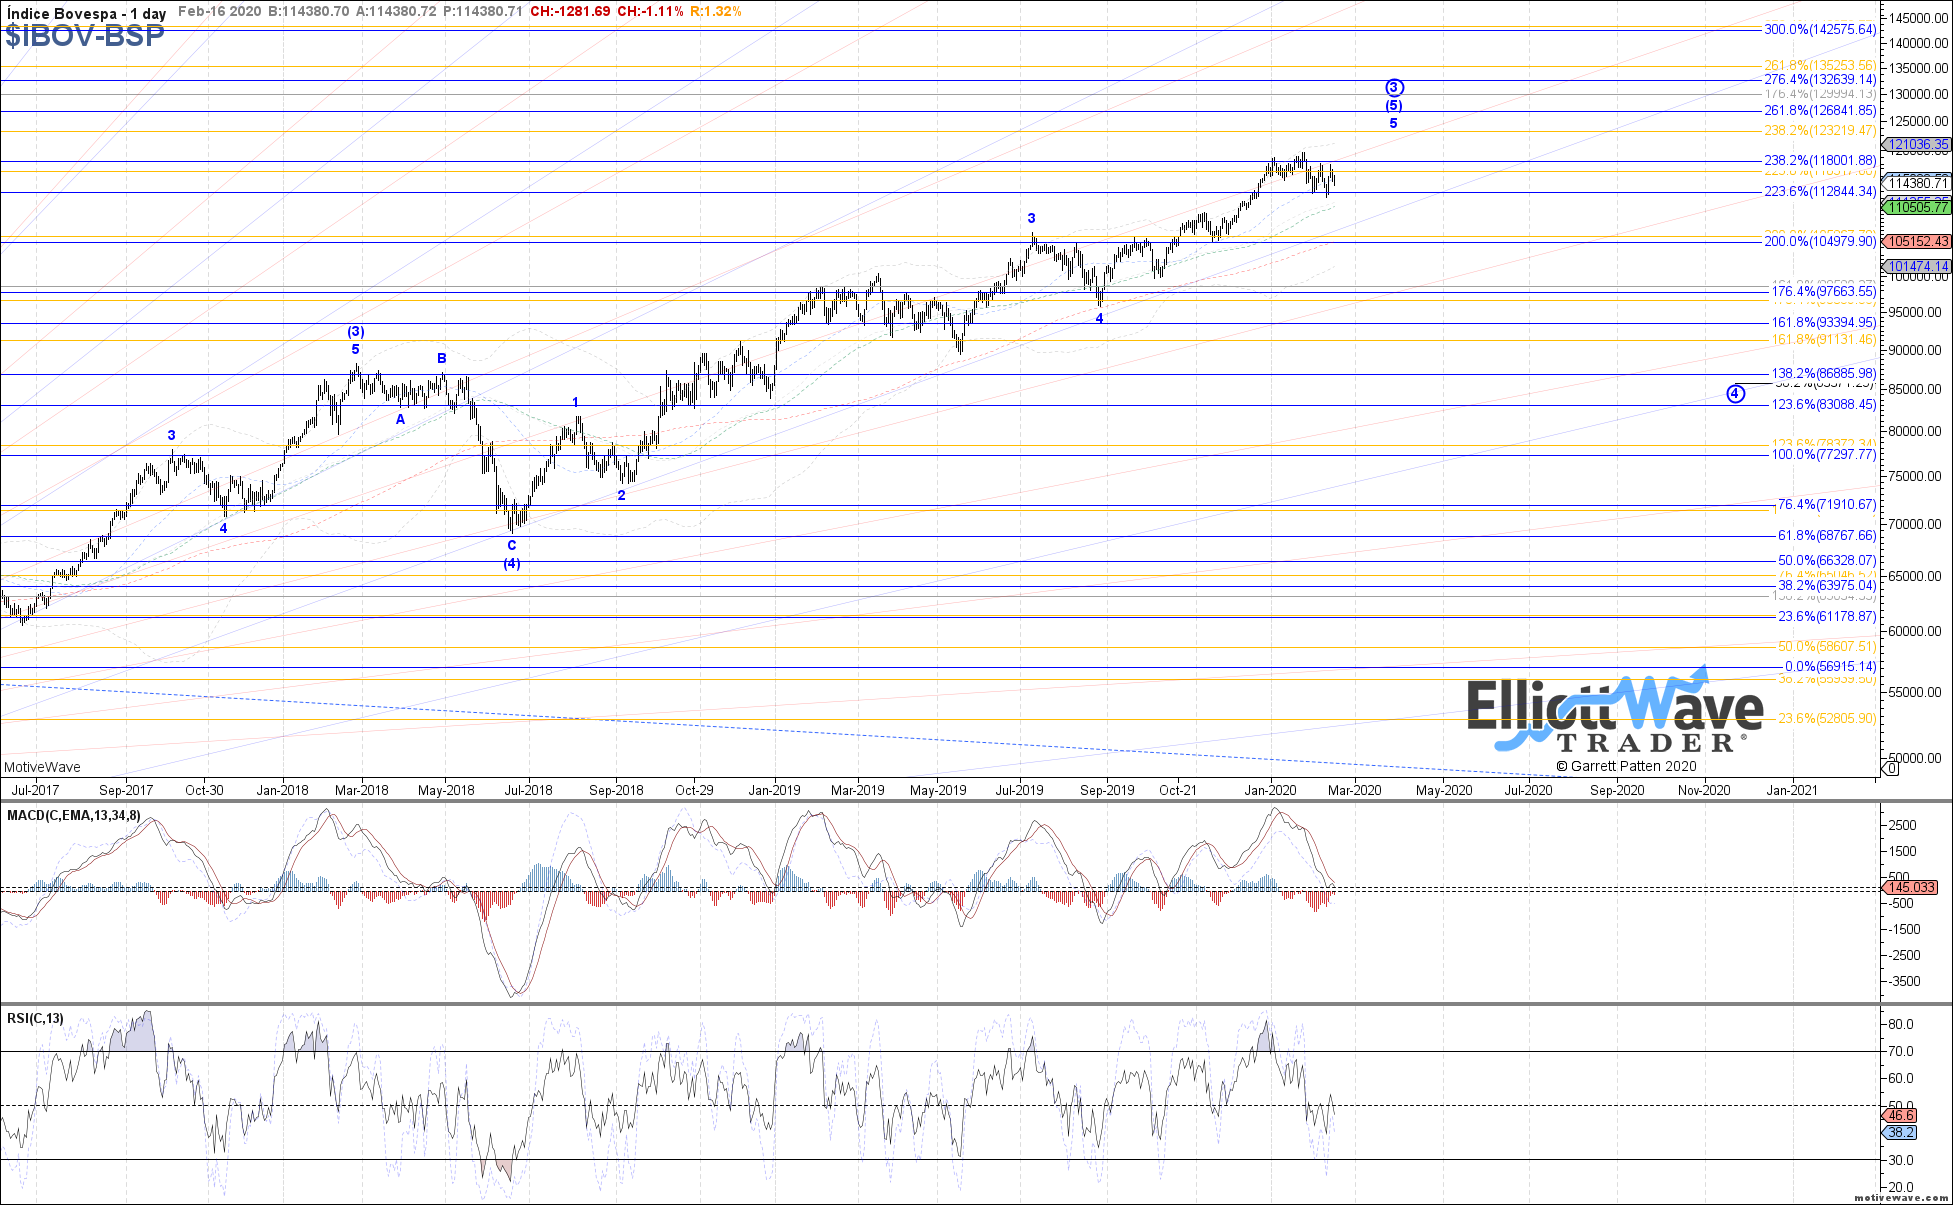
IBOV: The Bovespa started off initially higher last week, fulfilling expectations for the wider flat potential discussed as wave (b) of iv. Price has since turned back down in what should be the start to wave (c) of iv, with 111010 – 108595 as overall target support below. Near-term price may attempt a bounce as wave ii of (c), with 115440 – 116250 as target resistance to hold in order to turn back down again in wave iii of (c) next.
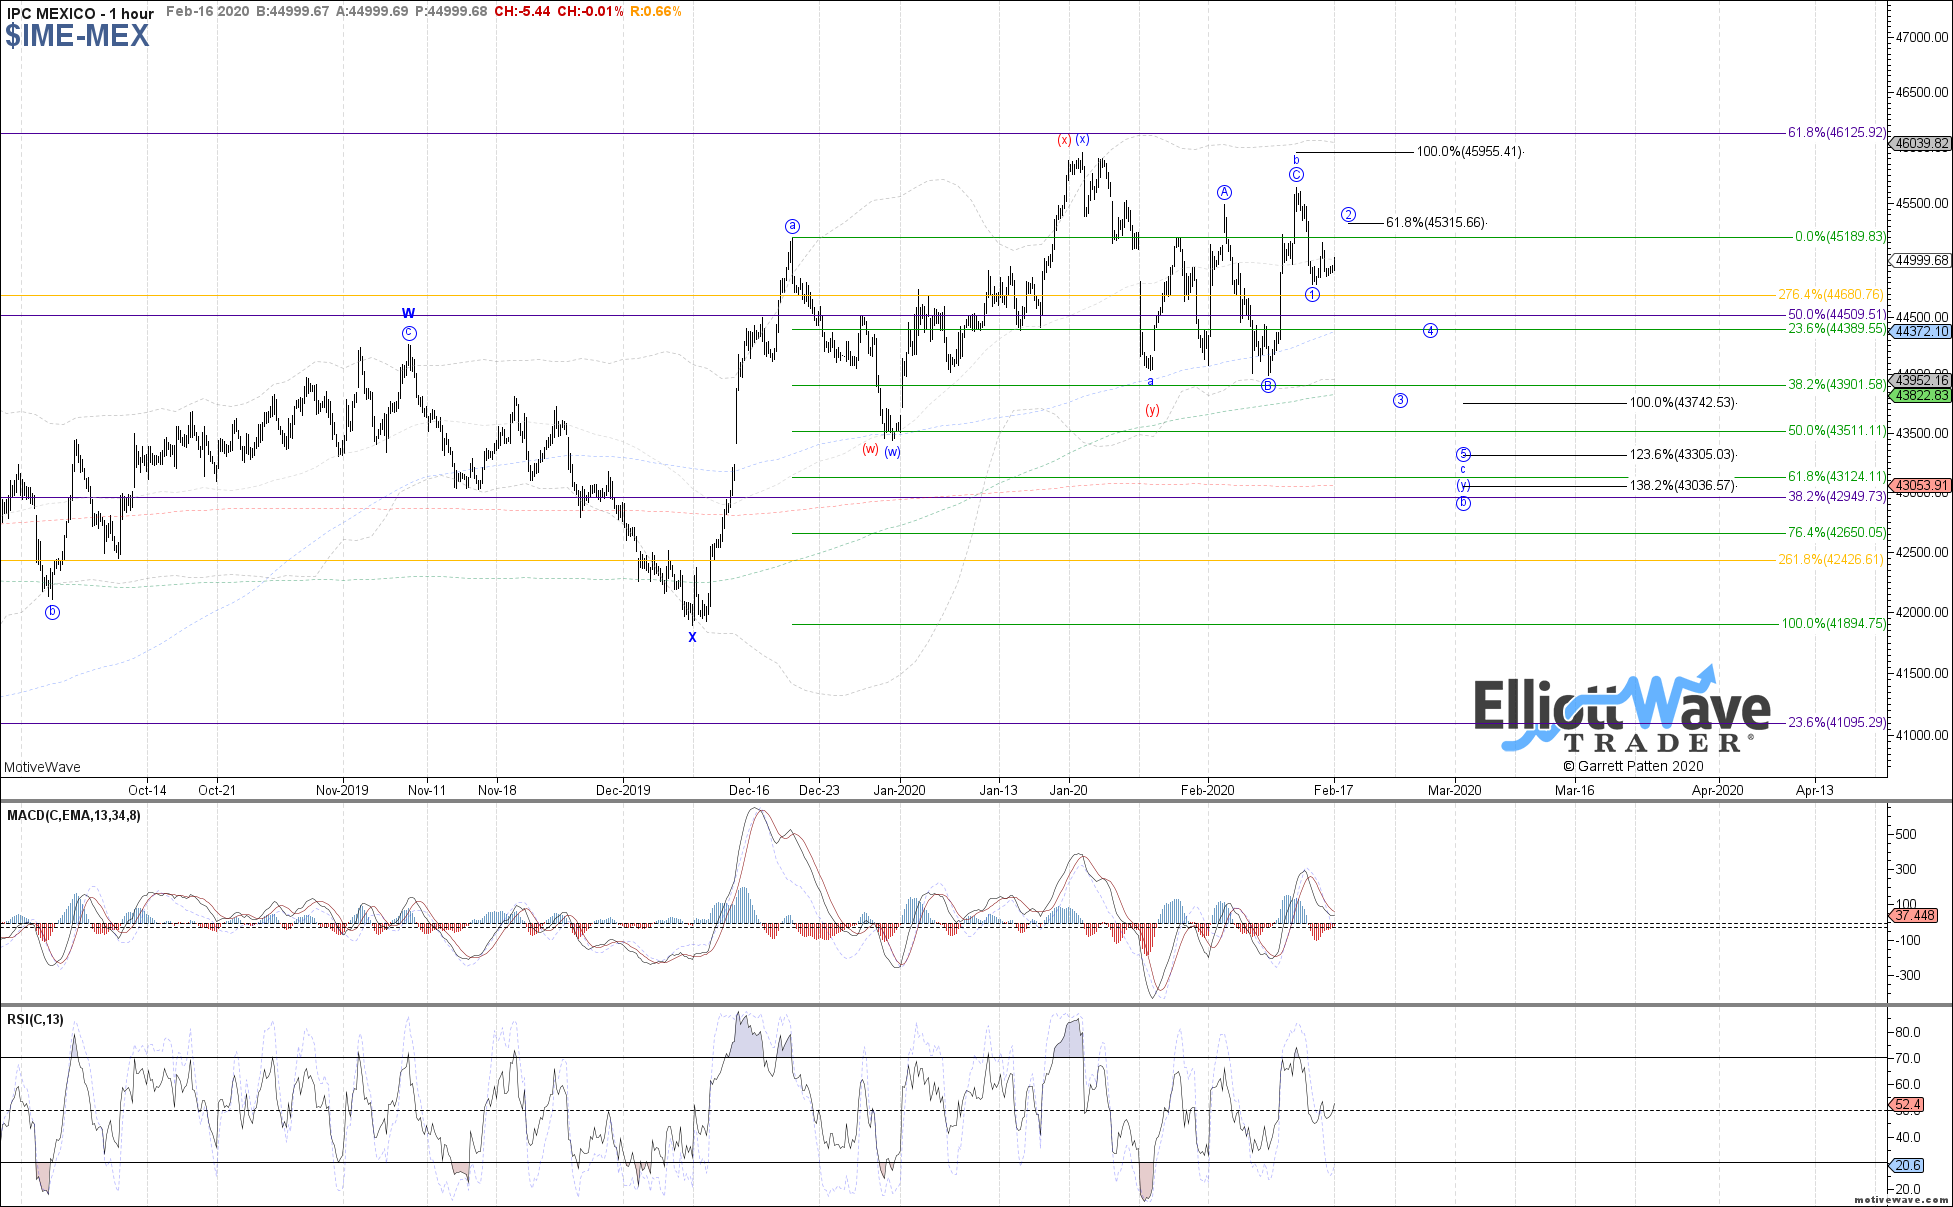
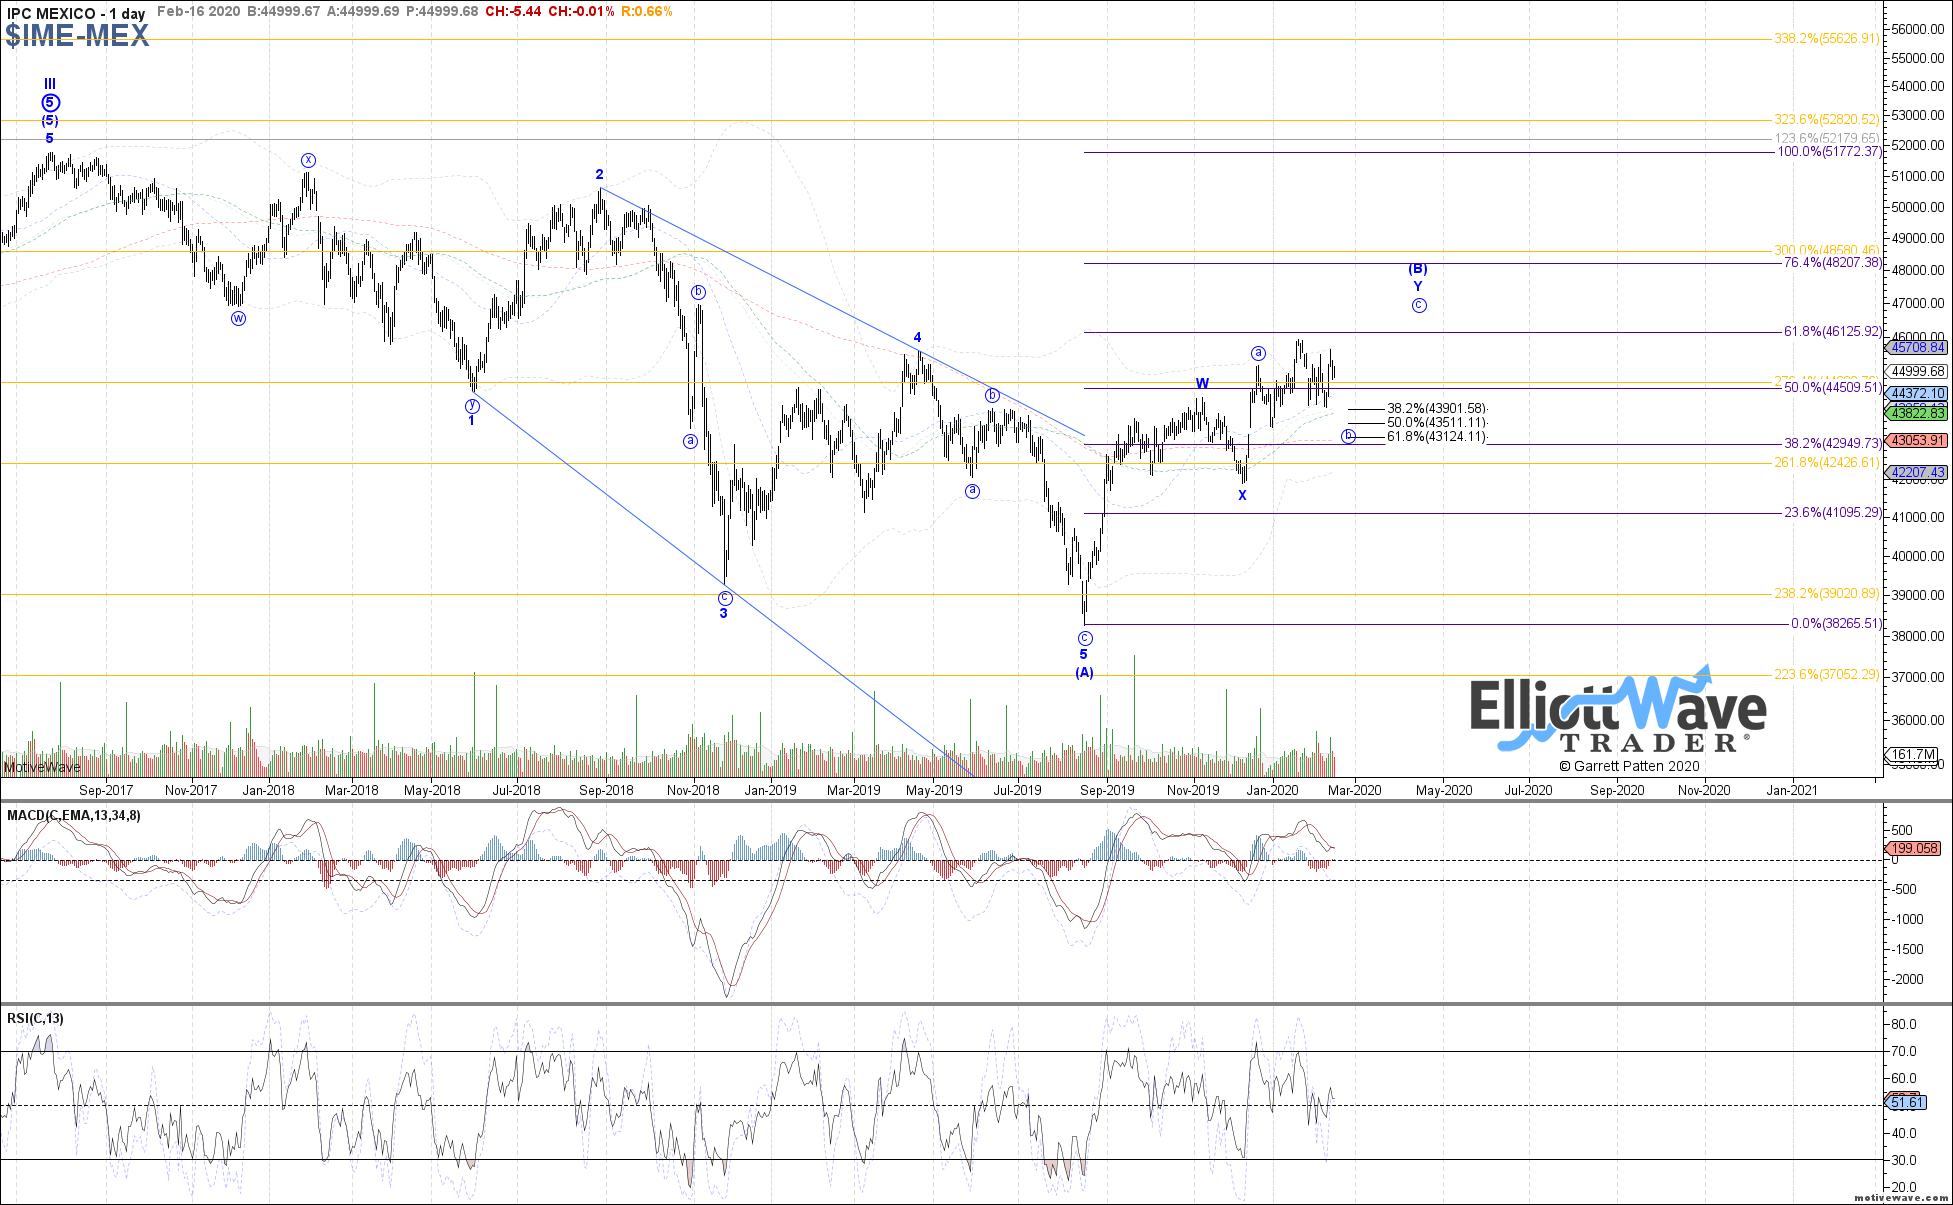
IPC: The IPC traded initially higher last week, filling out the wider flat for wave b like the Bovespa. Price has since curled back down again, ideally as the start to wave c of (y). Under that assumption, a near-term bounce can be seen as wave 2 of c, with 45315 as ideal resistance to hold in order to turn back down next as wave 3 of c. A break back above last week’s high would invalidate the start to wave c lower.