Why I can't Buy the V-shape recovery
Why I Disagree with the V-shape recovery and bottom:
Don't fight the Fed.
4 words I simply cringe at. 4 words that I have heard for years on end. 4 words which mean nothing statistically speaking. 4 words that any cherry picking lazy analyst or investment professional uses.
Why its easy. Its simple. It is an easy scapegoat. I heard these words at 3390 SPX in February. I heard these words in September 2018. Both before epic sell offs. I have heard them on the way up too, many time over.
So where exactly does this indicator work? One can not use these 4 words so casually yet in such high analytical tools yet only use them when the market is going up? That analyst is being nothing but intellectually dishonest.
I will move on. I have prepared a very long Analytical presentation of my thoughts on the market over the intermediate term. I have a process/system/rubric that I use and have built through many cycles dating back to 2007-2009. My preference is when the whole enchilada is in alignment. Those are the strongest signals. This process had all systems fire off in early 2020, and more so when we broke Trend in Late February 2020, right before the crash.
Today, as we sit nothing has changed in my work other than price going from 3300+ down to 2191 lows....and now back to a recent high last friday of 2818, and a close today of 2761.
When a Market gets smoked like it just did, and creates an inordinate amount of technical damage, in my experience it doesnt just lift back up and out and rocket launch to new highs. I know i know Dec 2018 is in everyones recent memory. I outlined plenty of times over the past few weeks that that was uncommon, and not the norm. Another
Economically what we are going through is the same thing really as technical statement above. We have seen a lot of damage. This will take time to properly work through the system. From an Economic Data front, to unemployment to Sales on SPX and ultimately earnings.
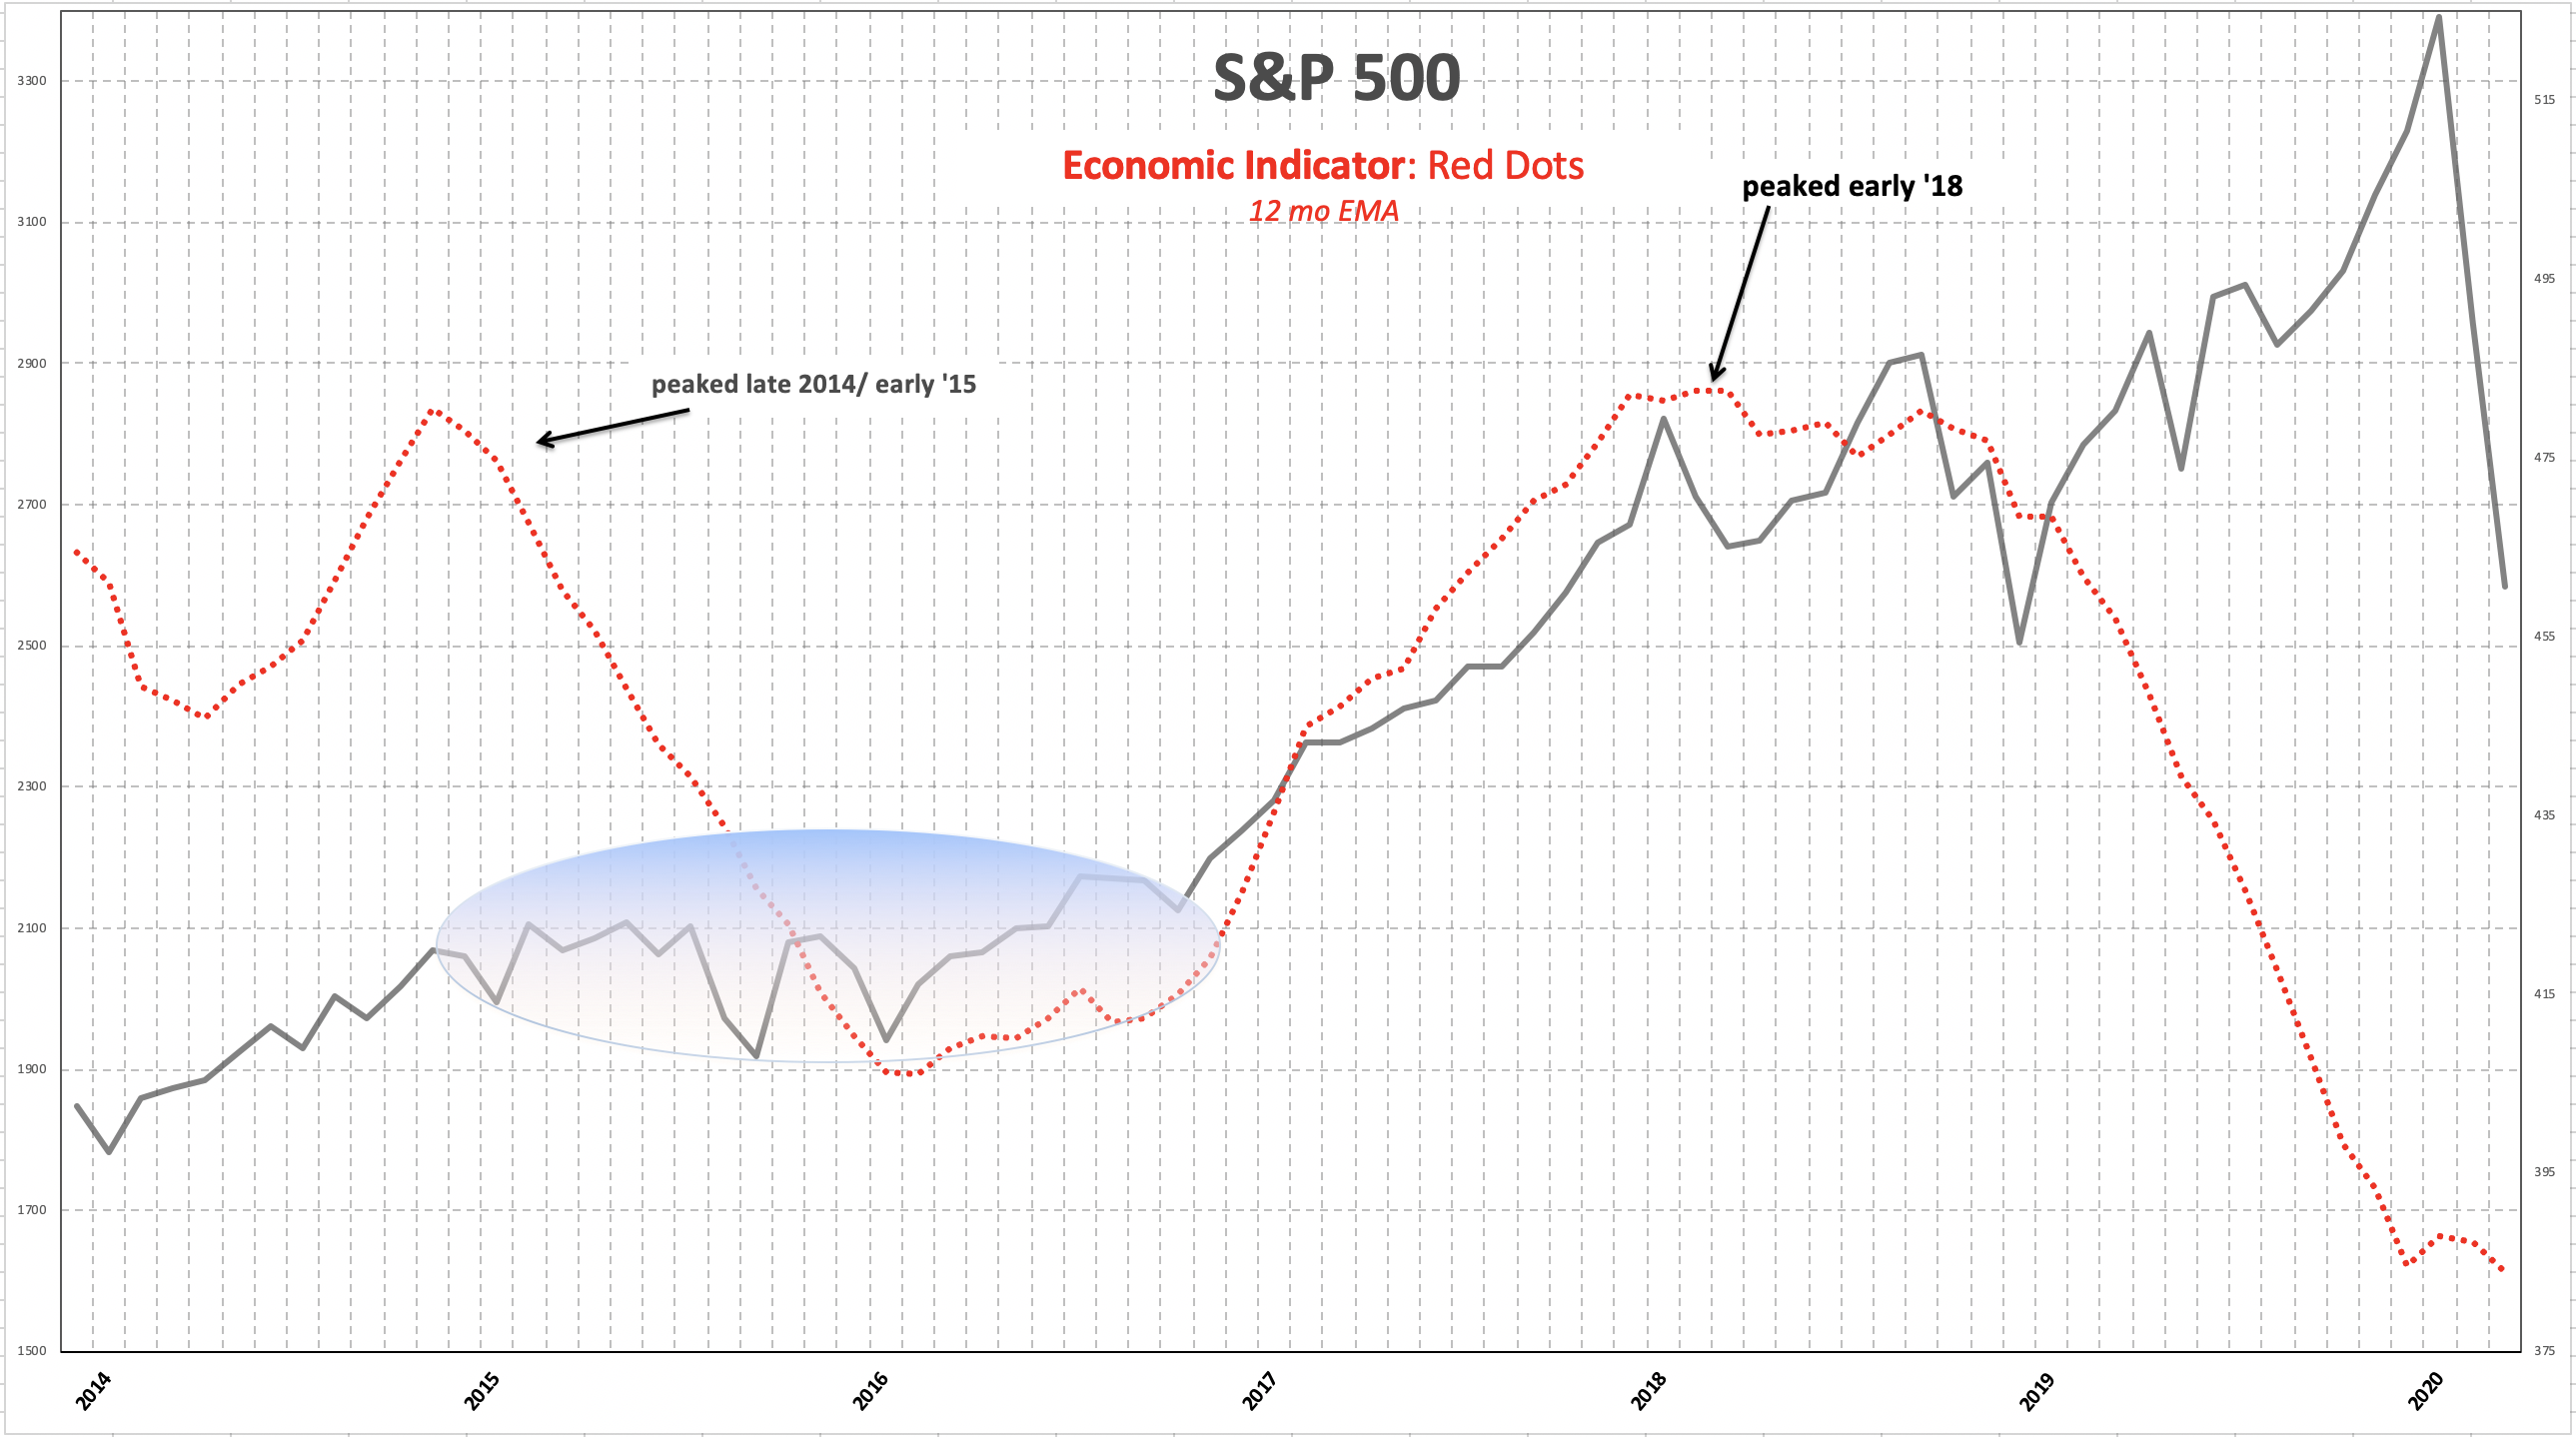
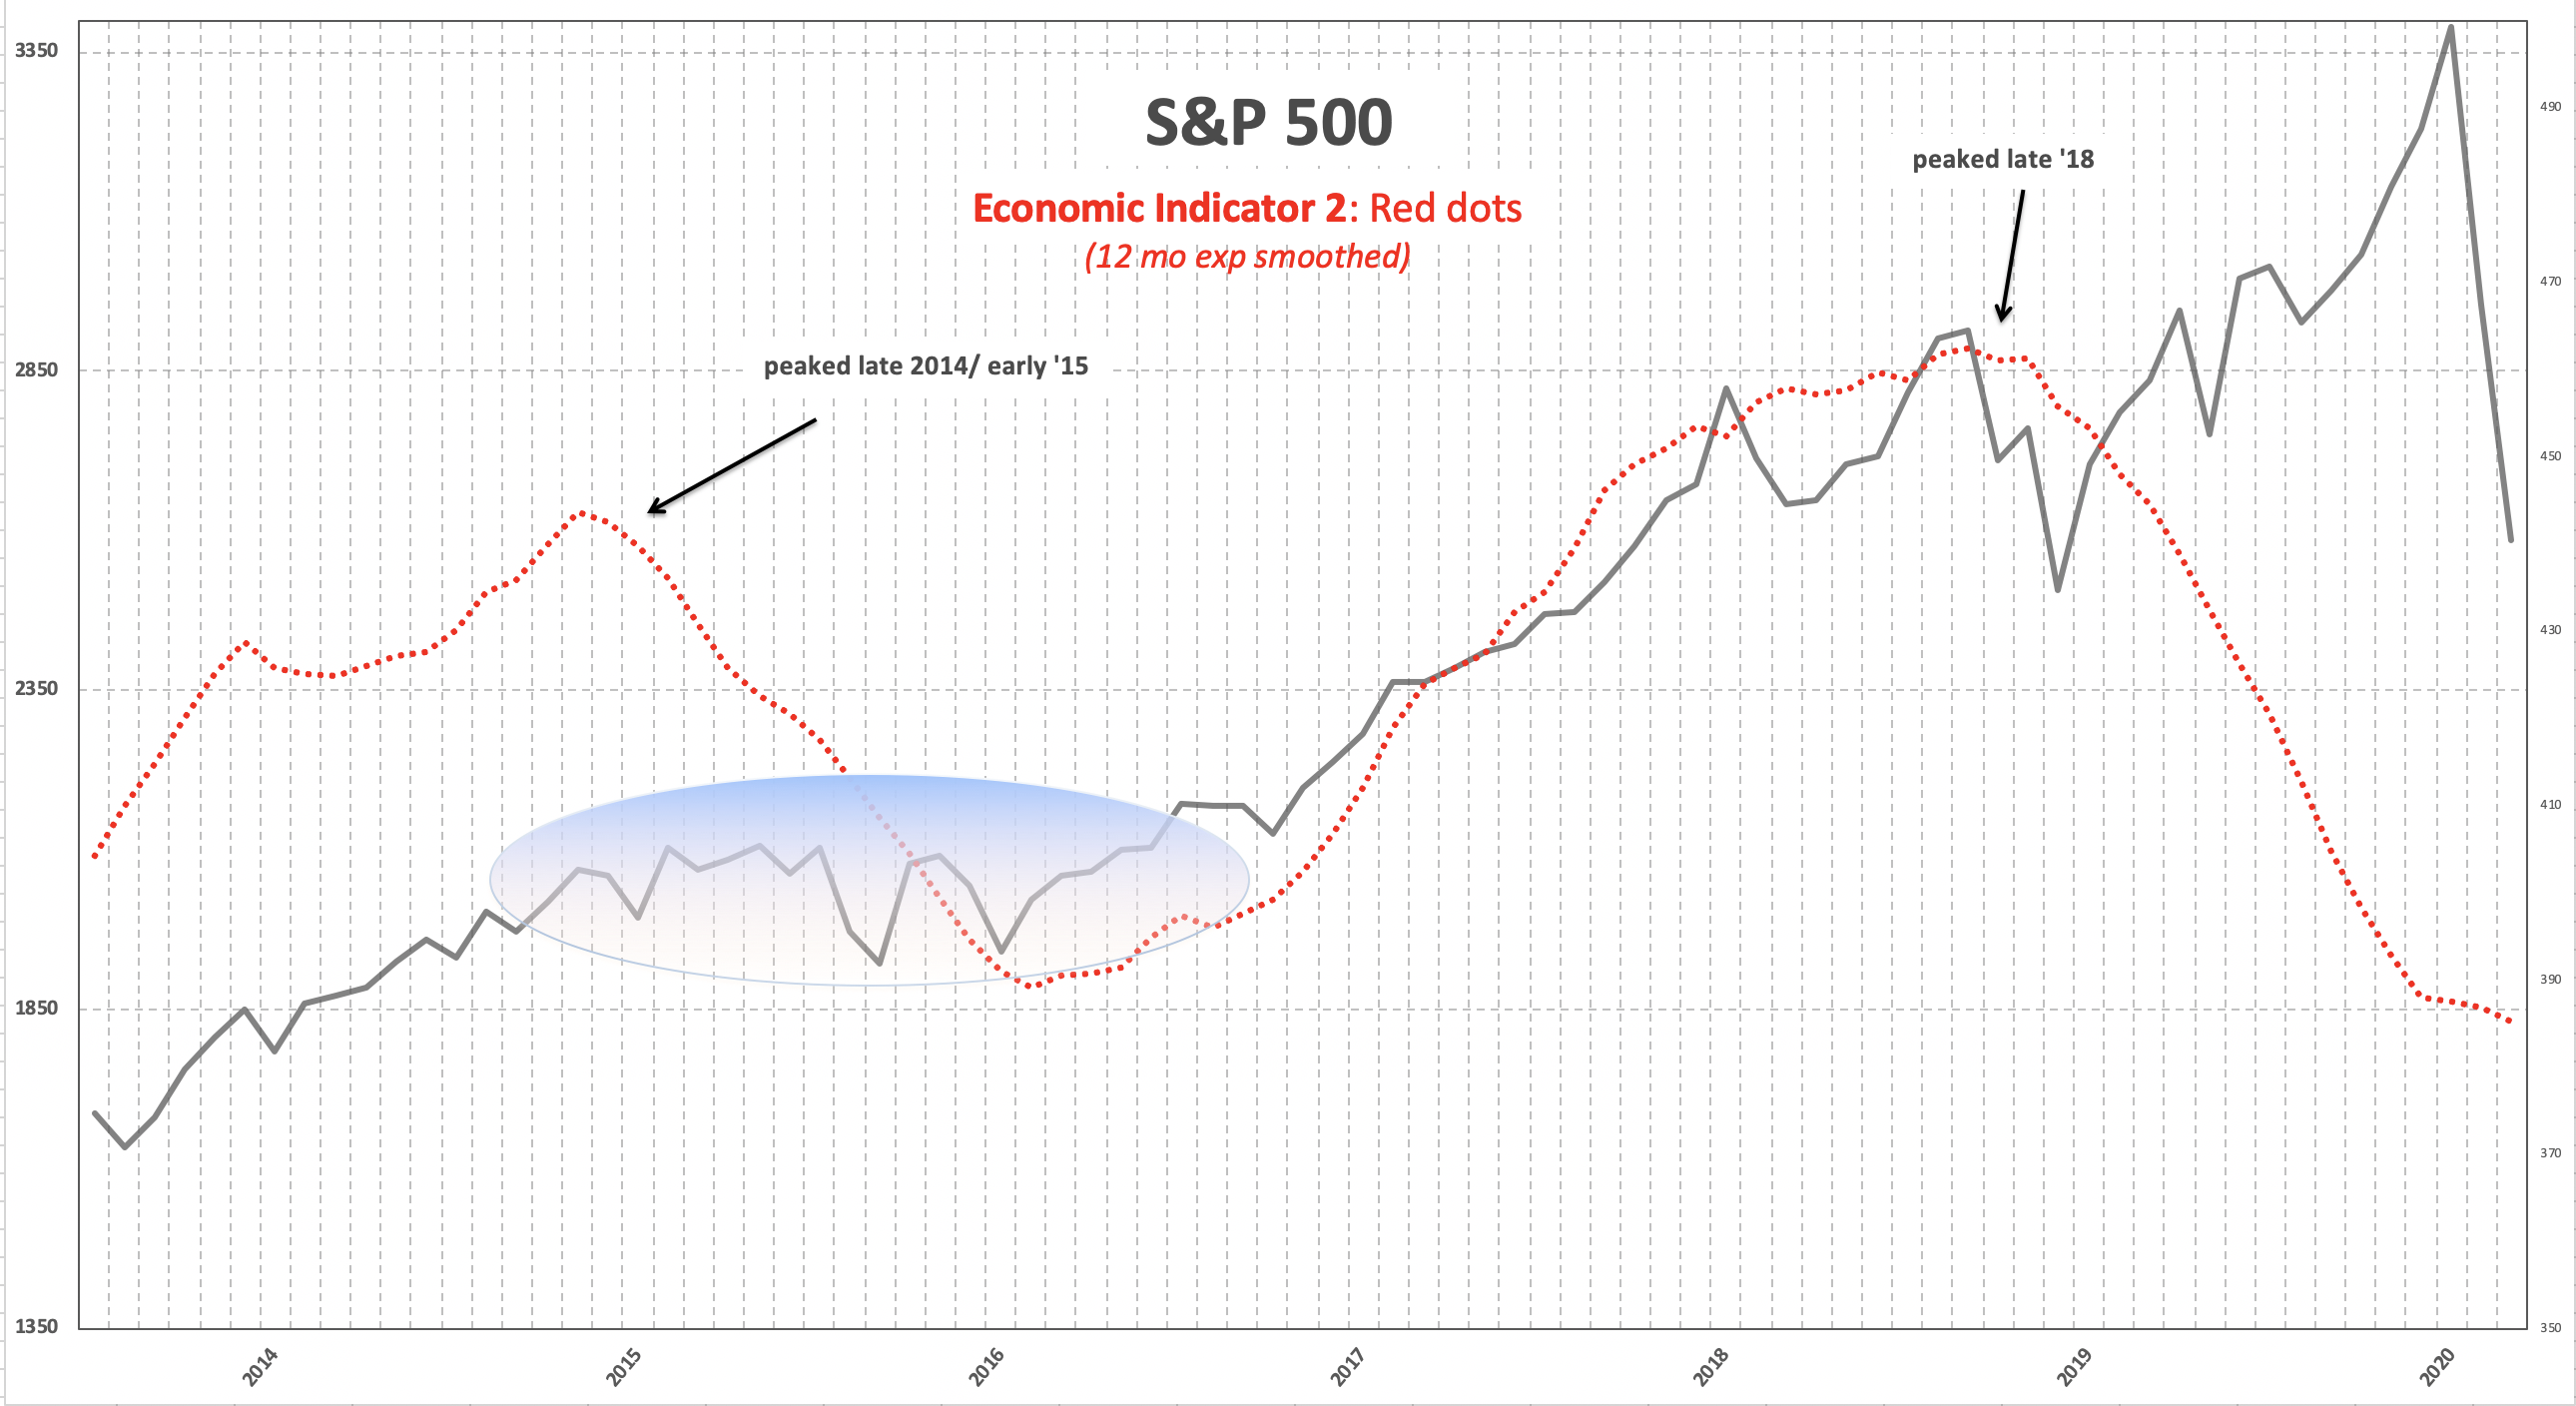
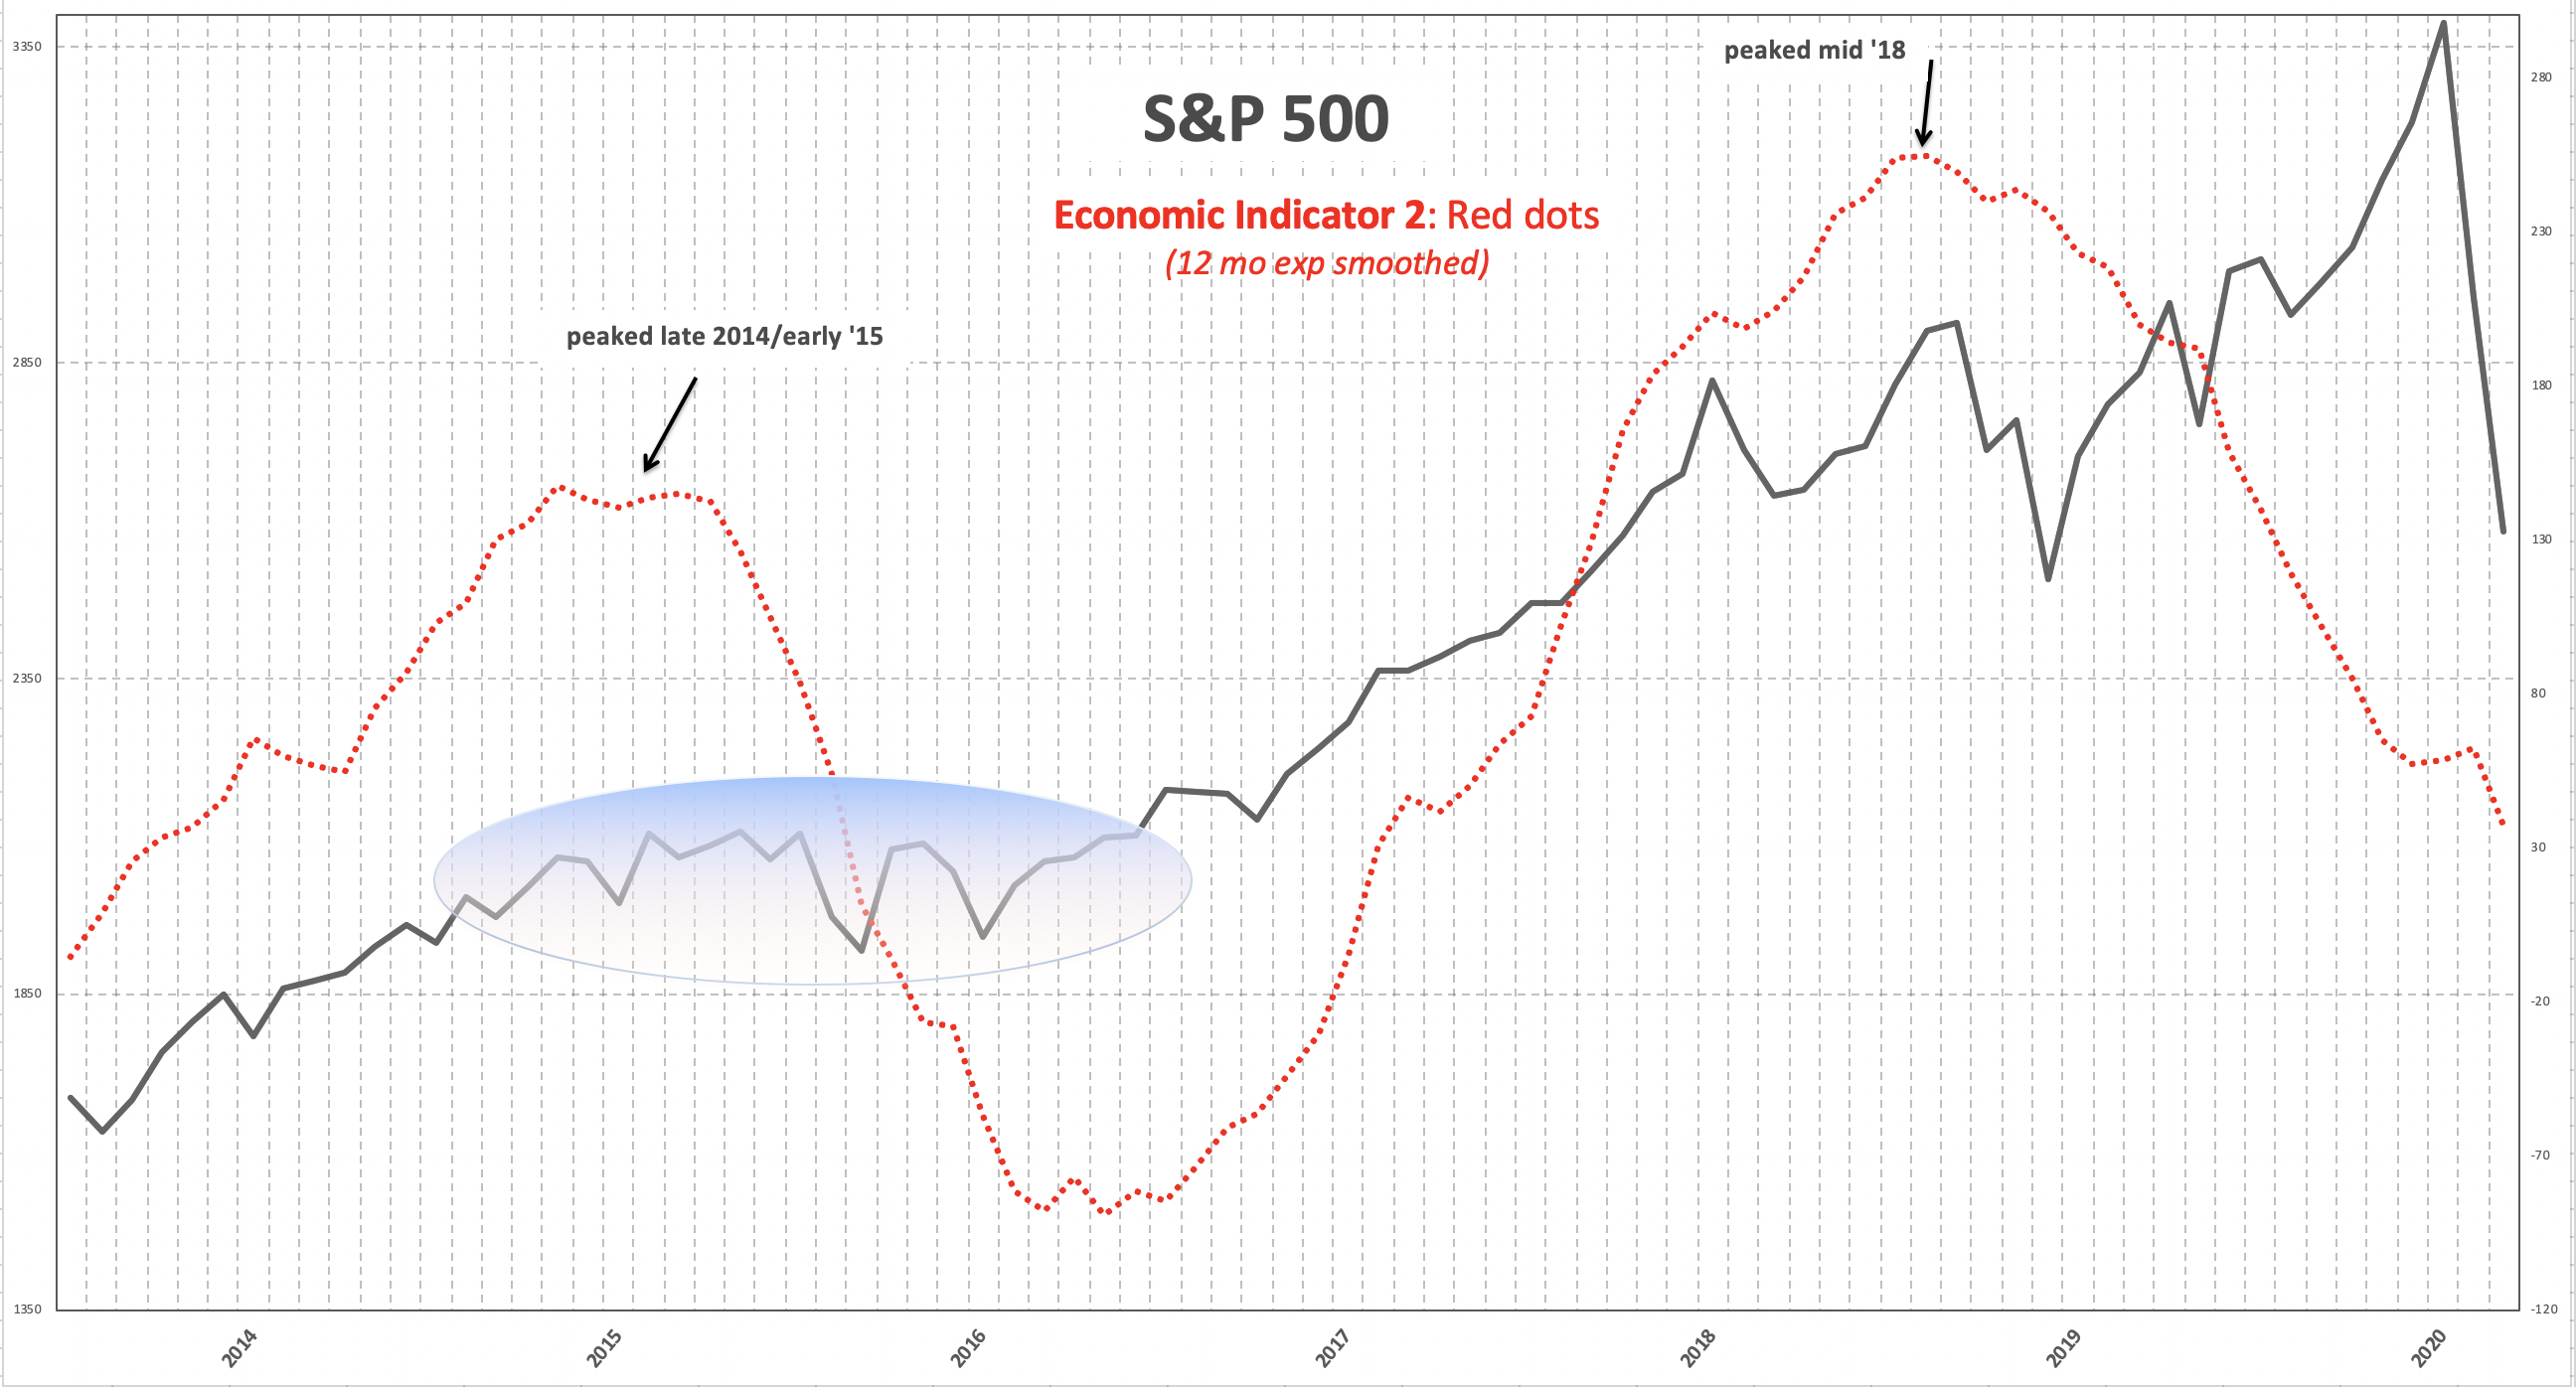
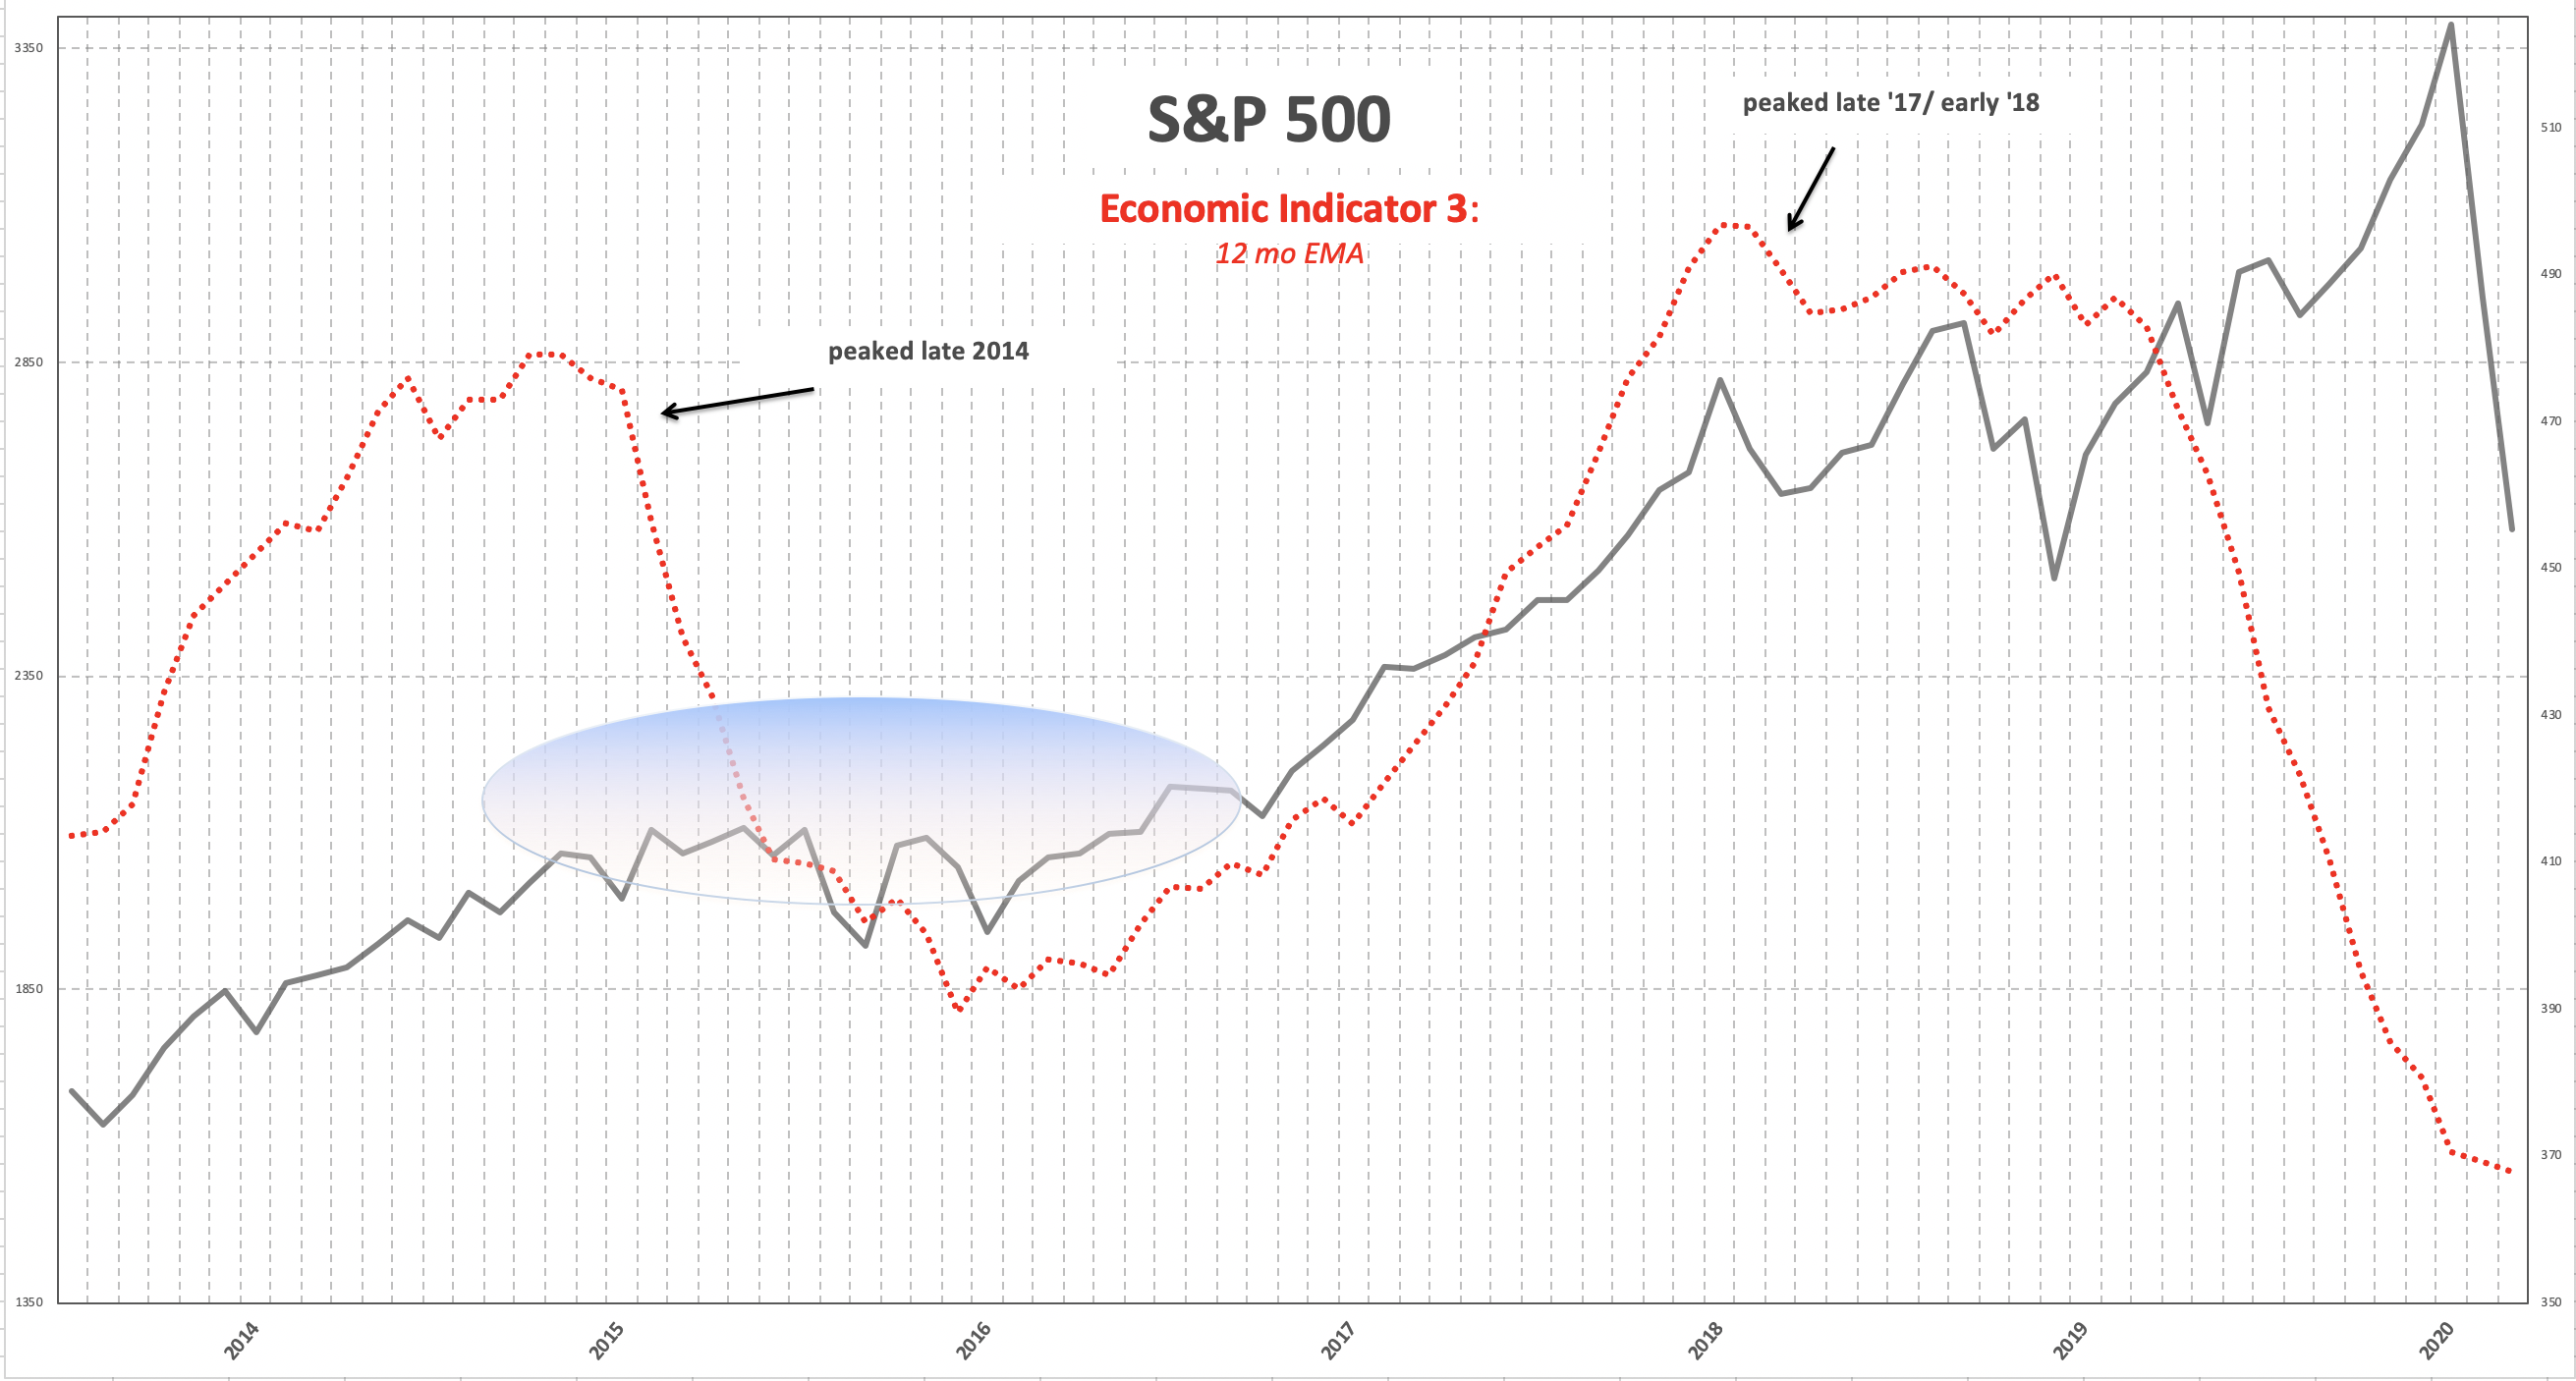
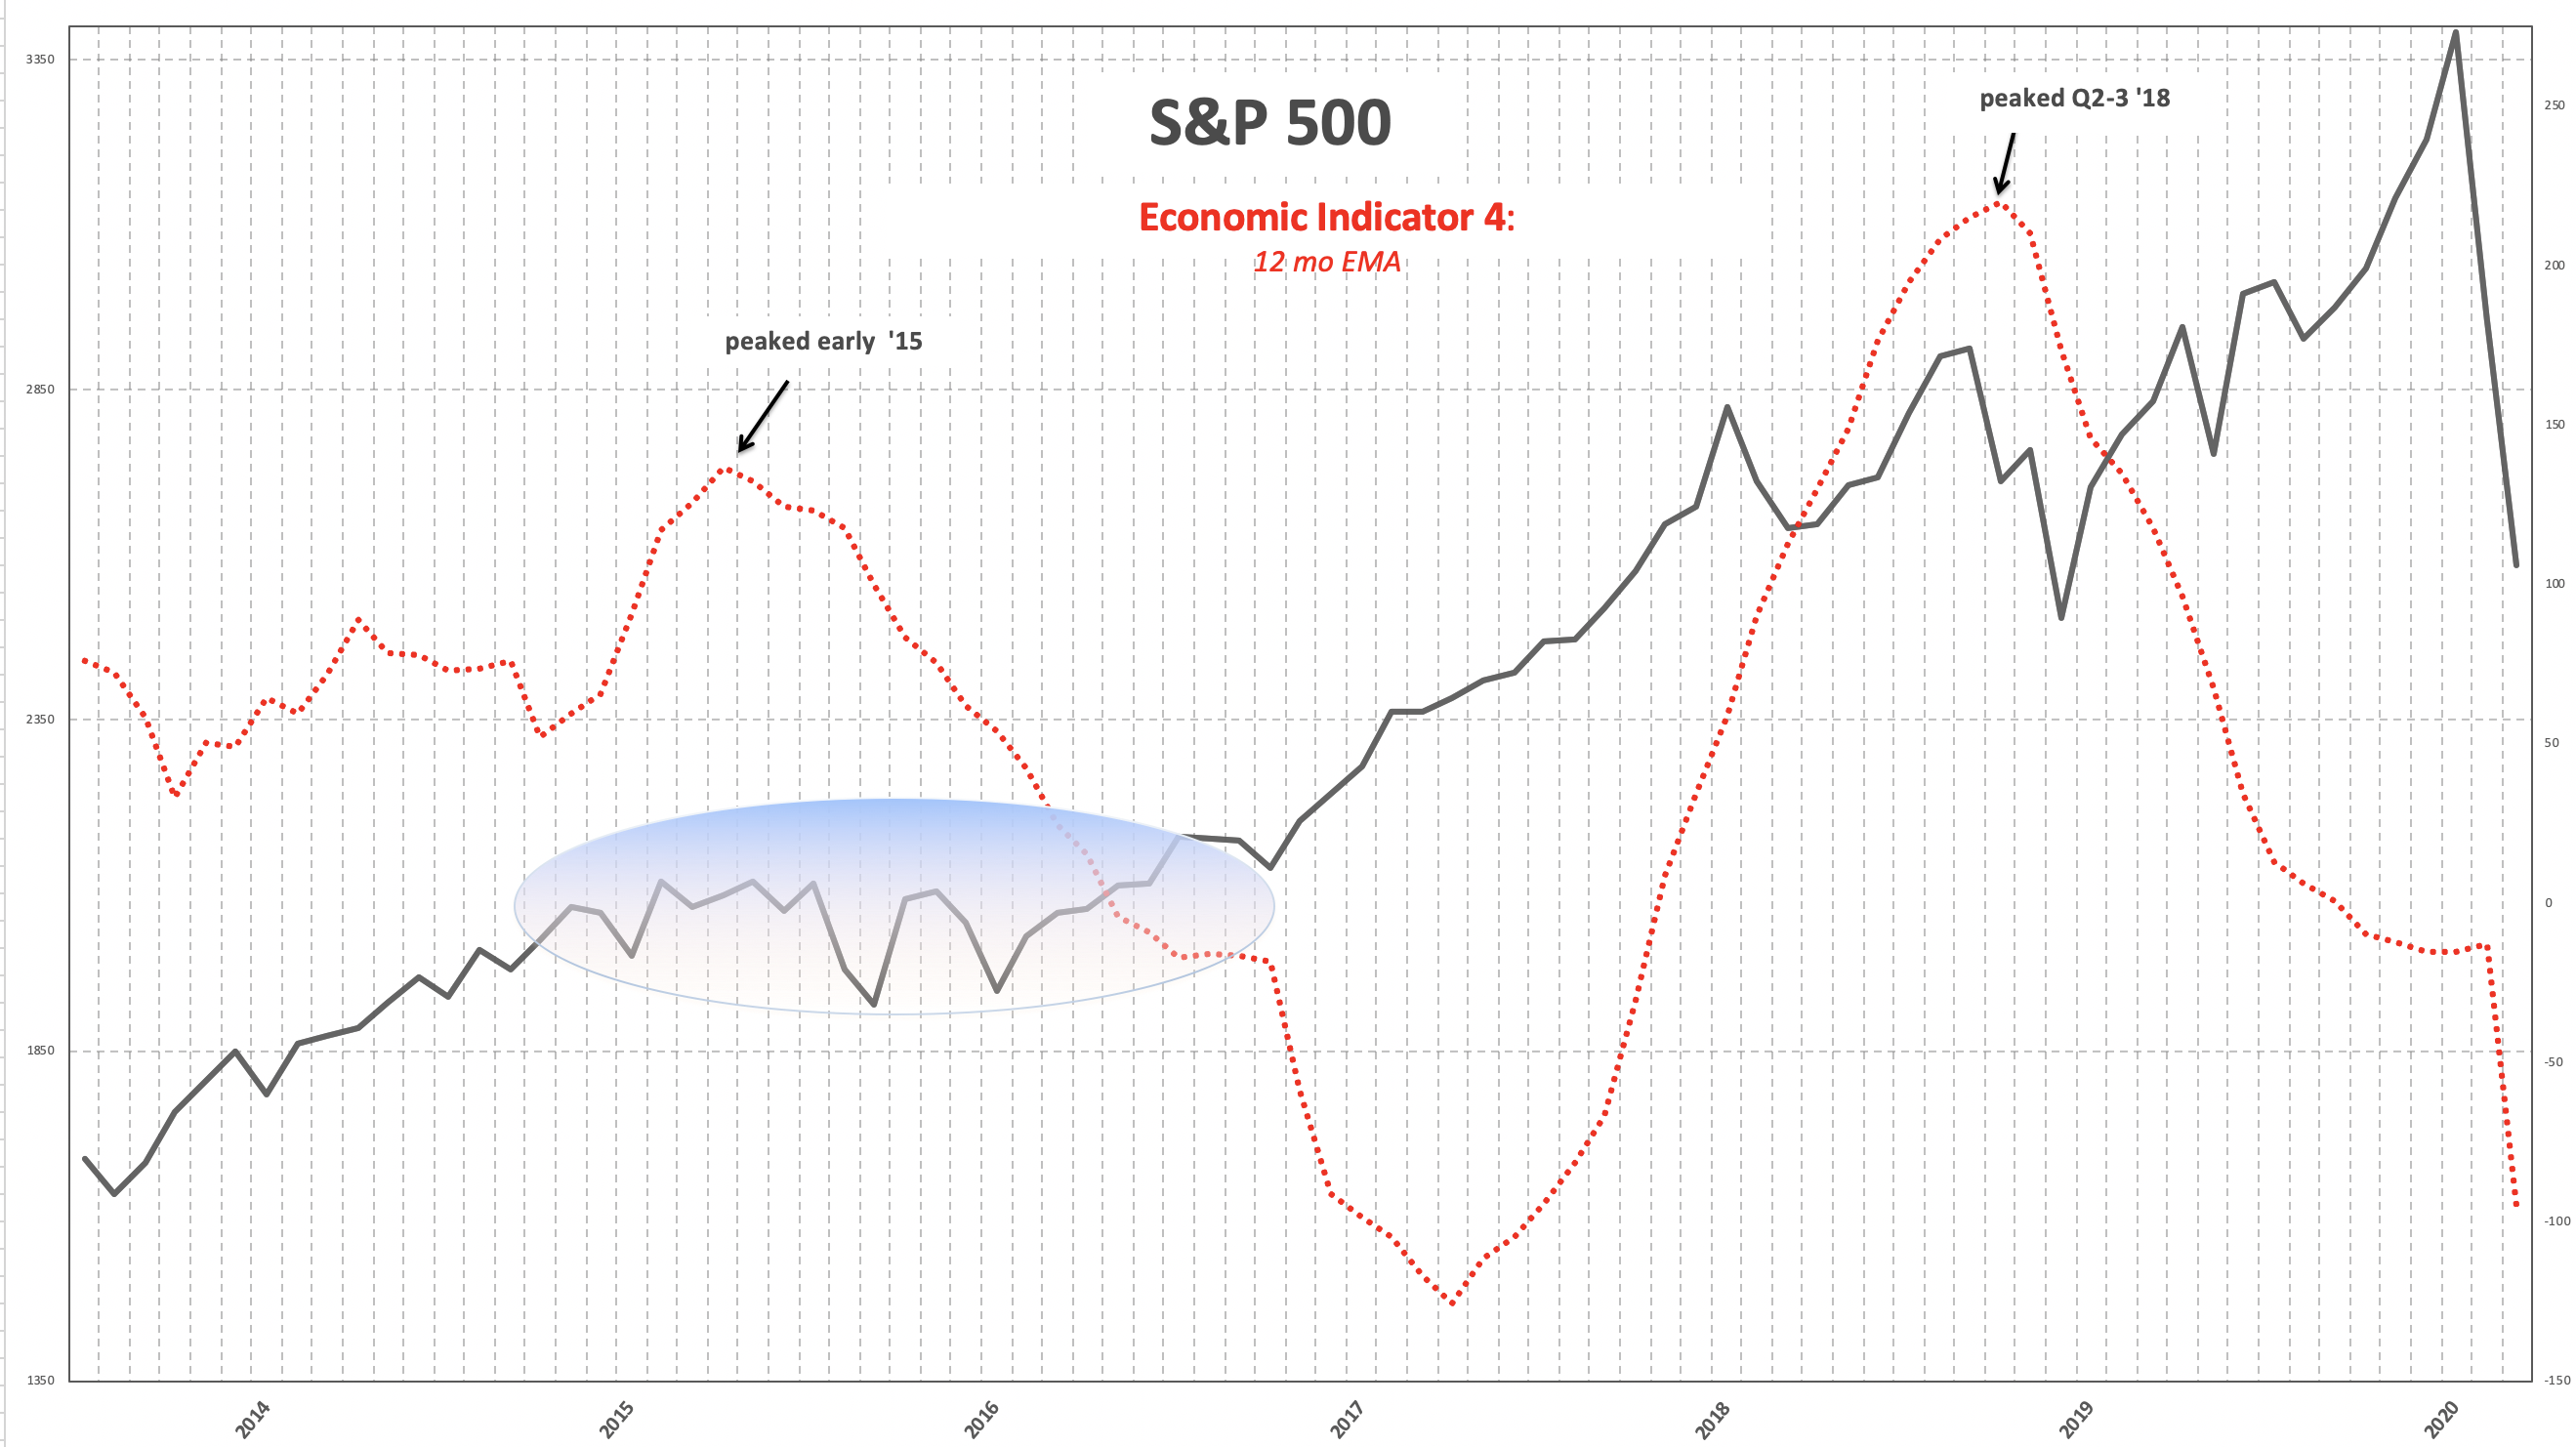
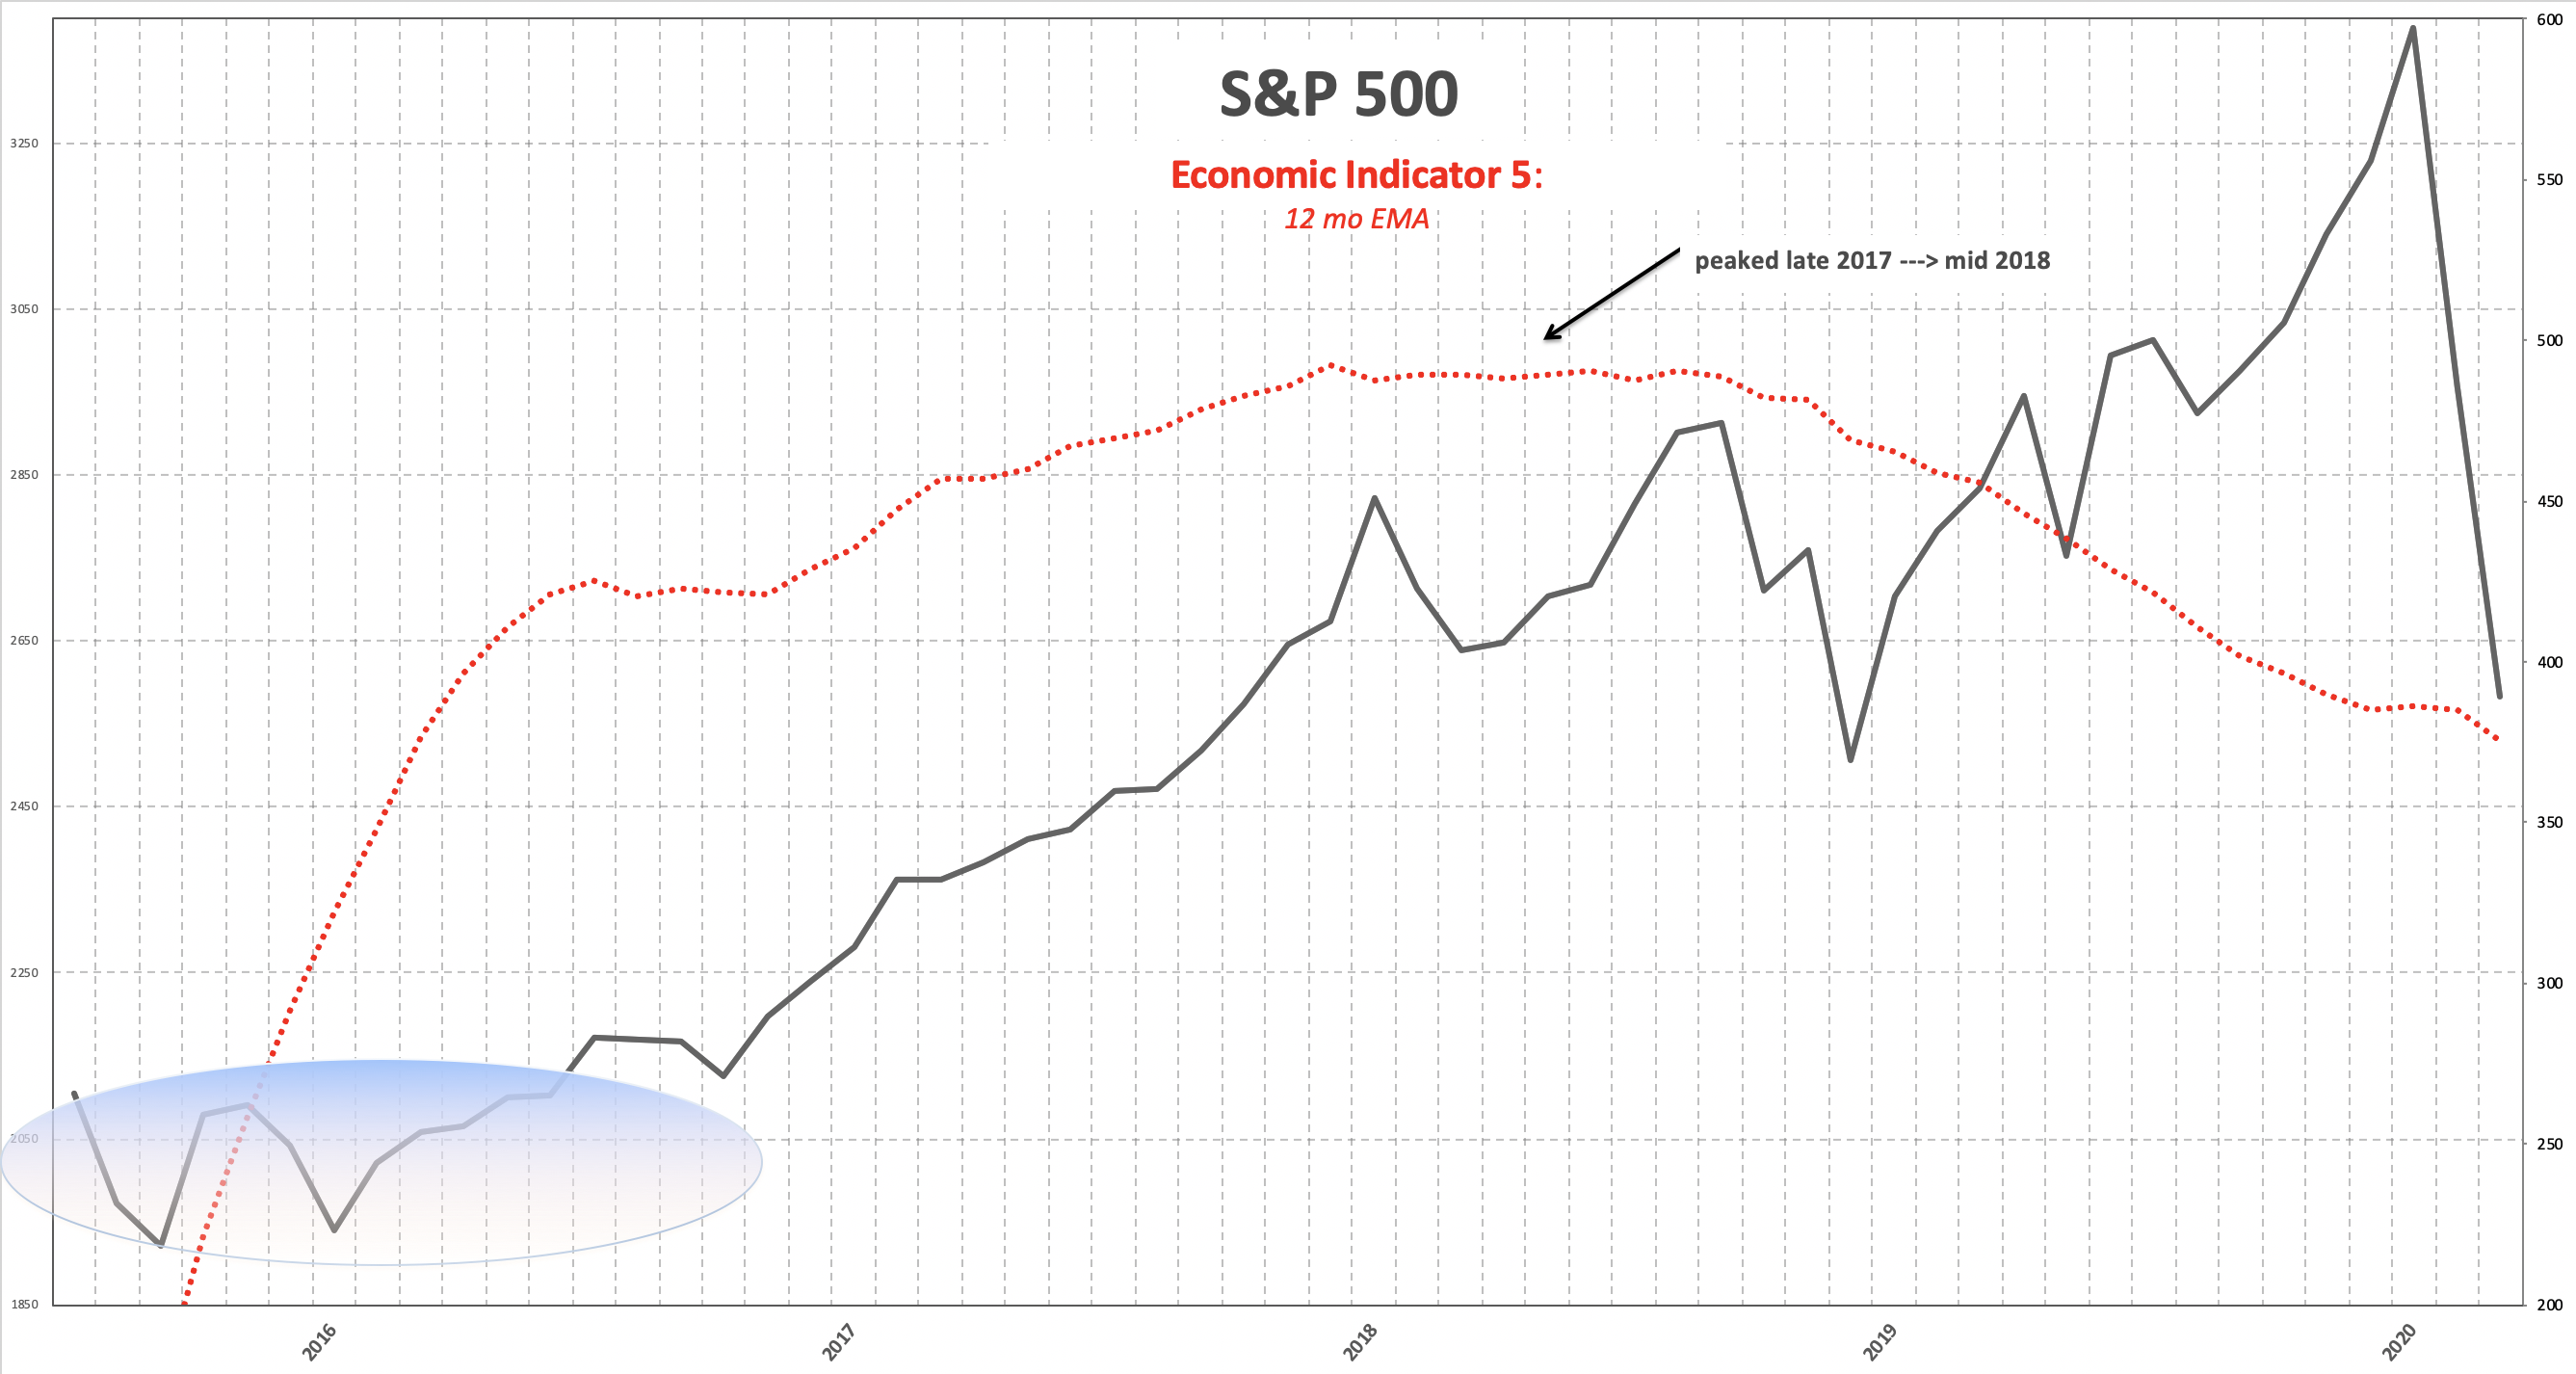
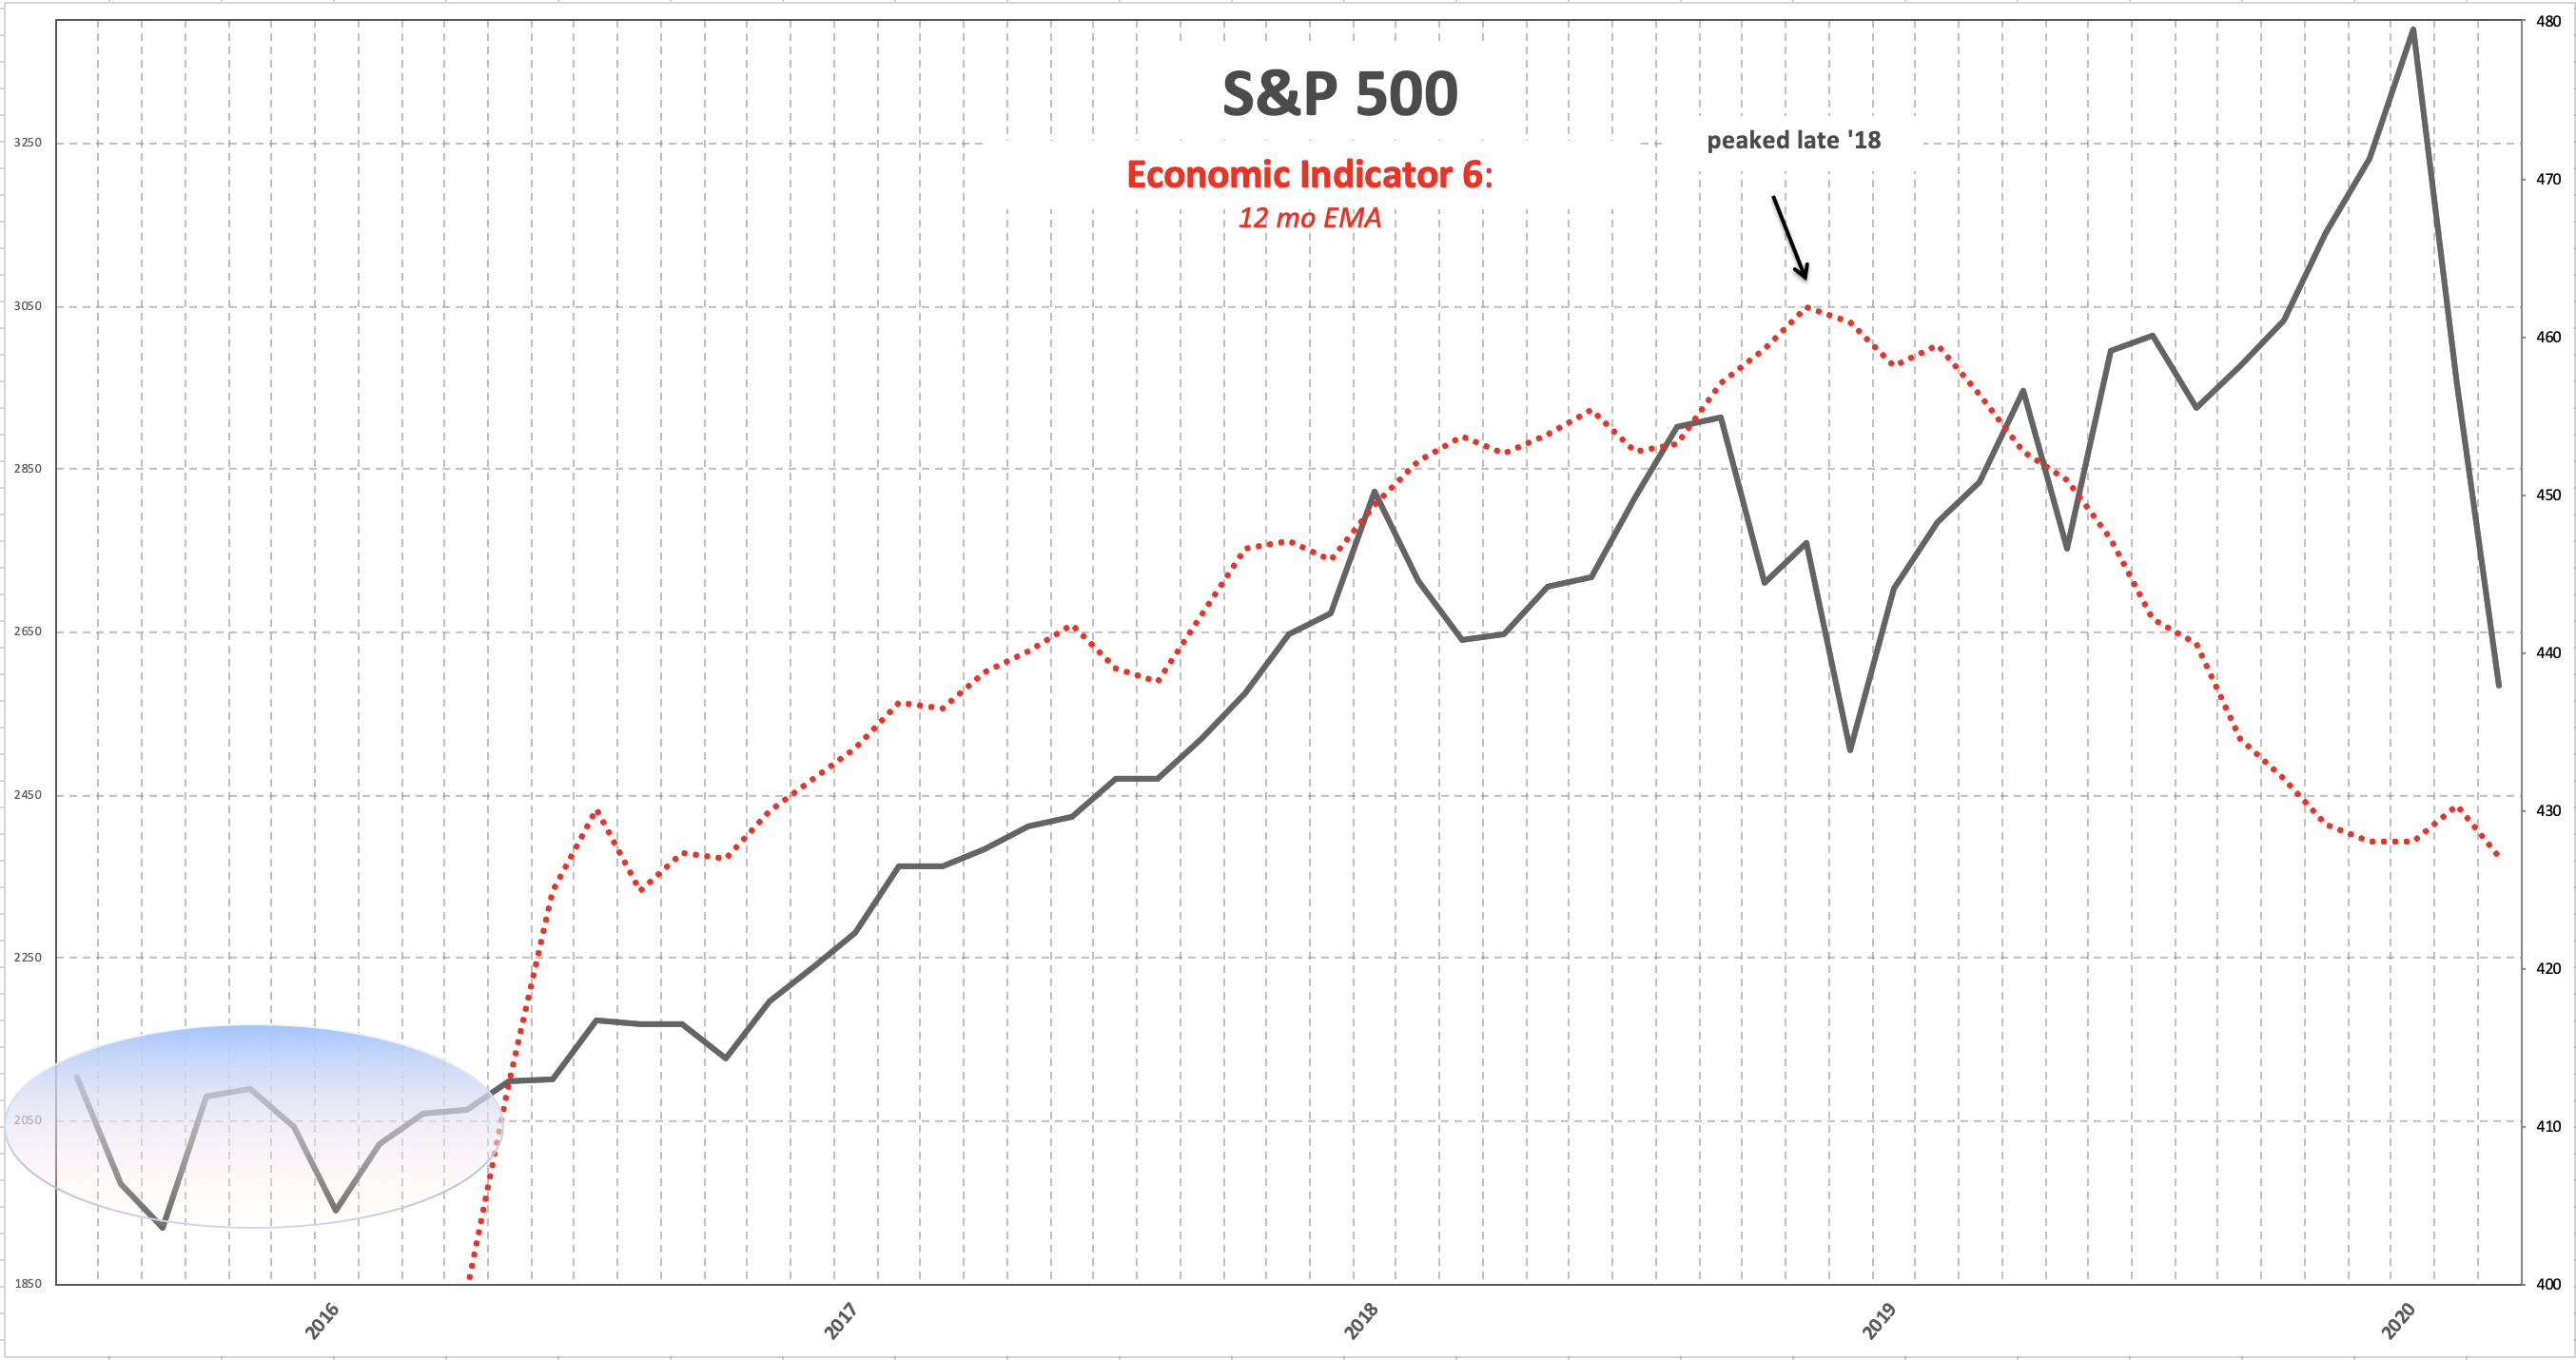
Here is a handful of examples of some of the econ indicators i track. In all likelihood these will take months, if not quarter to properly heal and start to base and work higher. The benefit of them is that we will soon enter trough like bad numbers over the next year so the rate of change up will be easier to beat.
As you can see, none of them look very good...and no I don't think the worst is over ie March was worst....
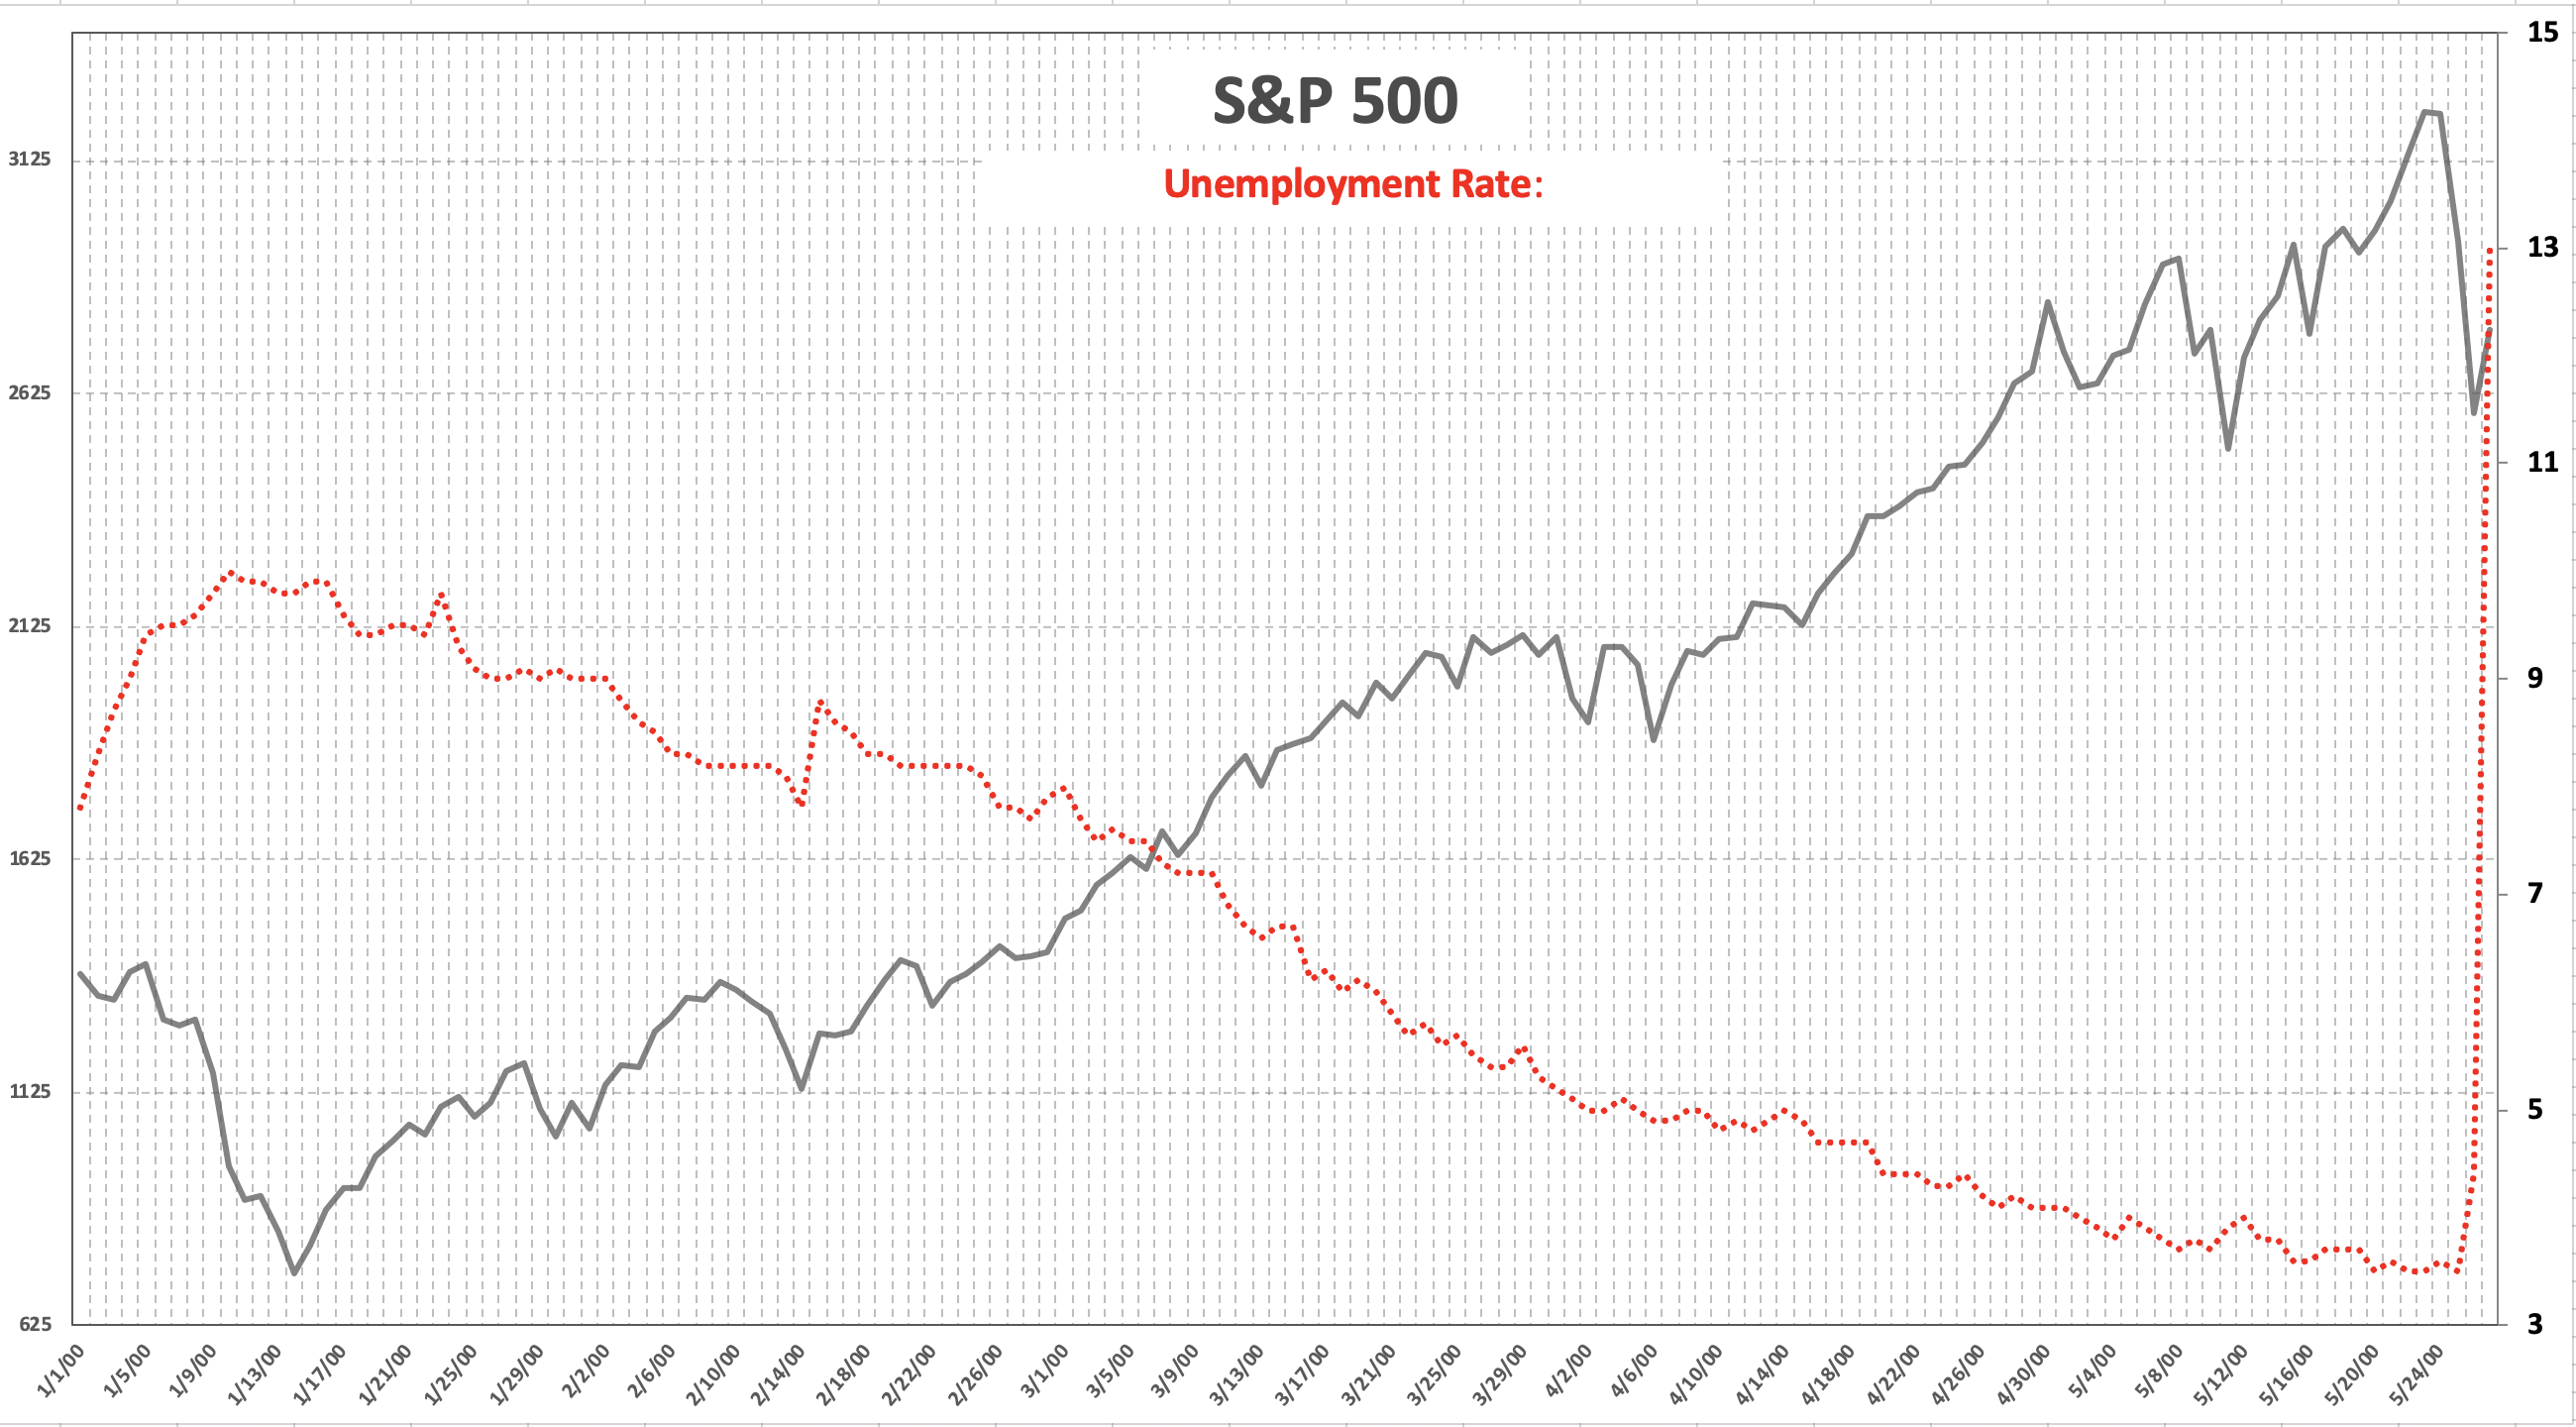
The unemployment rate is now Blowing out to the worst we've seen...like in history....we are well above the Financial Crisis. I don't think this is a 1 up deal either...I think we will be working through a Glut of Supply (job seekers) for fewer job openings for the foreseeable future.
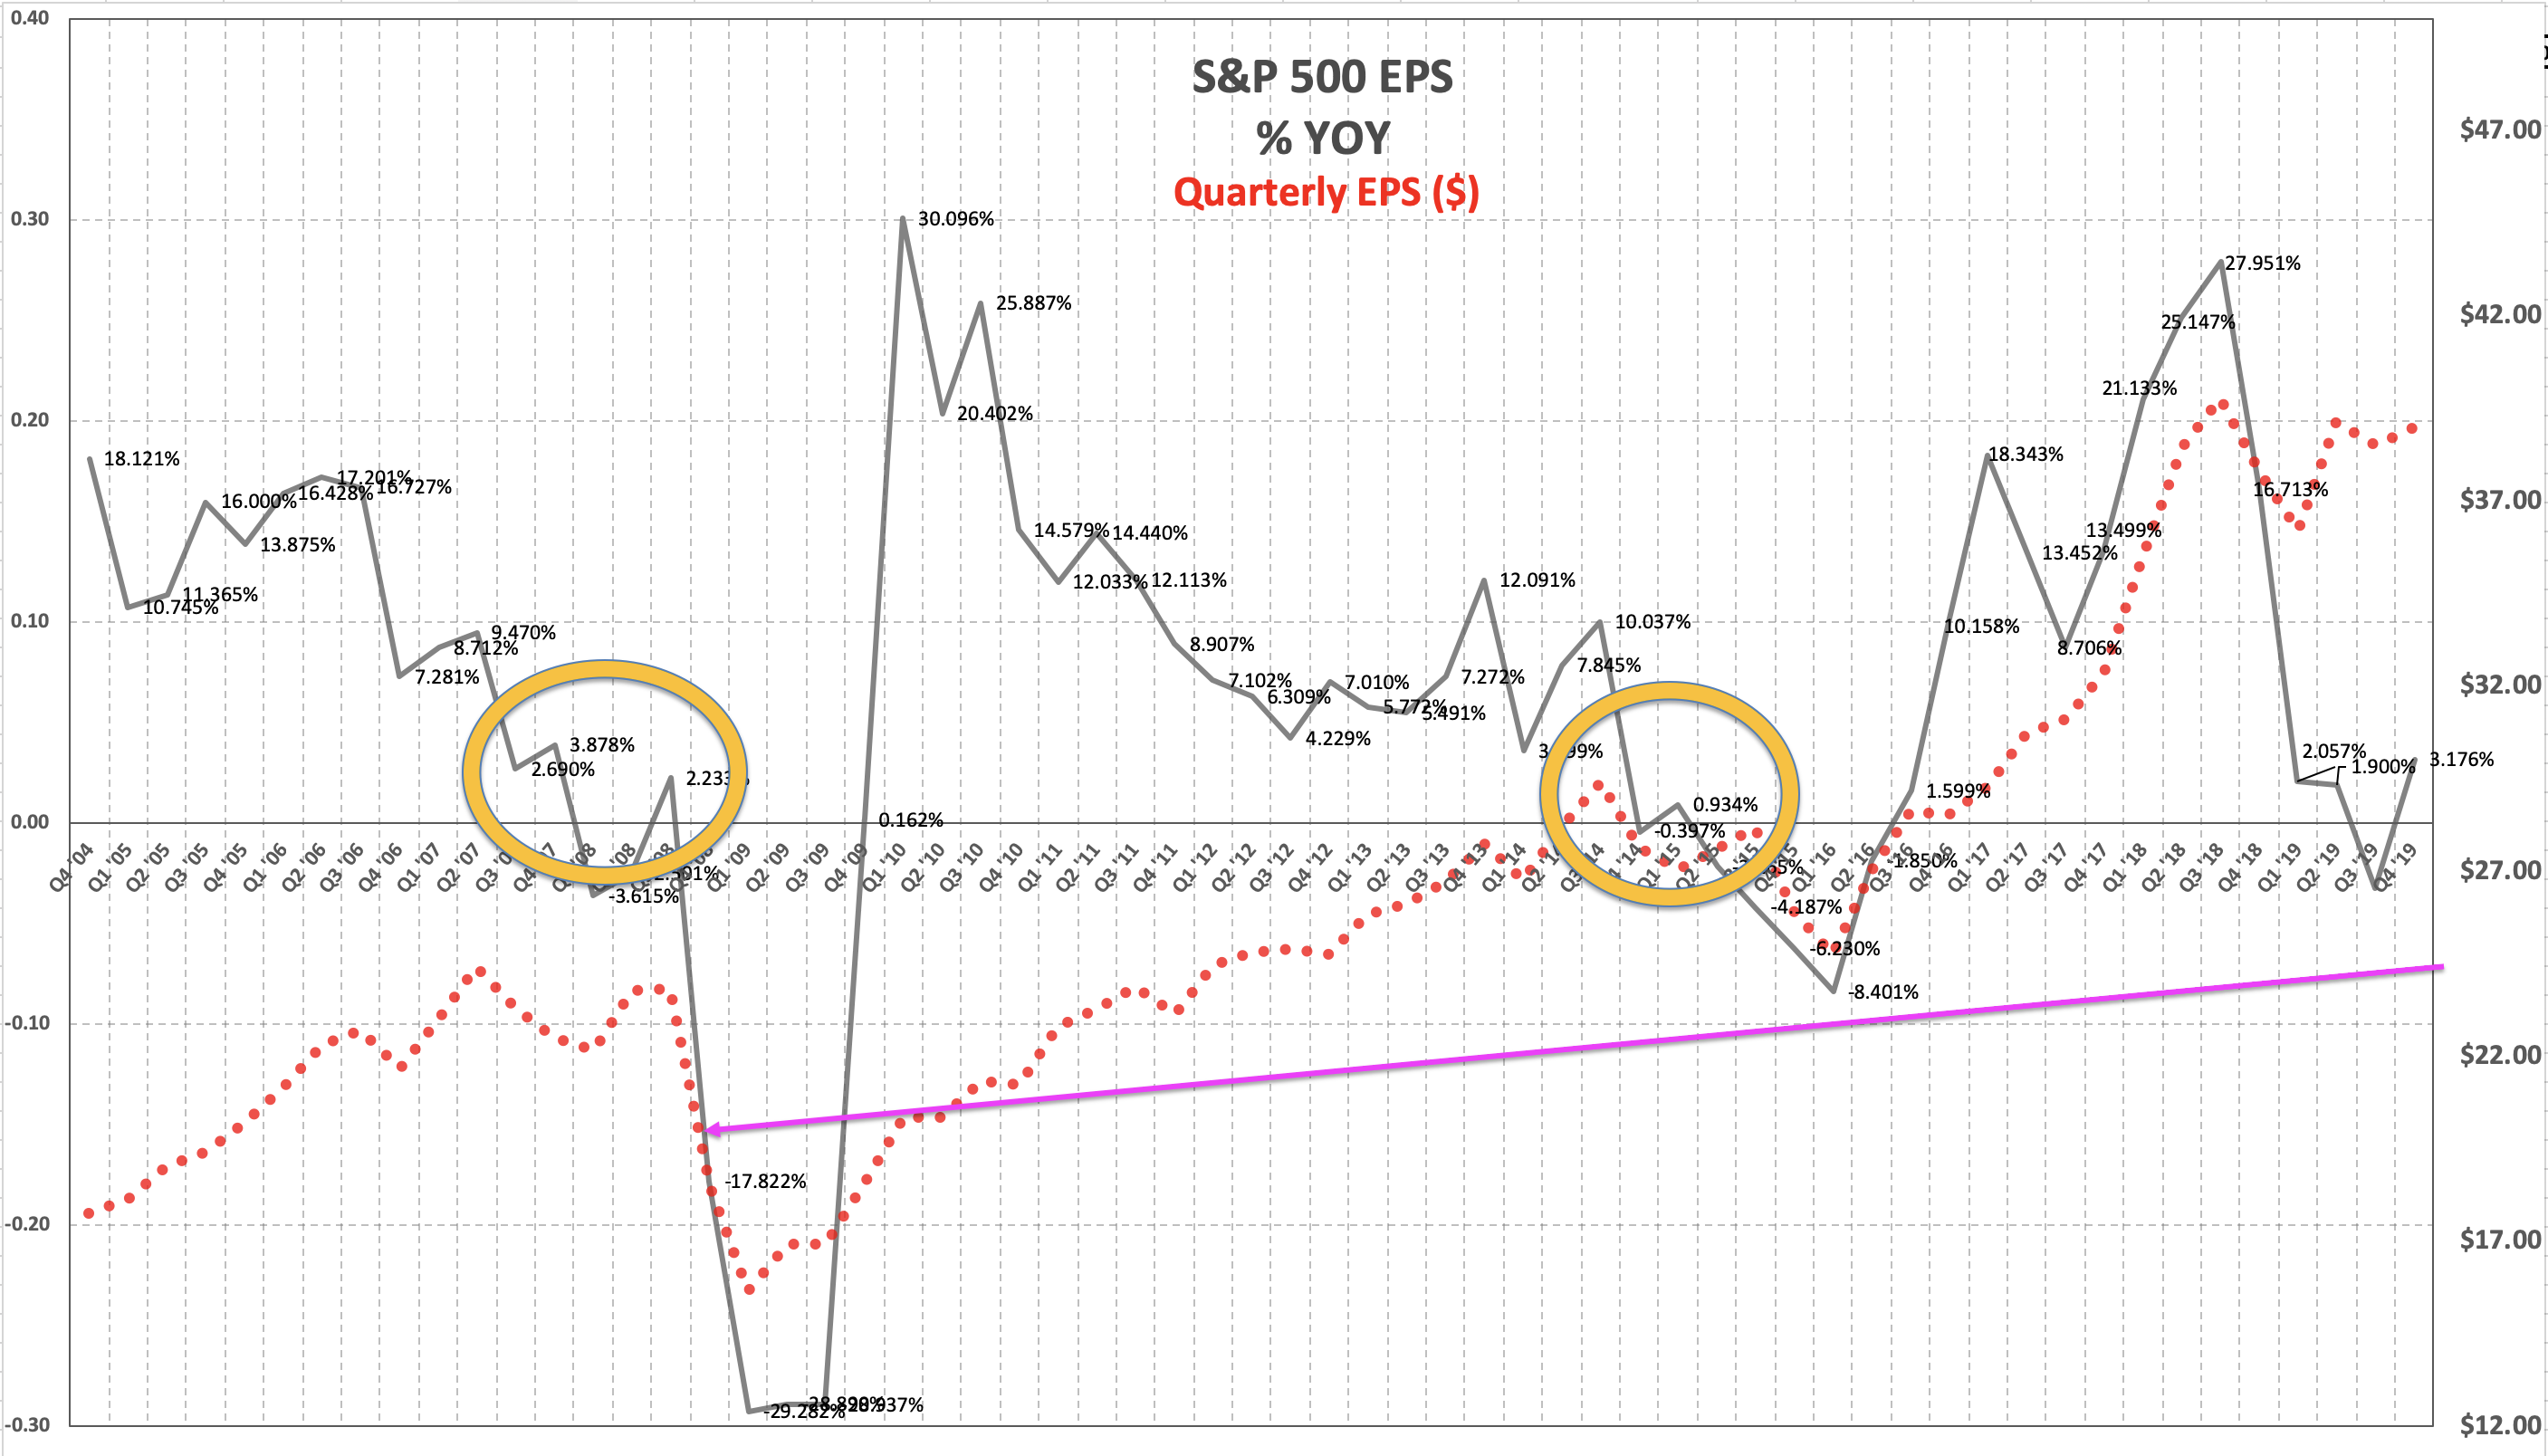
Earnings are about to fall off the cliff for Q1 and likely Q2 2020....I wrote up the Earnings Growth front in 2019 how it was already (way pre covid-19) setting up a lot like 2007/2008 and 2015/2016...ie basing at very low growth to unload lower...well we are going to see a down 20% likely coming soon...i arrowed the similarity to the 2008 drop....
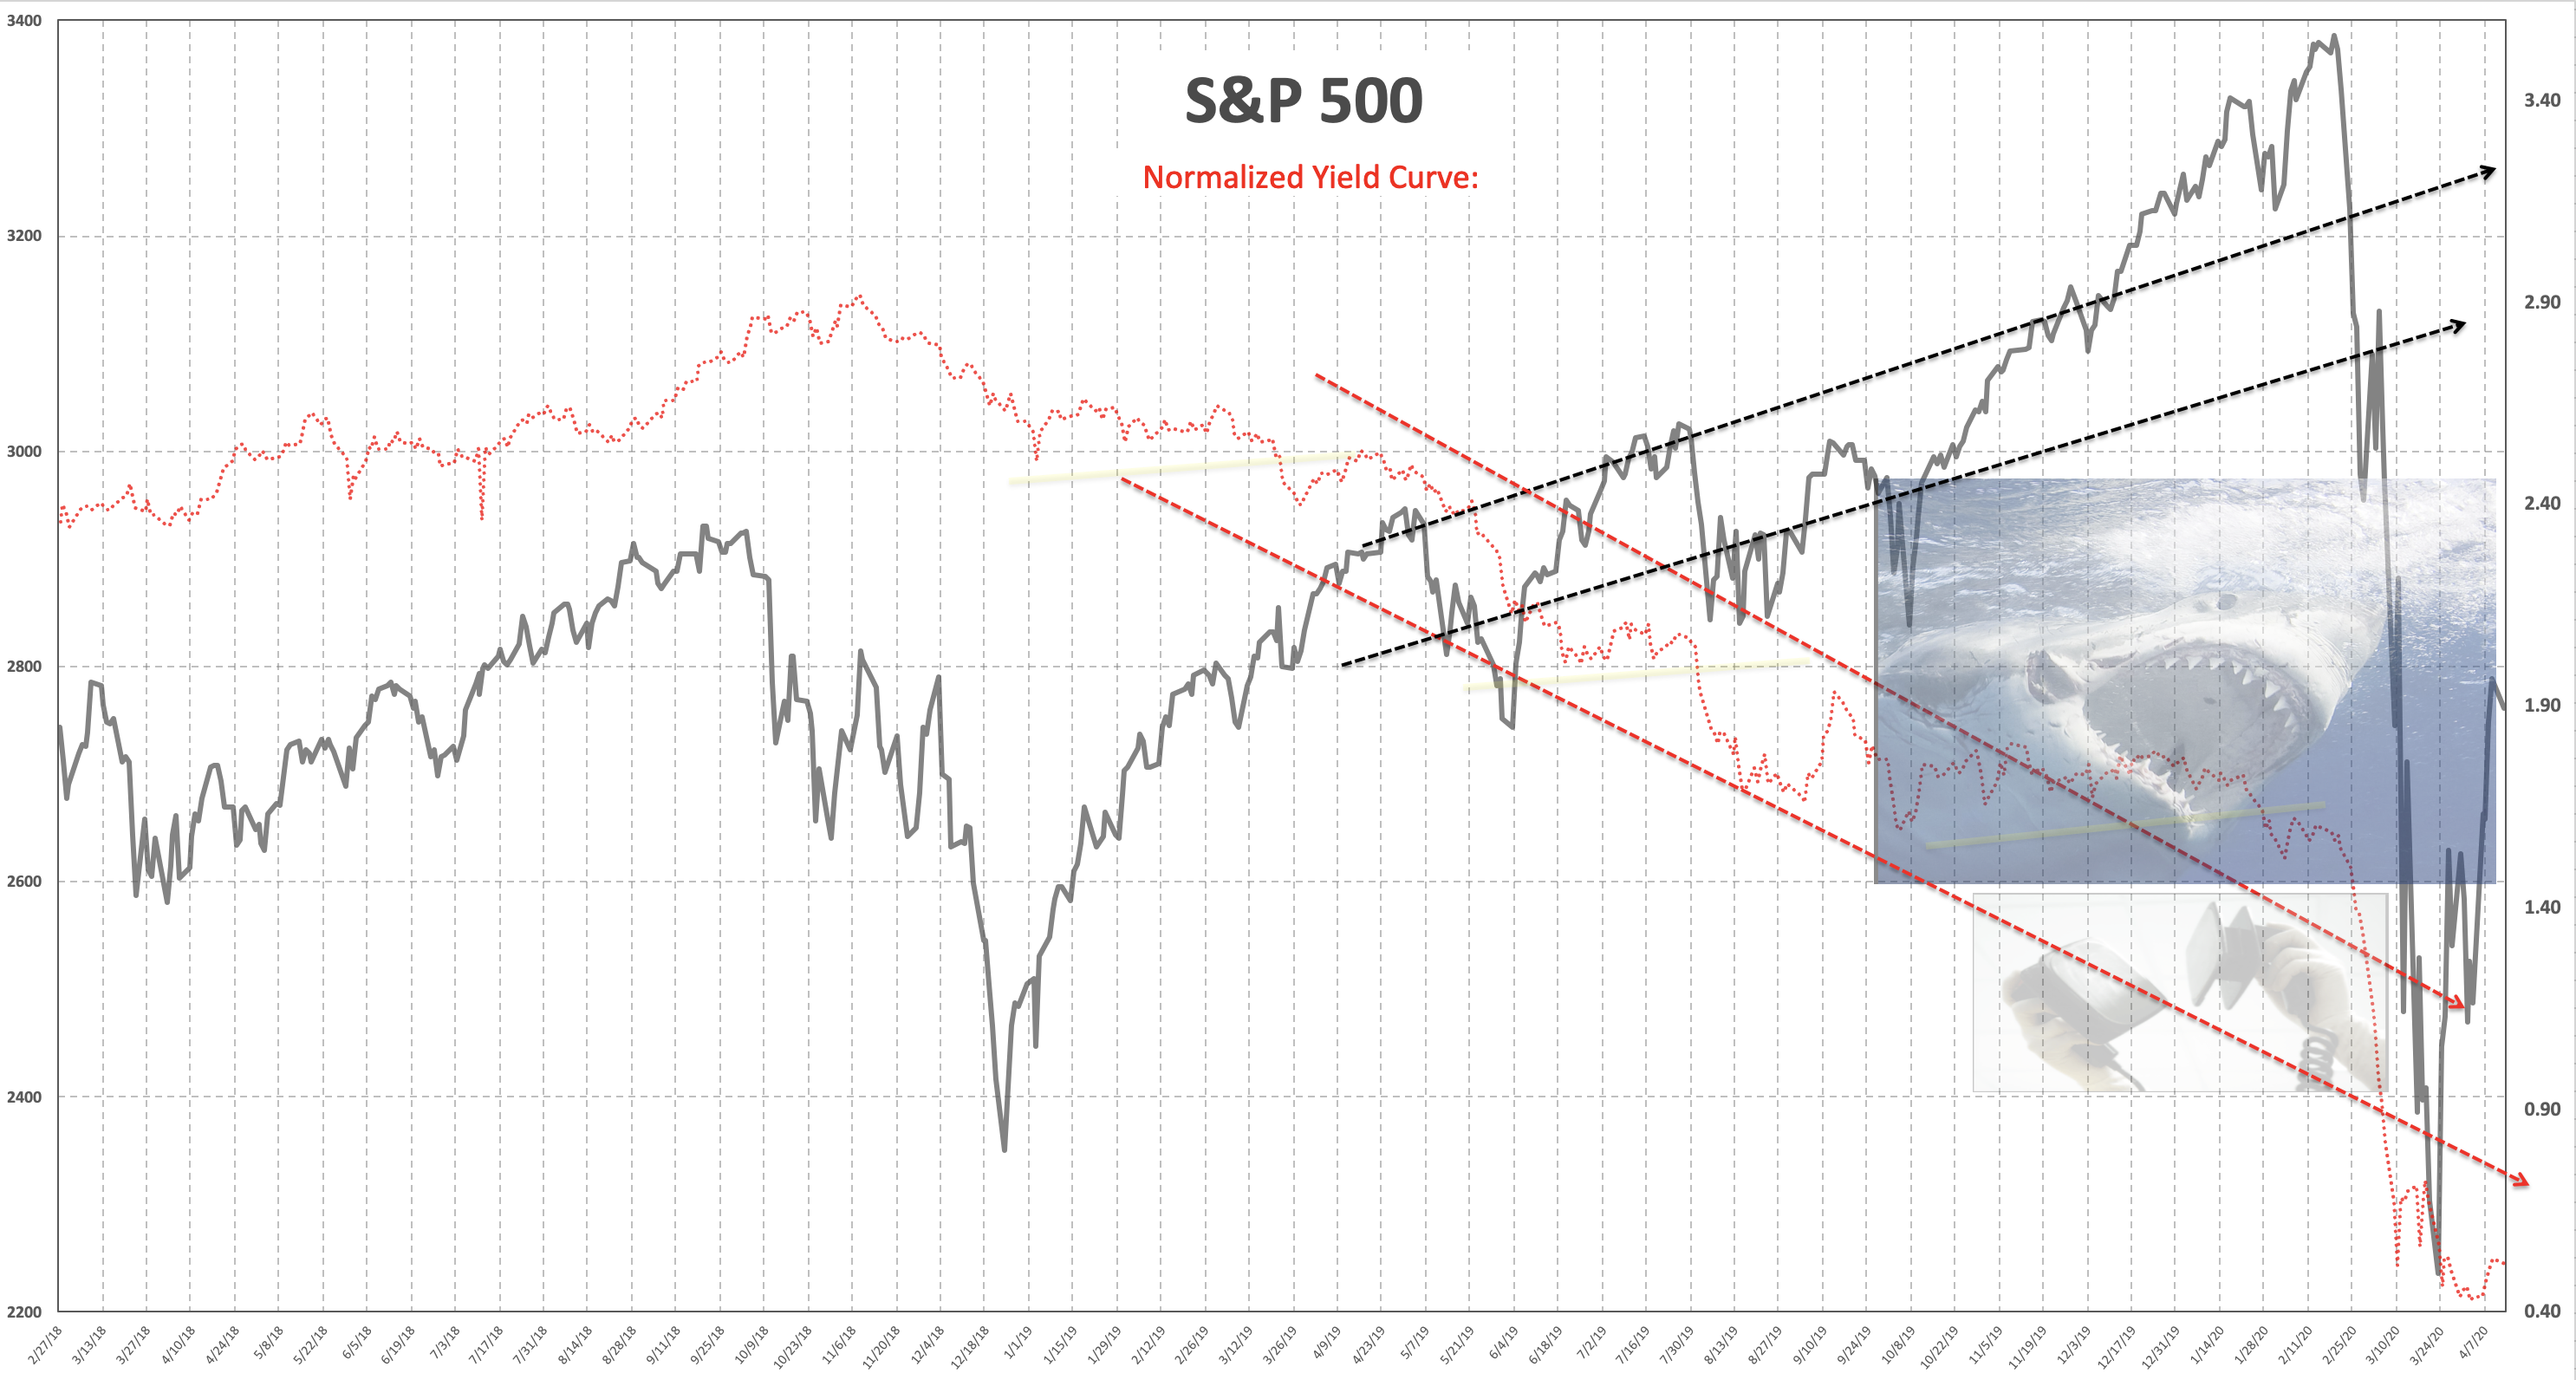
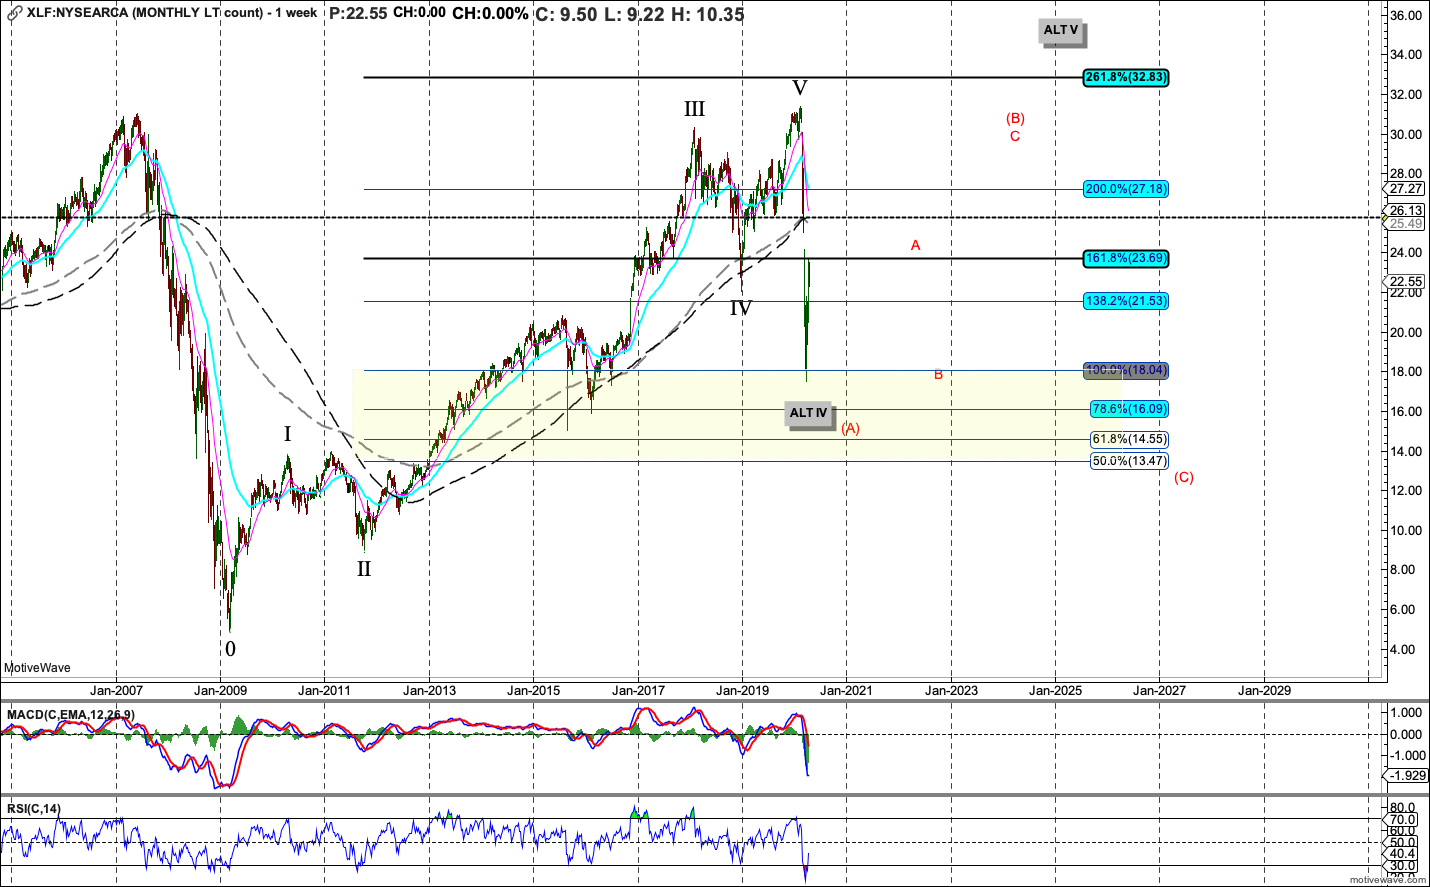
The Bond Market and Yield Curve are still playing dead. Since we are highly unlikely to be getting any inflation (short run) nor growth short run, yields will remain surpressed for the intermediate future. This is a mega problem for Financials, etc....which by the way are 15+% of the tape. And the unemployment rate spike with less jobs is not good for Fin's either. Delinquencies, defaults, etc will surely rise in the next year.
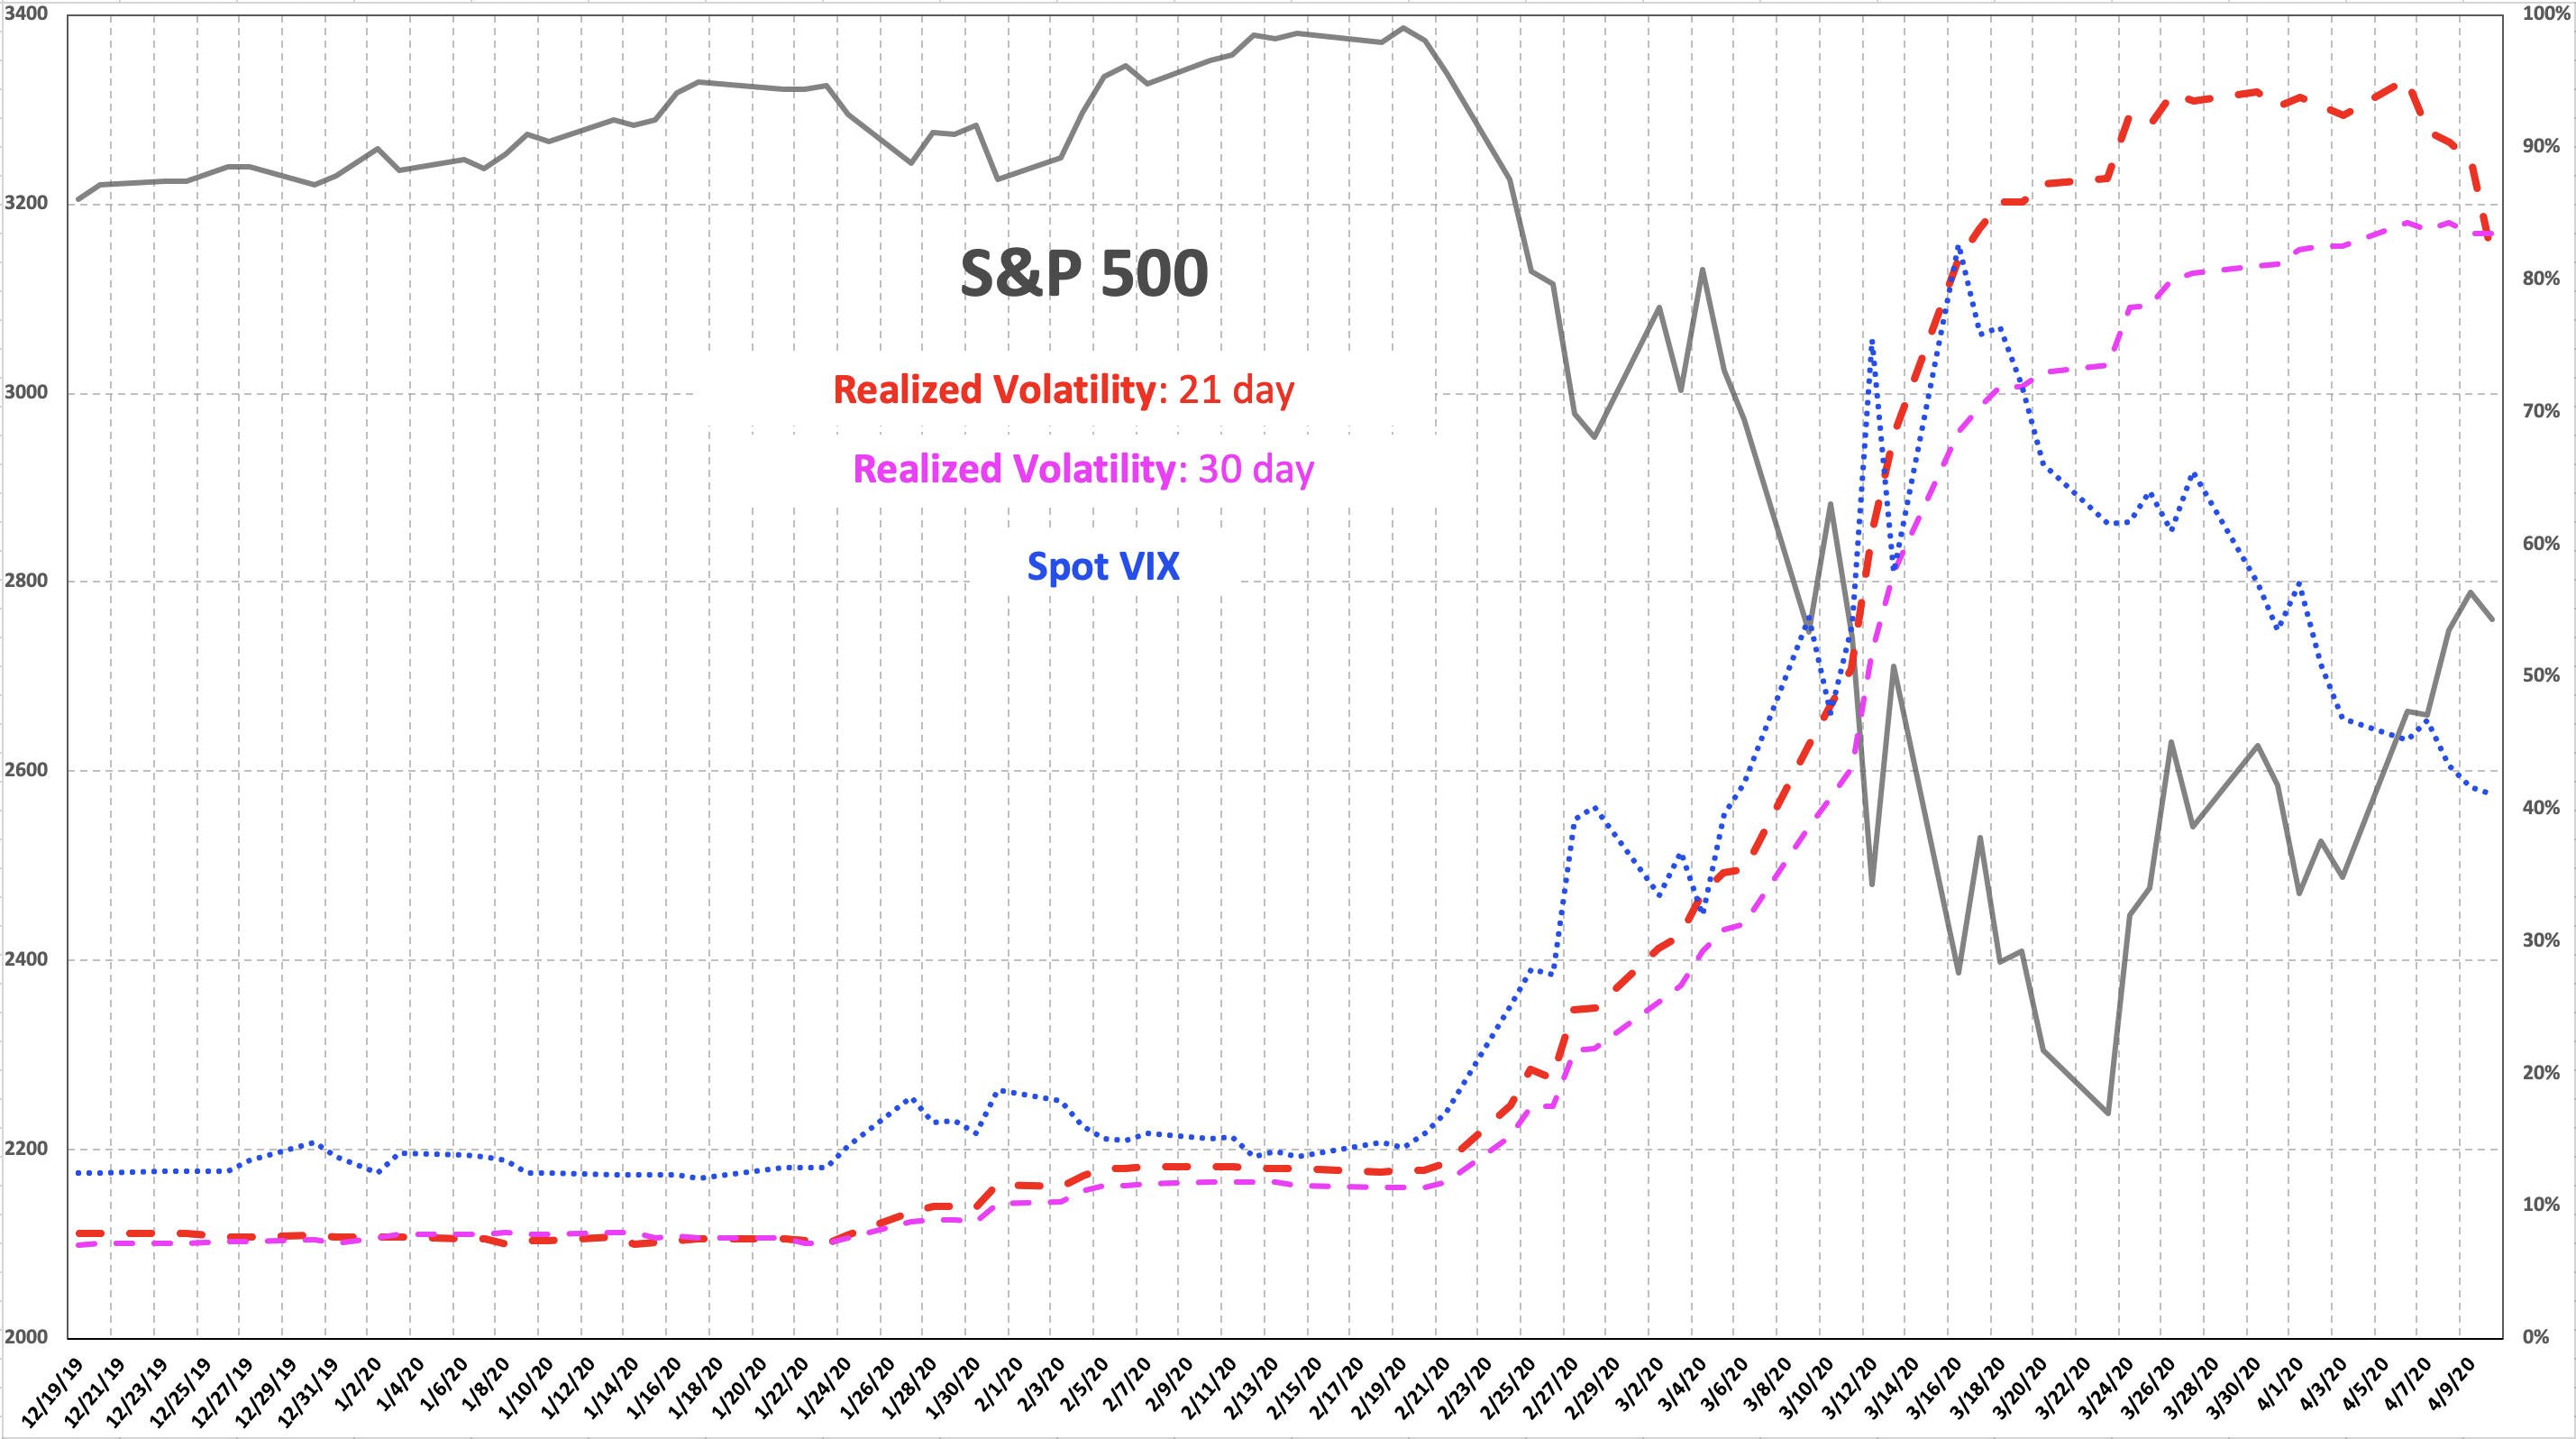
Realized Volatility has subsided on the shorter run not shown 8-day MA, and you can see the RED 21 day coming in now as well.....Spot VIX and implied are still trading quite high...i've had a bogey of 40% and 20-25% to see broken before volatility is suggesting the worst is behind us. We haven't seen that yet either.
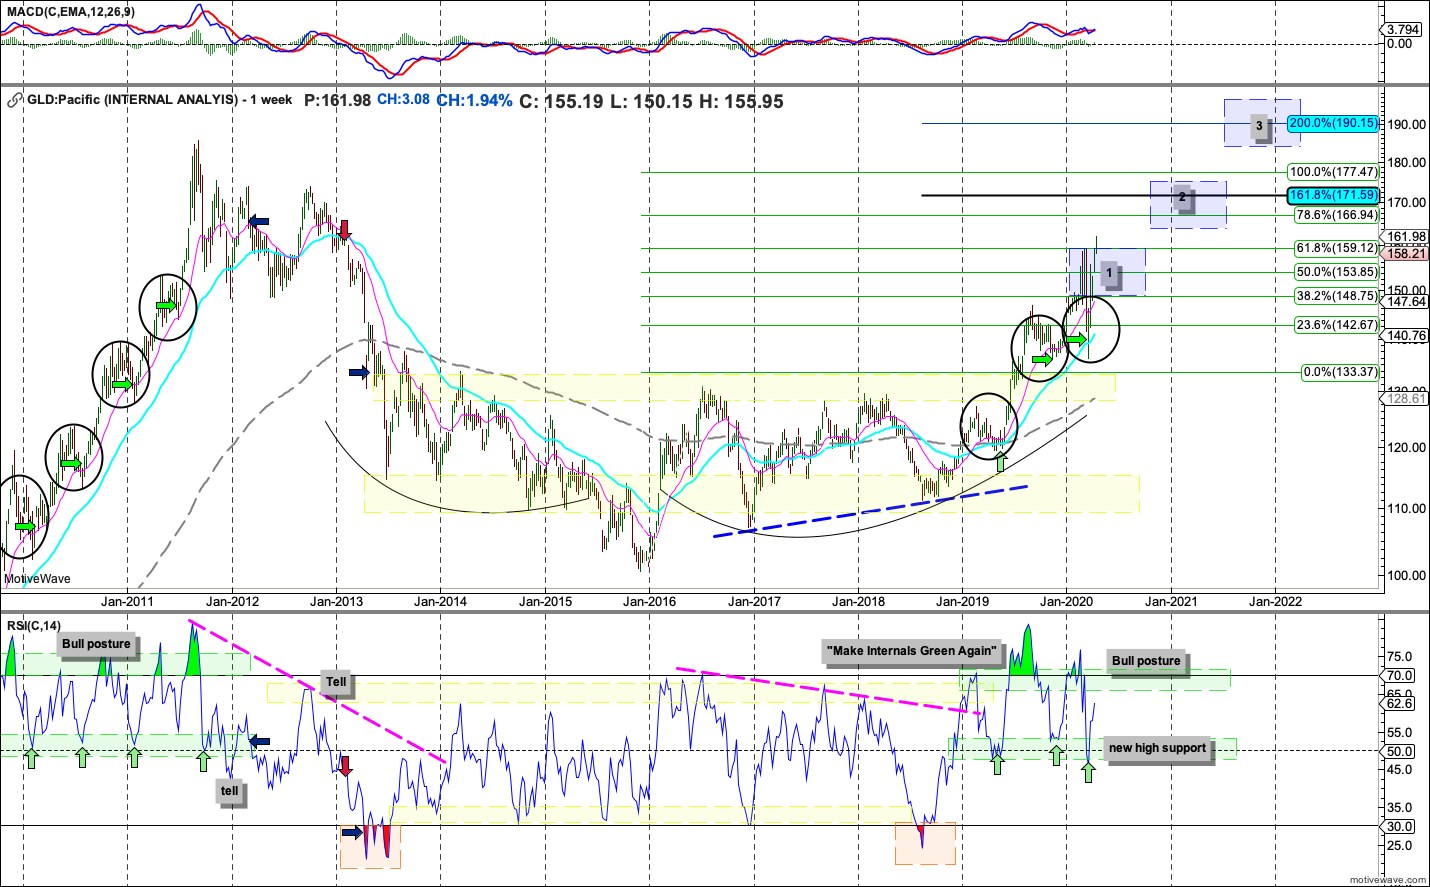
Gold continues to breakout....with "real rates" remaining strongly negative, and consumer confidence diving. This should continue and I don't think is bullish for the tape at all.
Emerging markets look distressed for awhile longer to me. They could have one more dip to new lows....here
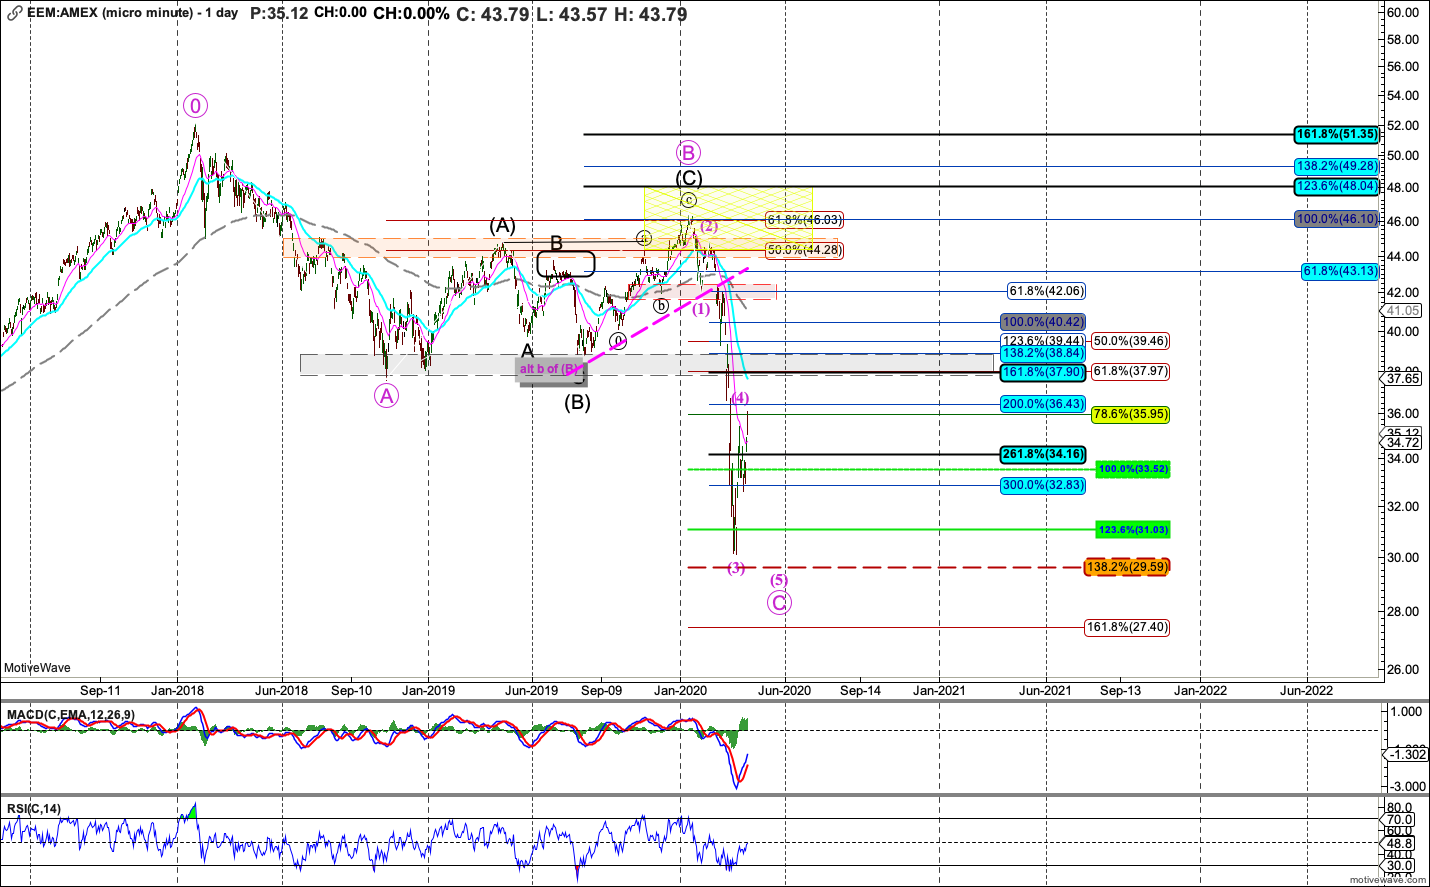
Or something much worse shown here....
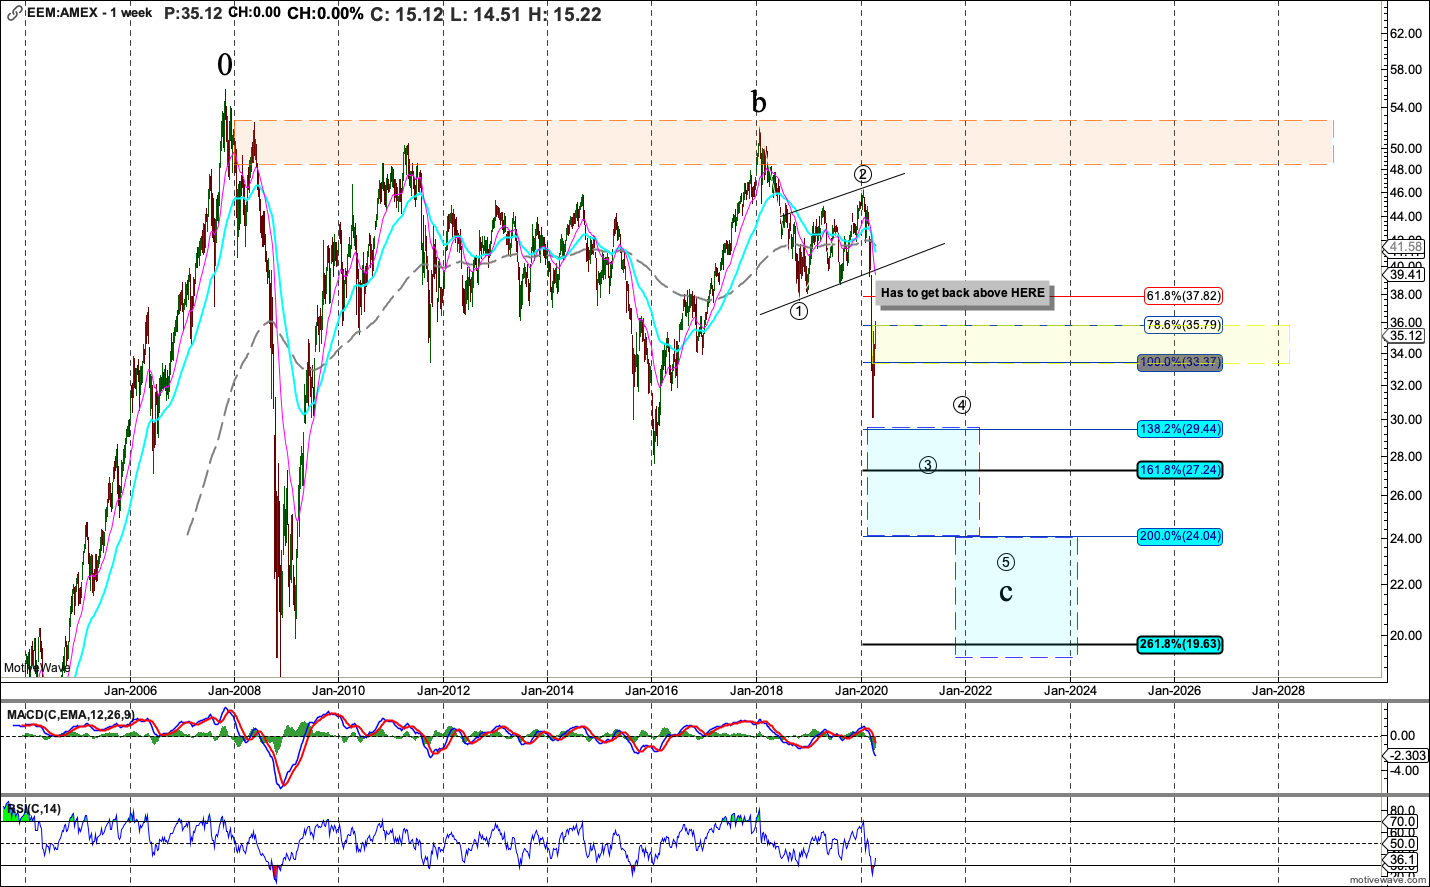
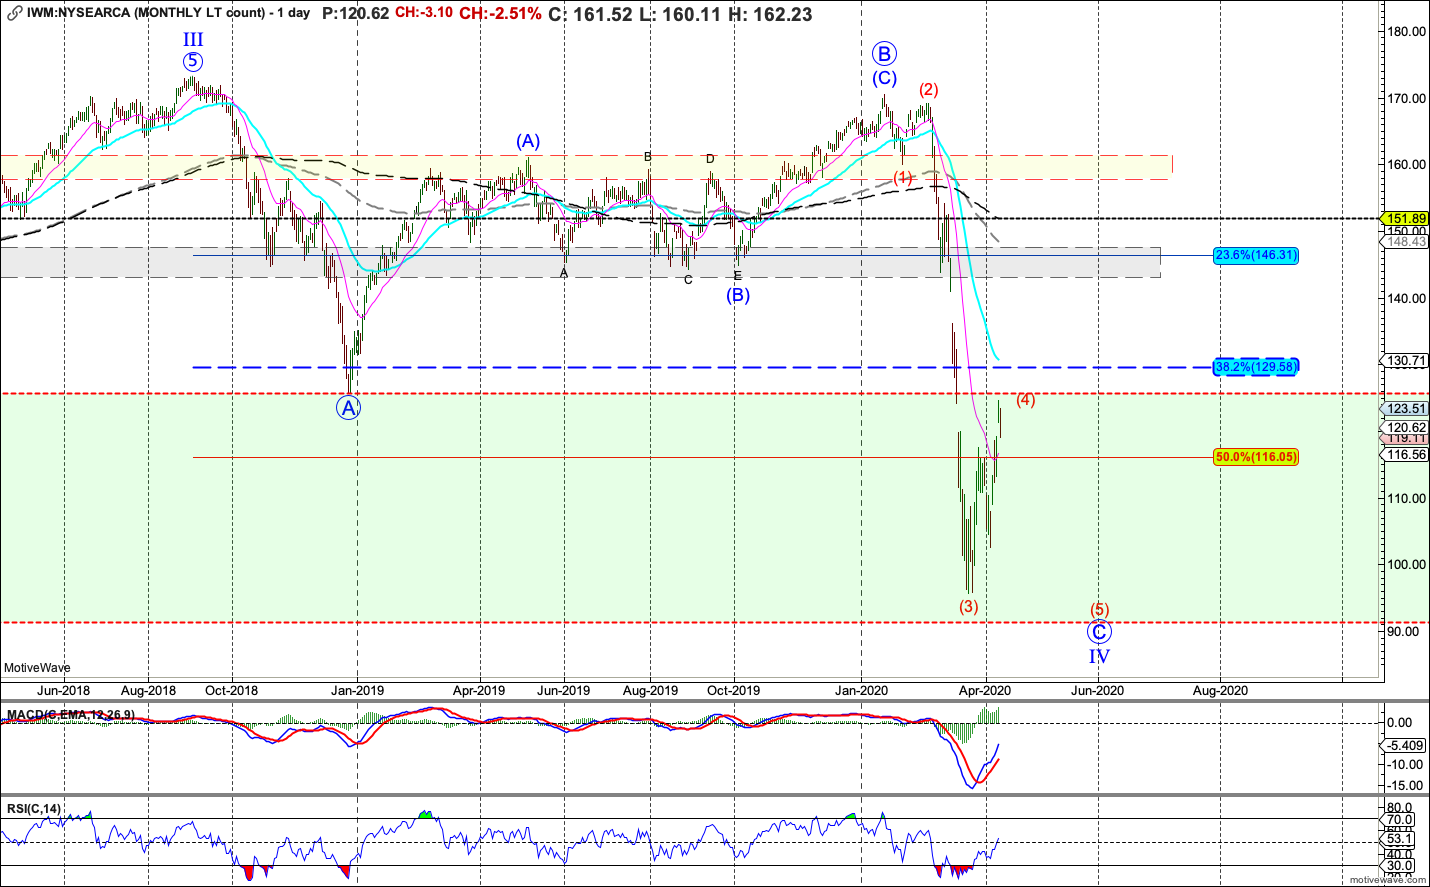
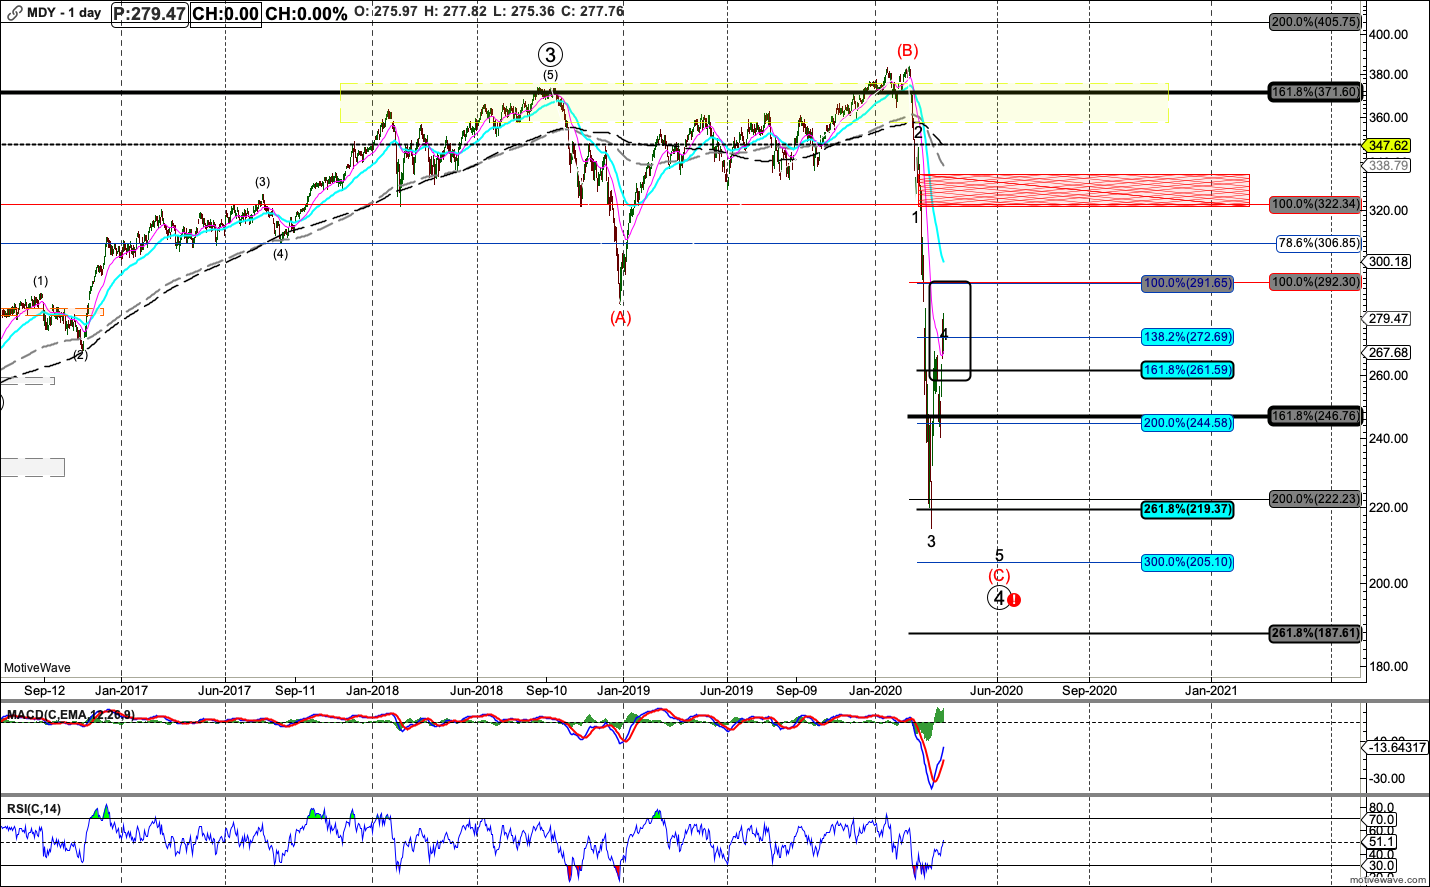
EEM is most similar to Small CAps and Mid caps domestically speak...
here
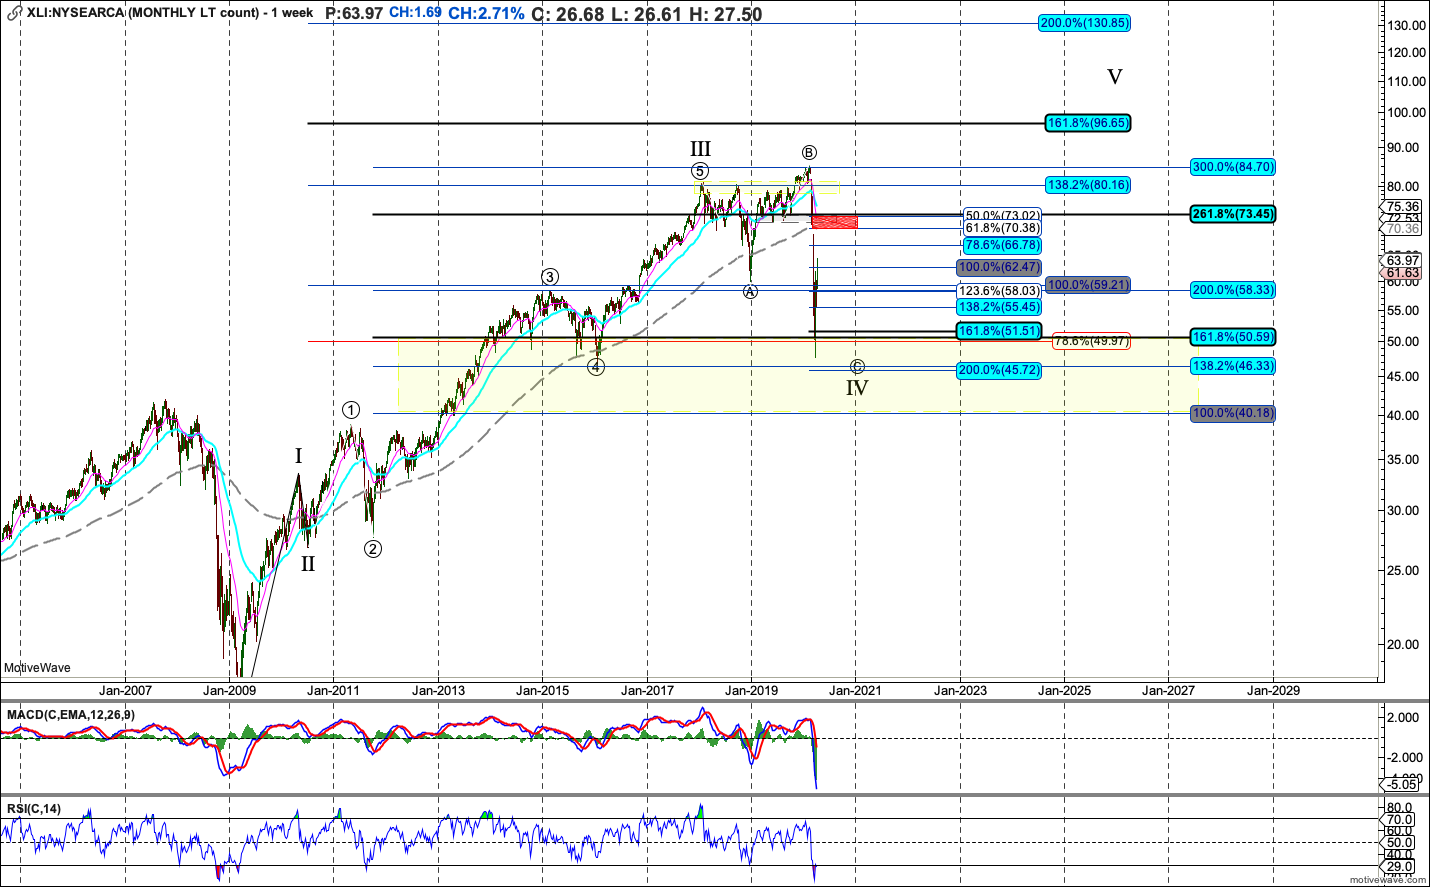
Financials, Industrials, Discretionary don't look completed to me on the downside.
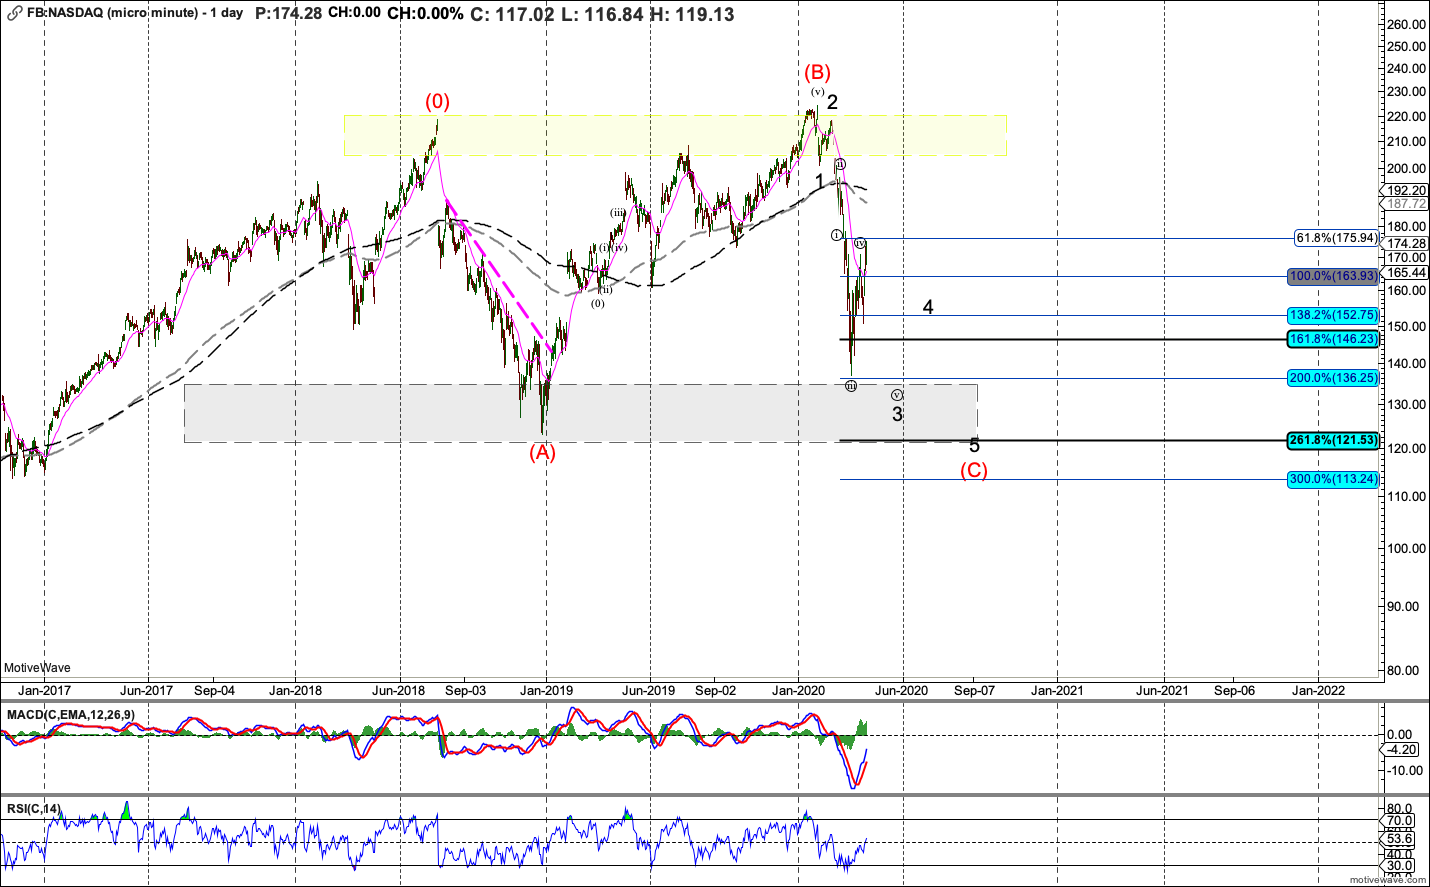
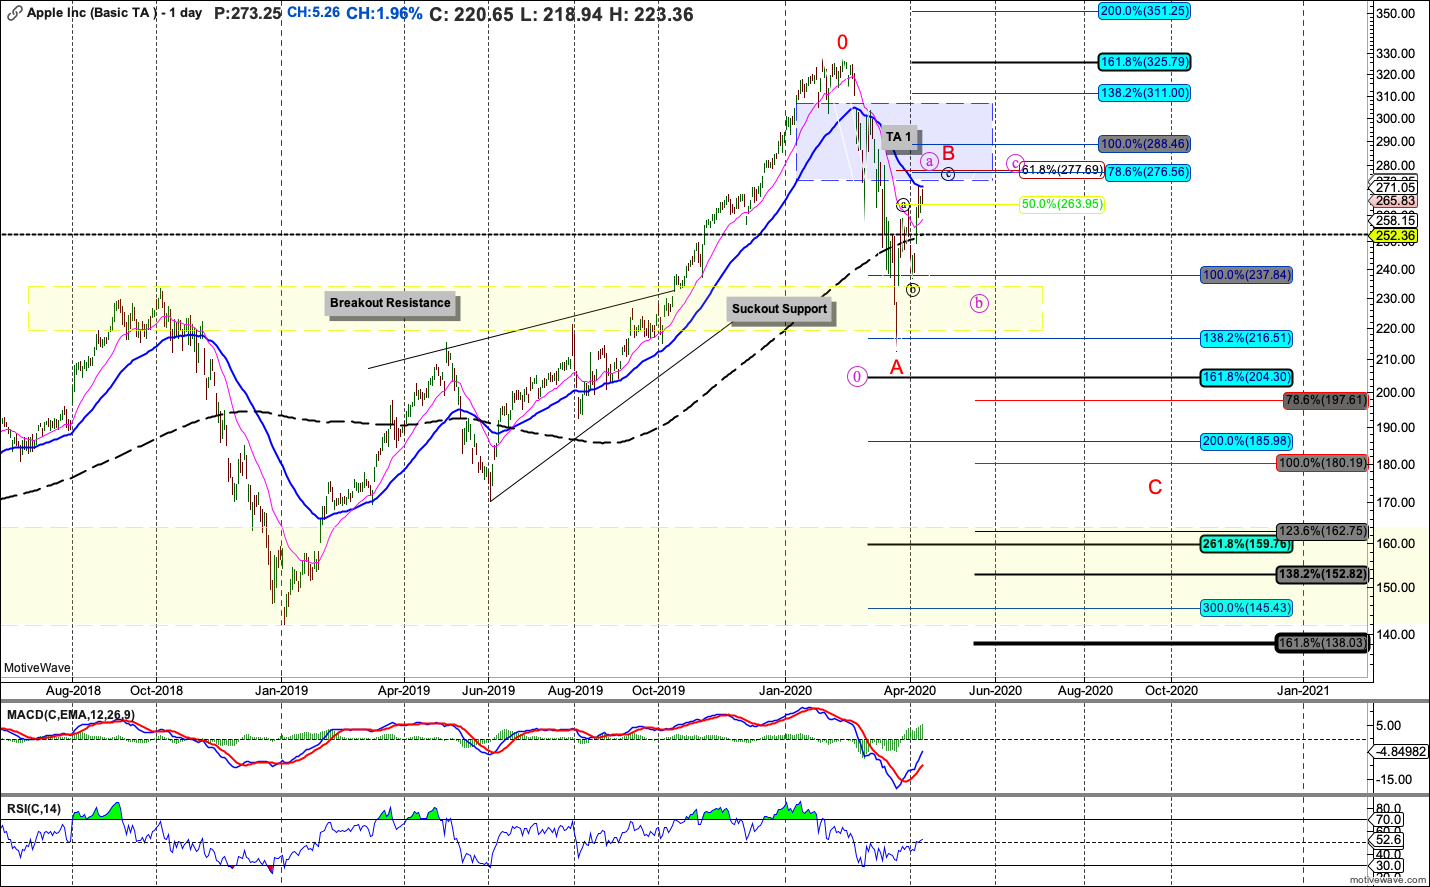
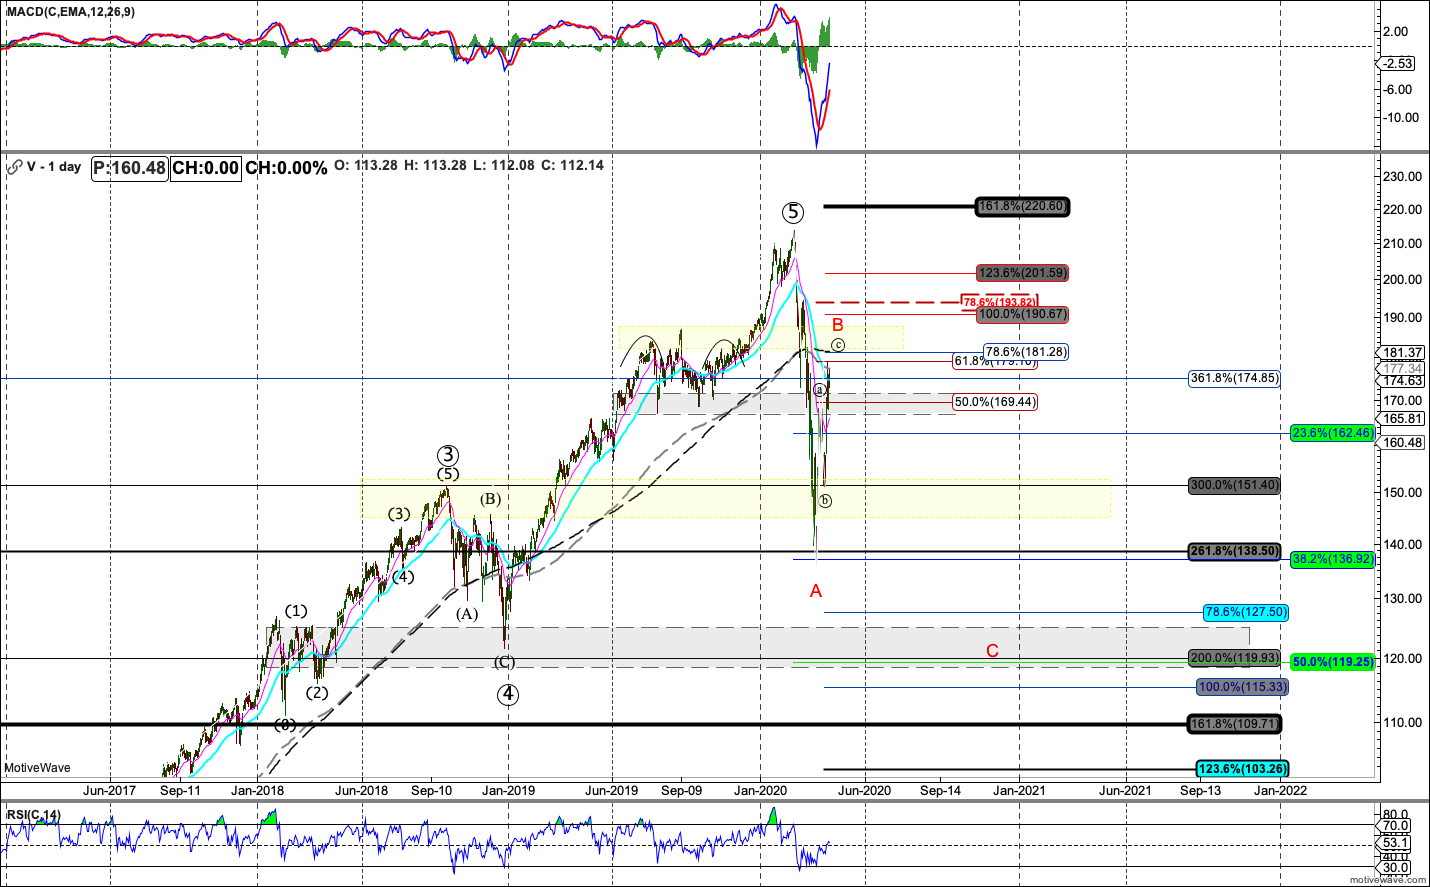
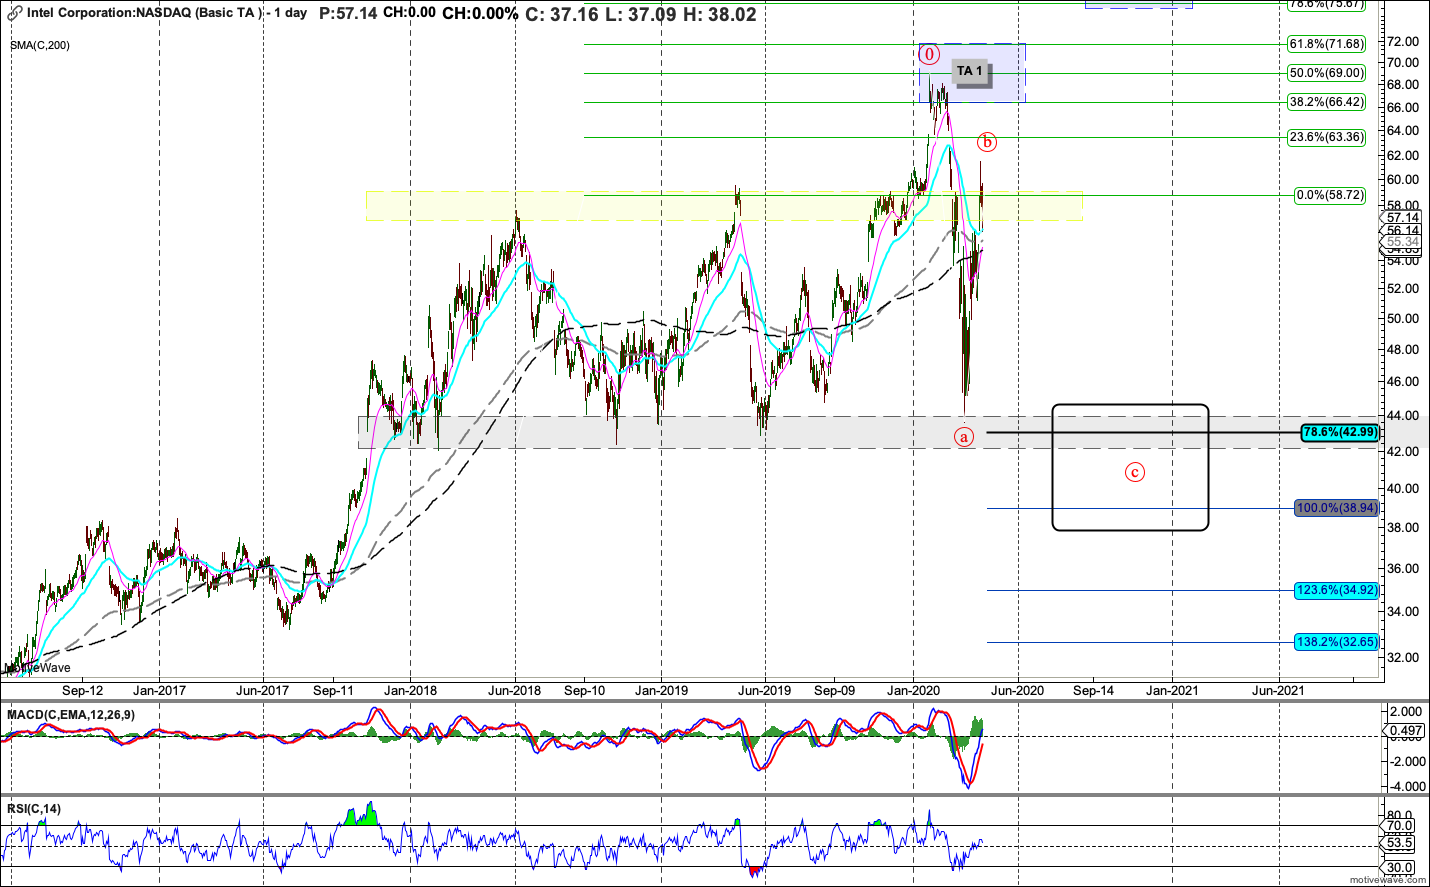
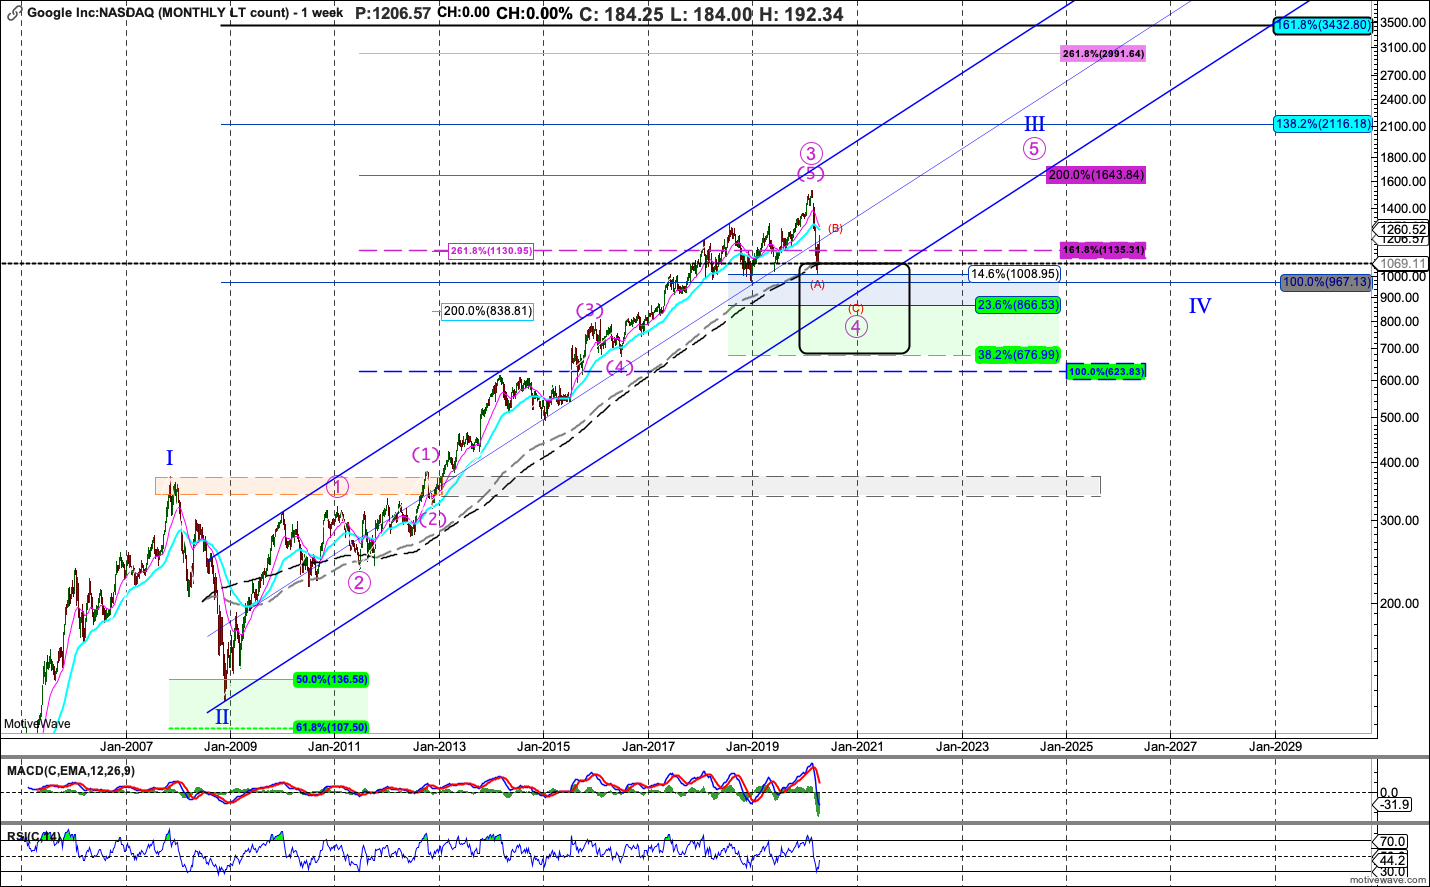
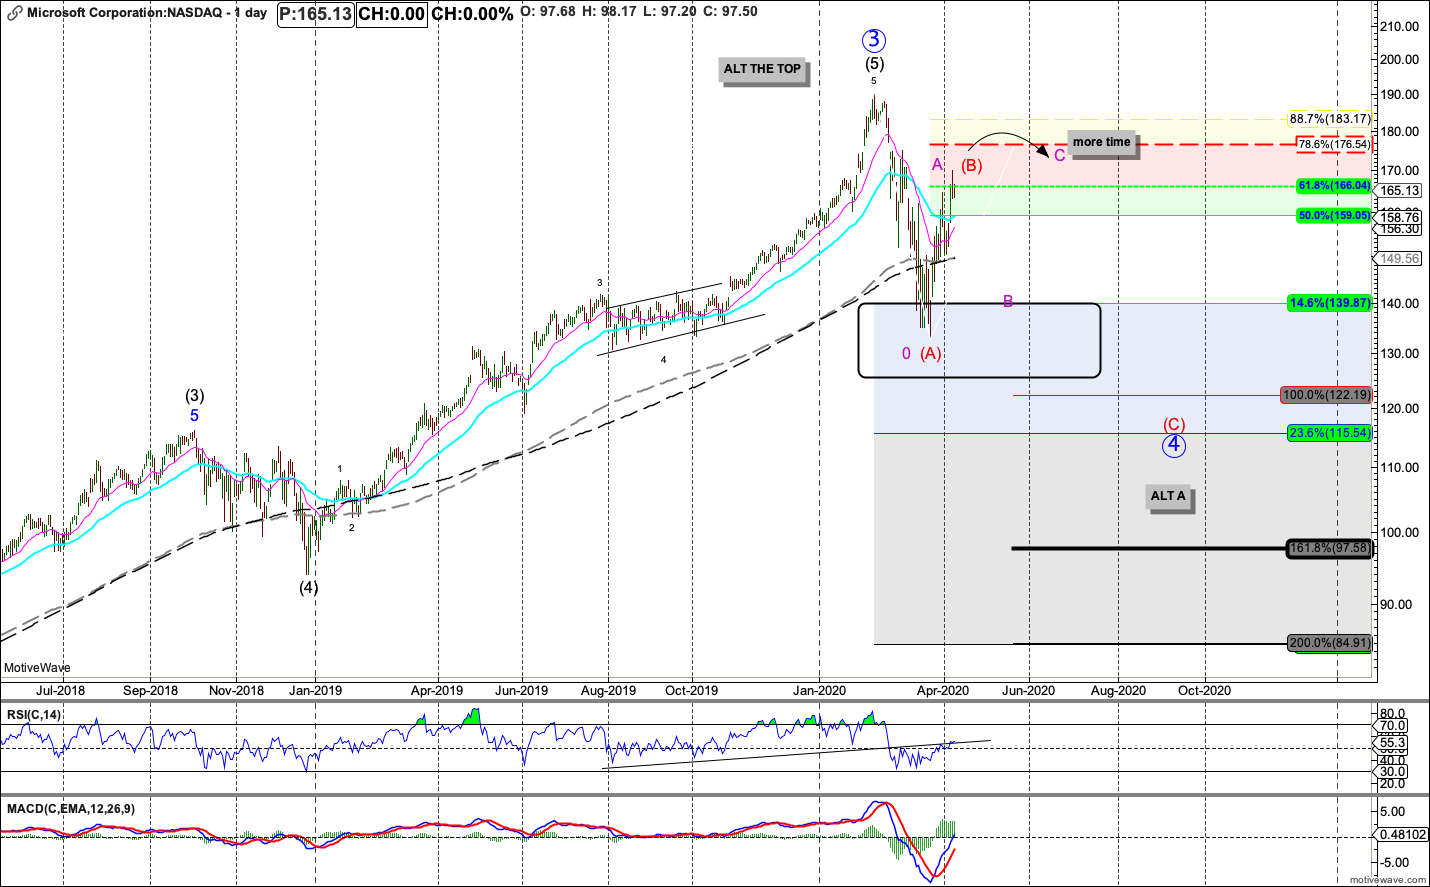
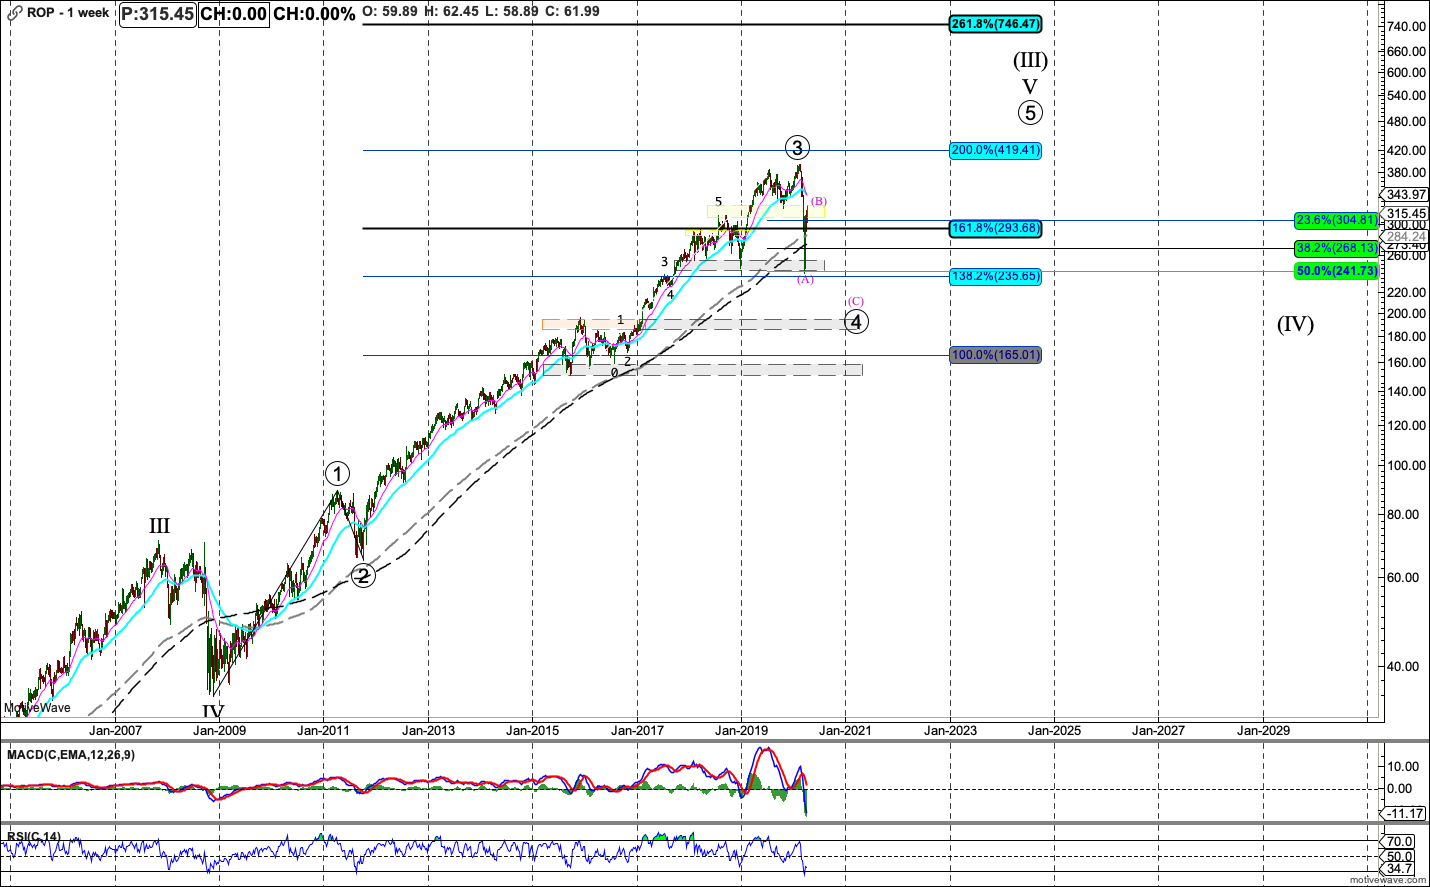
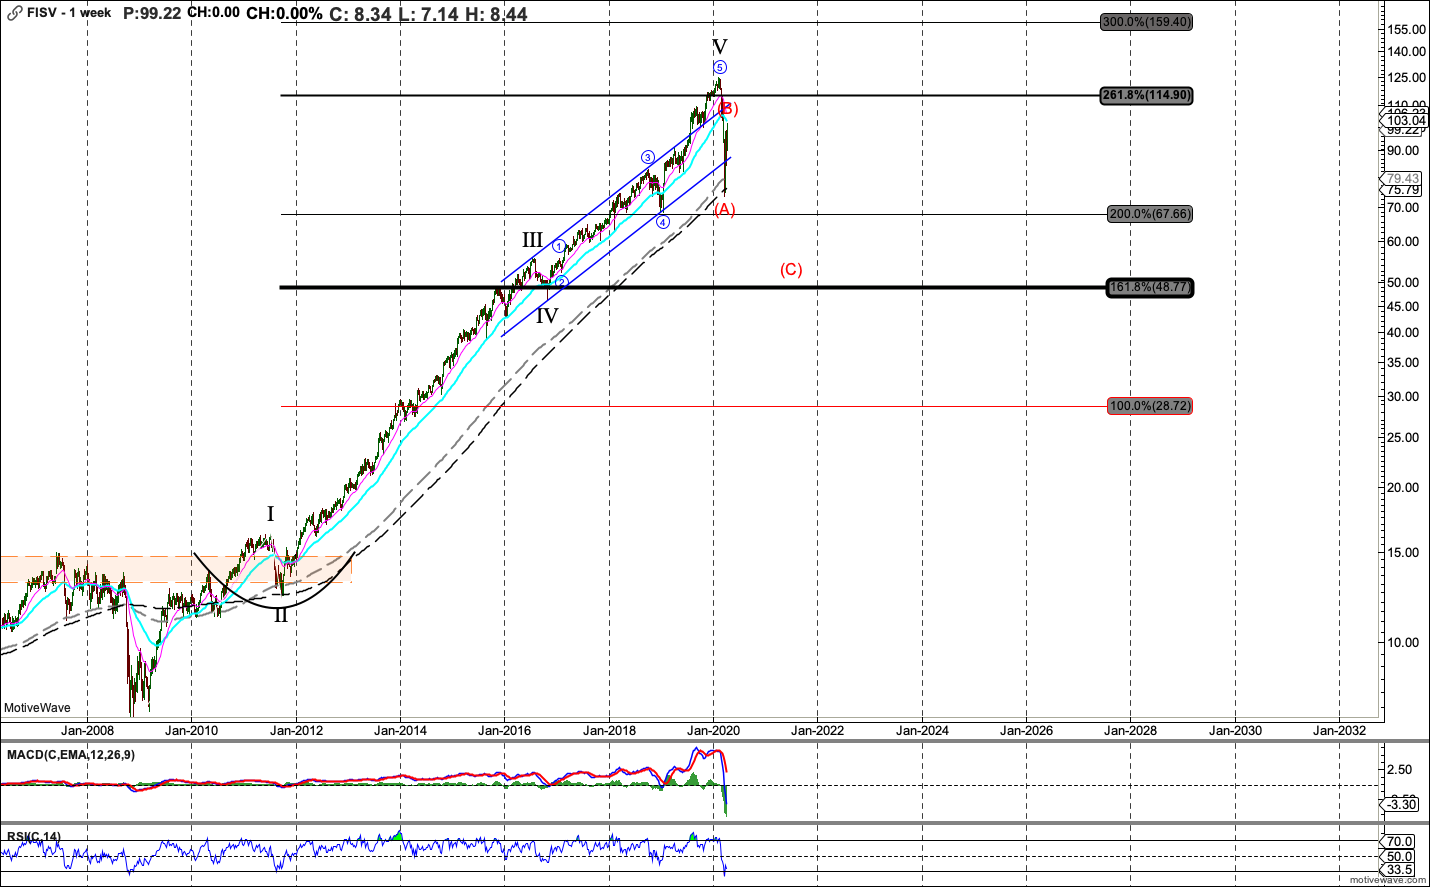
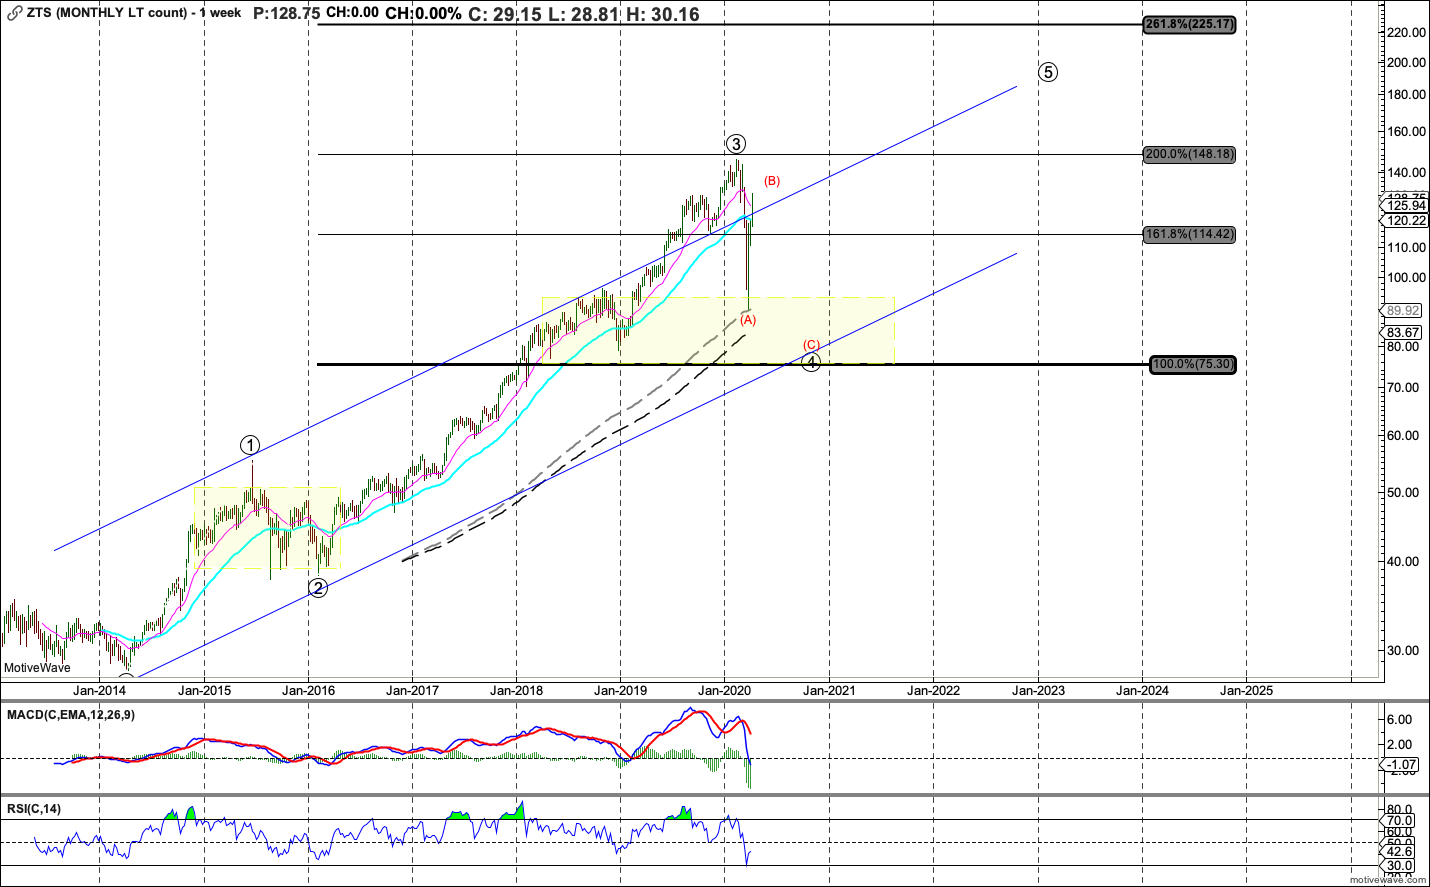
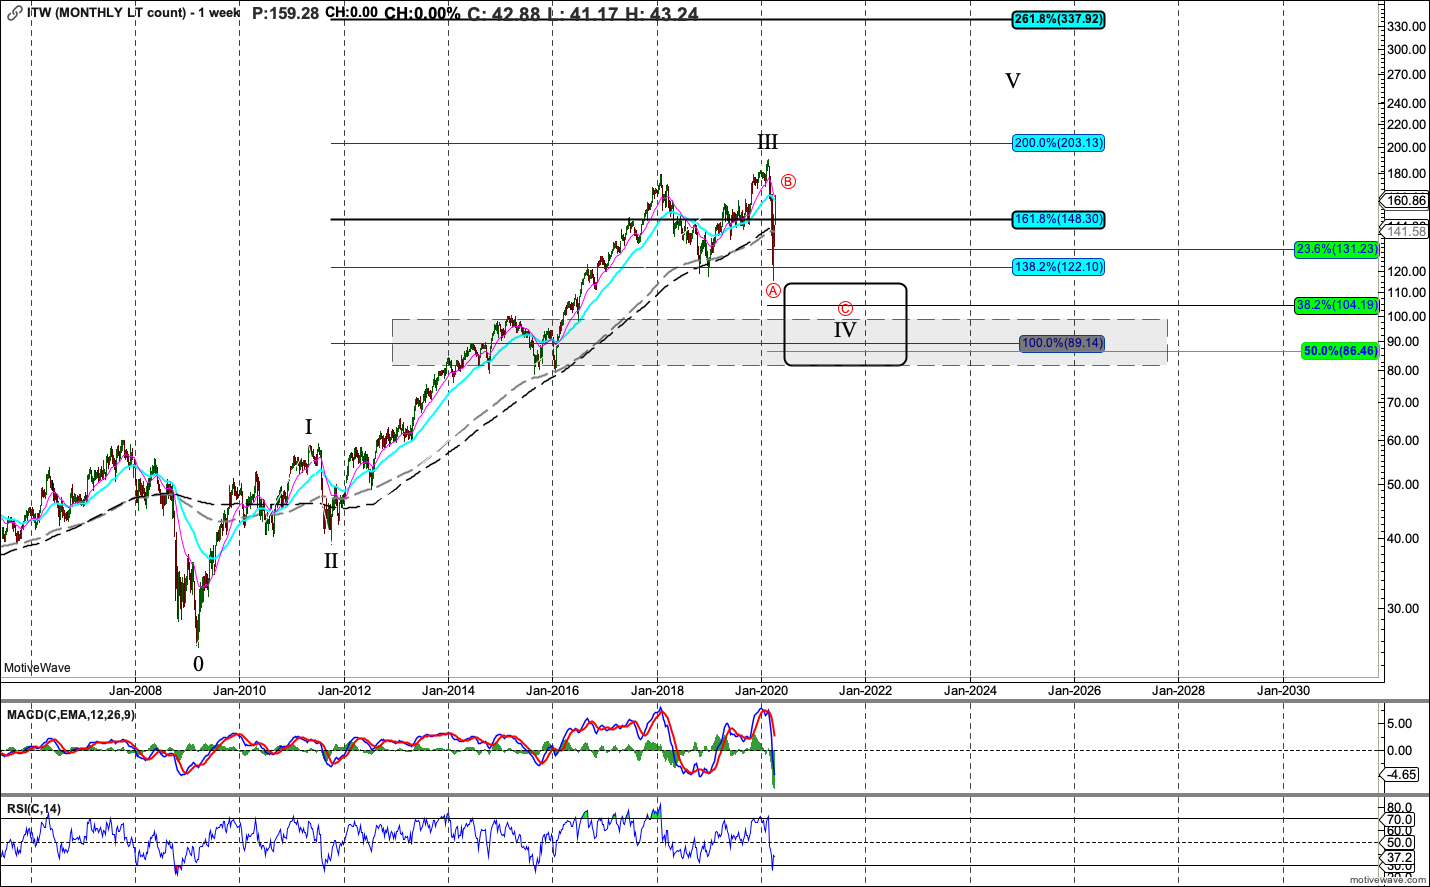
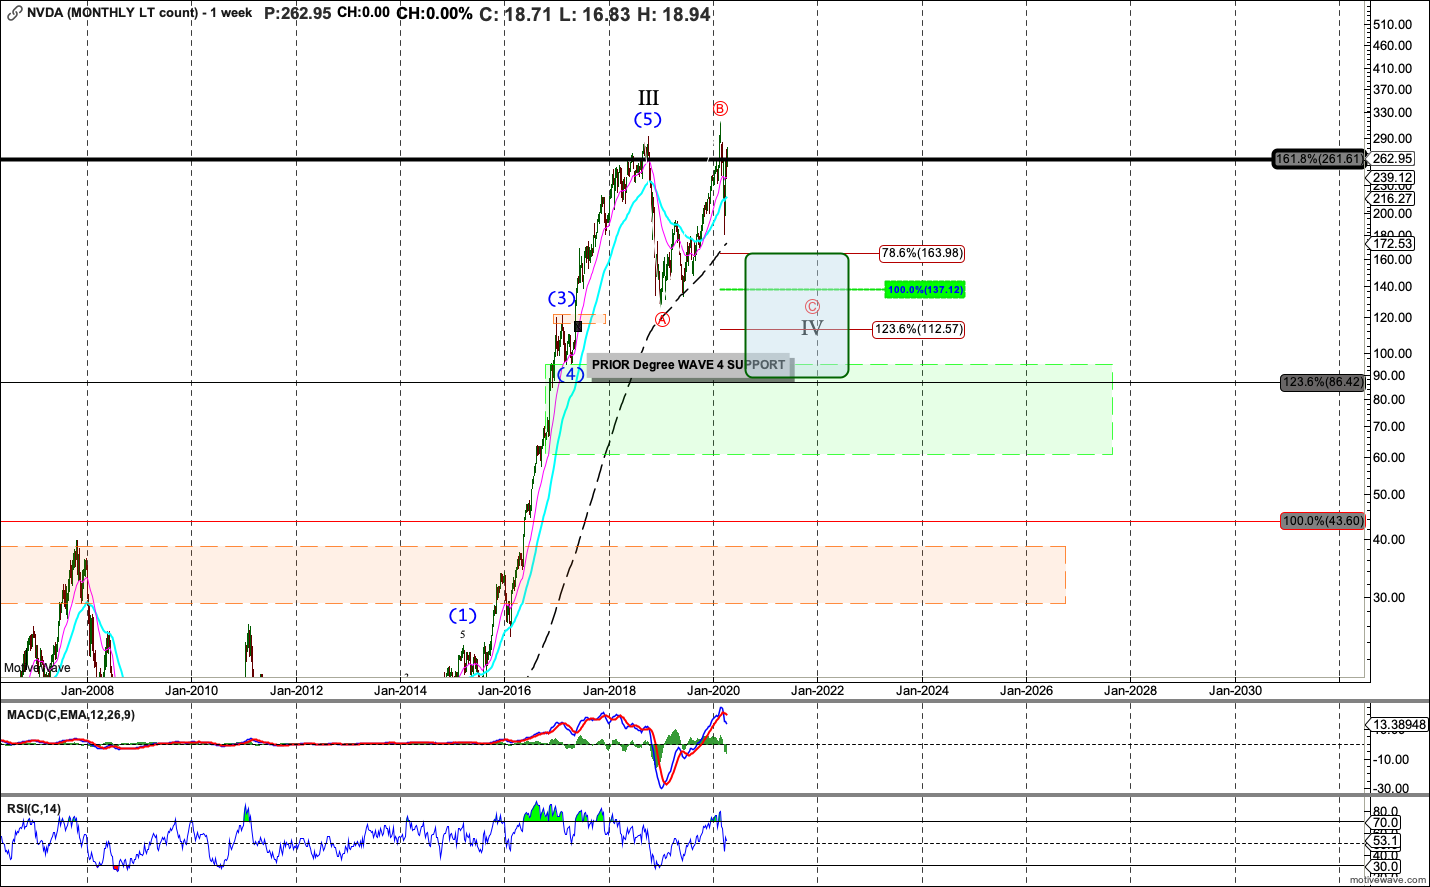
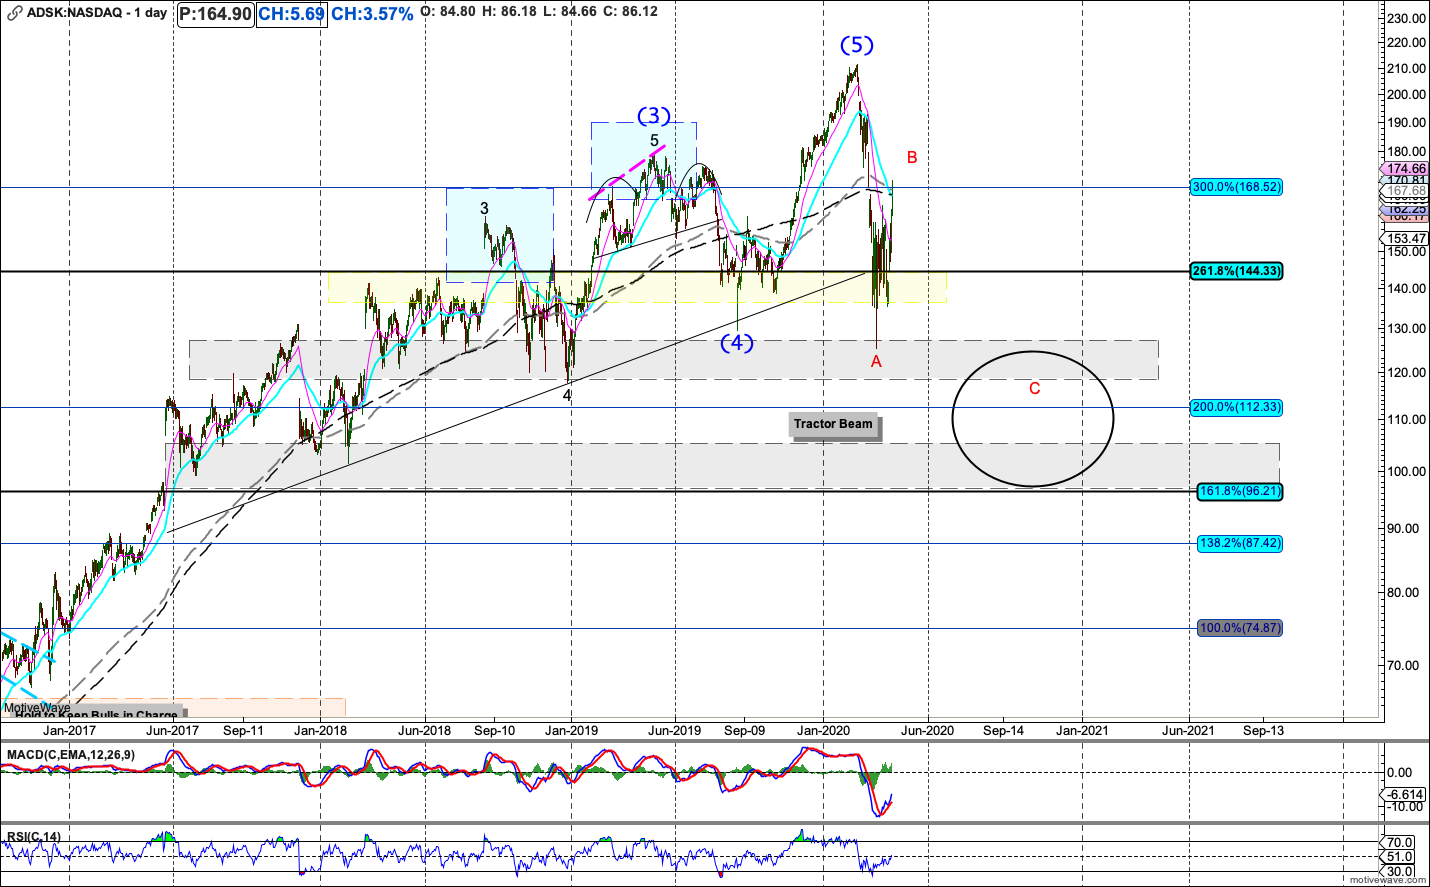
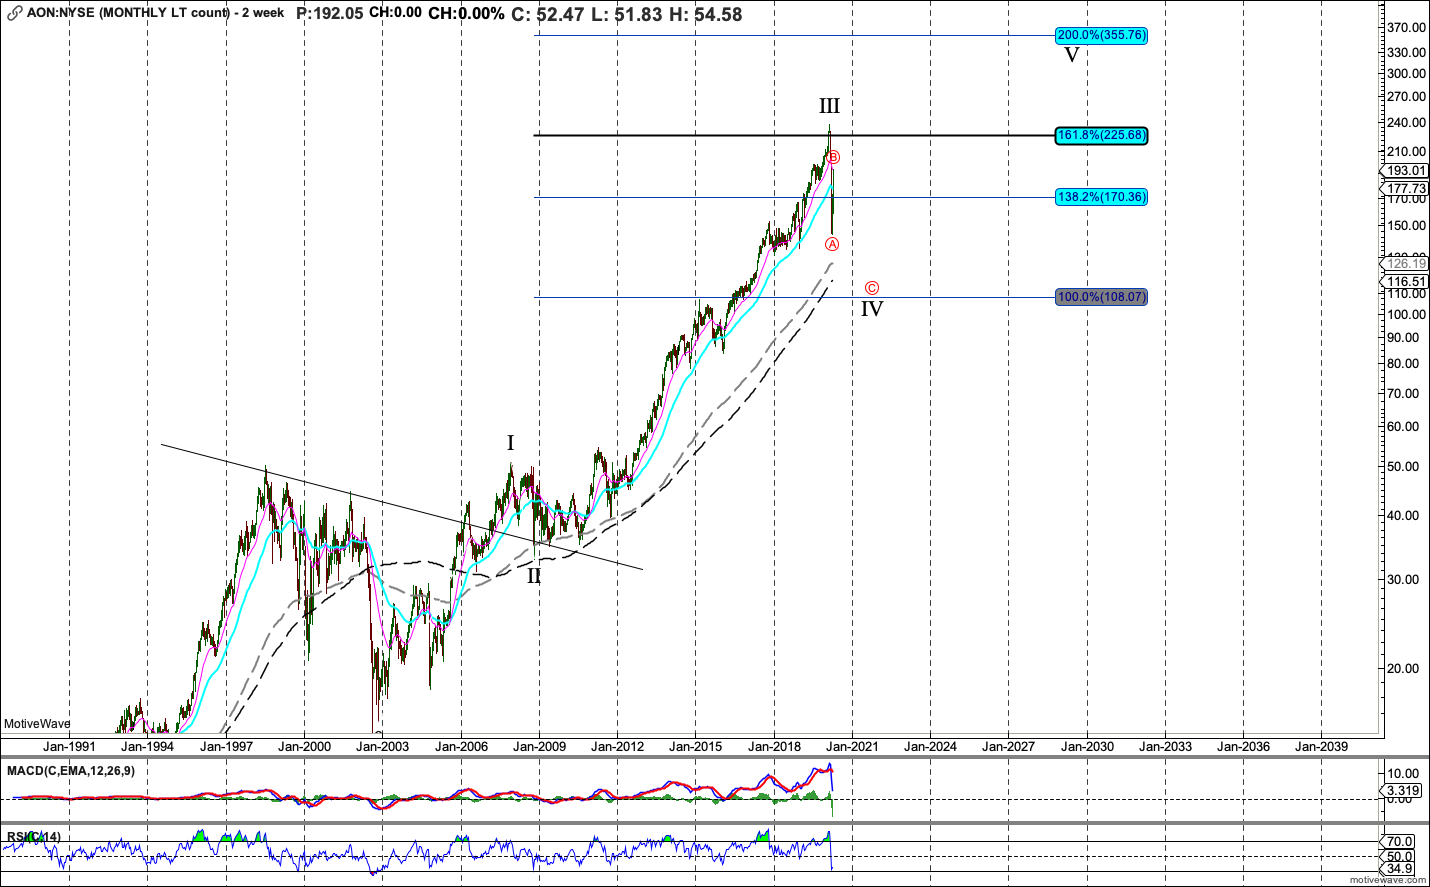
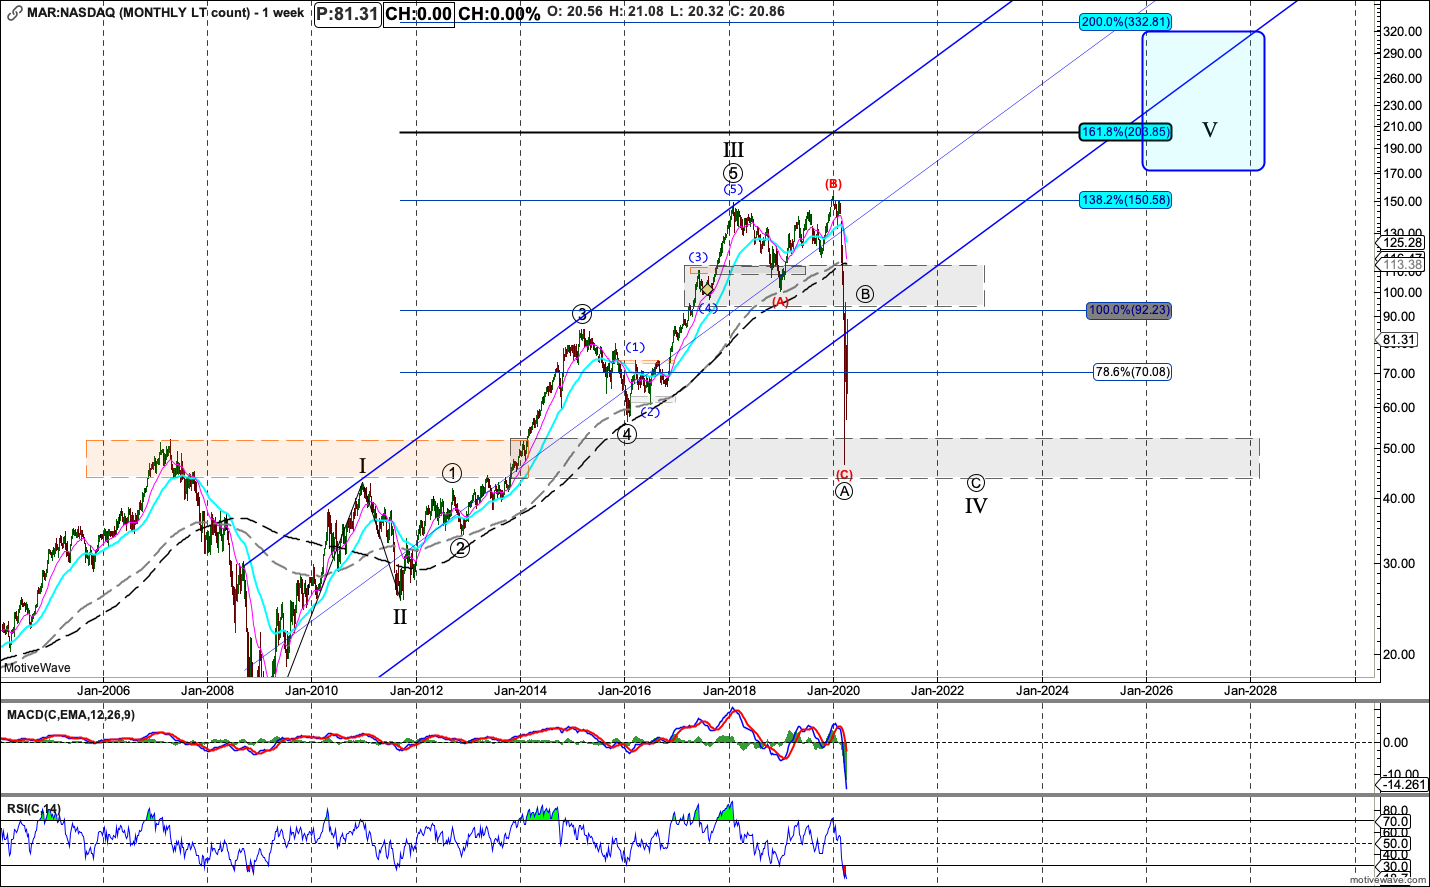
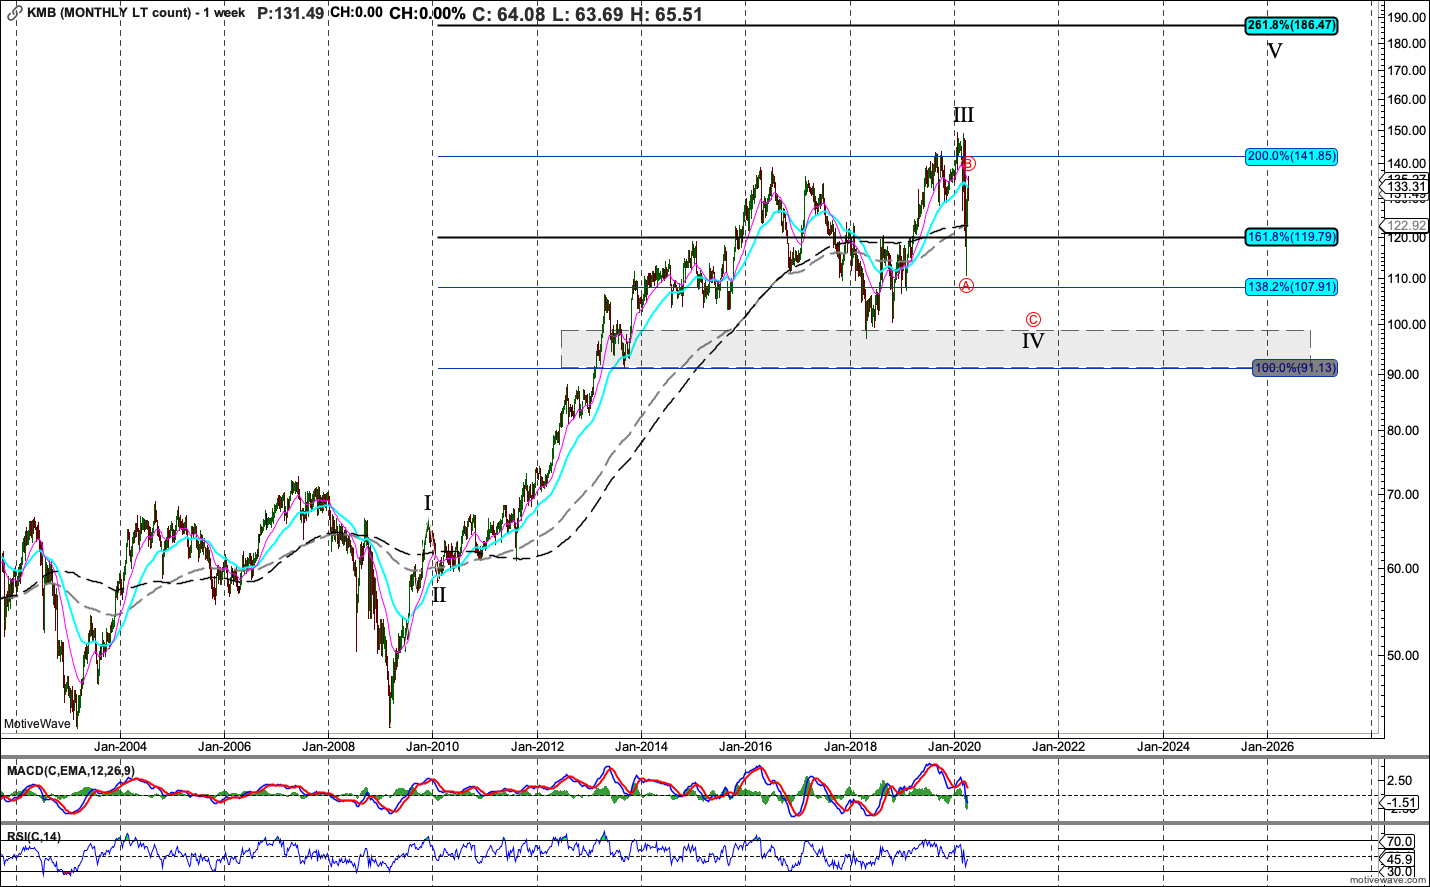
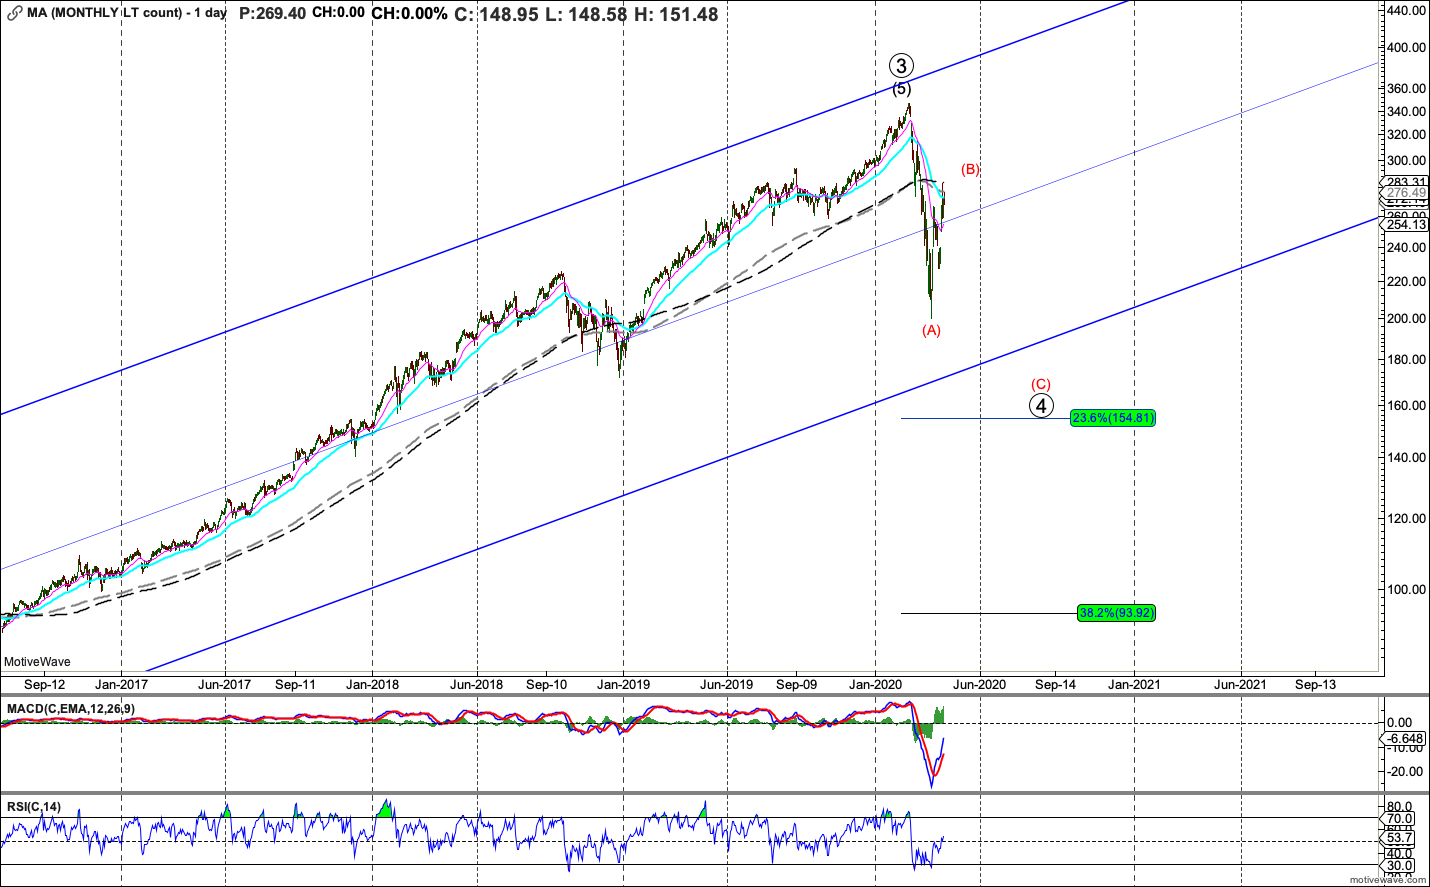
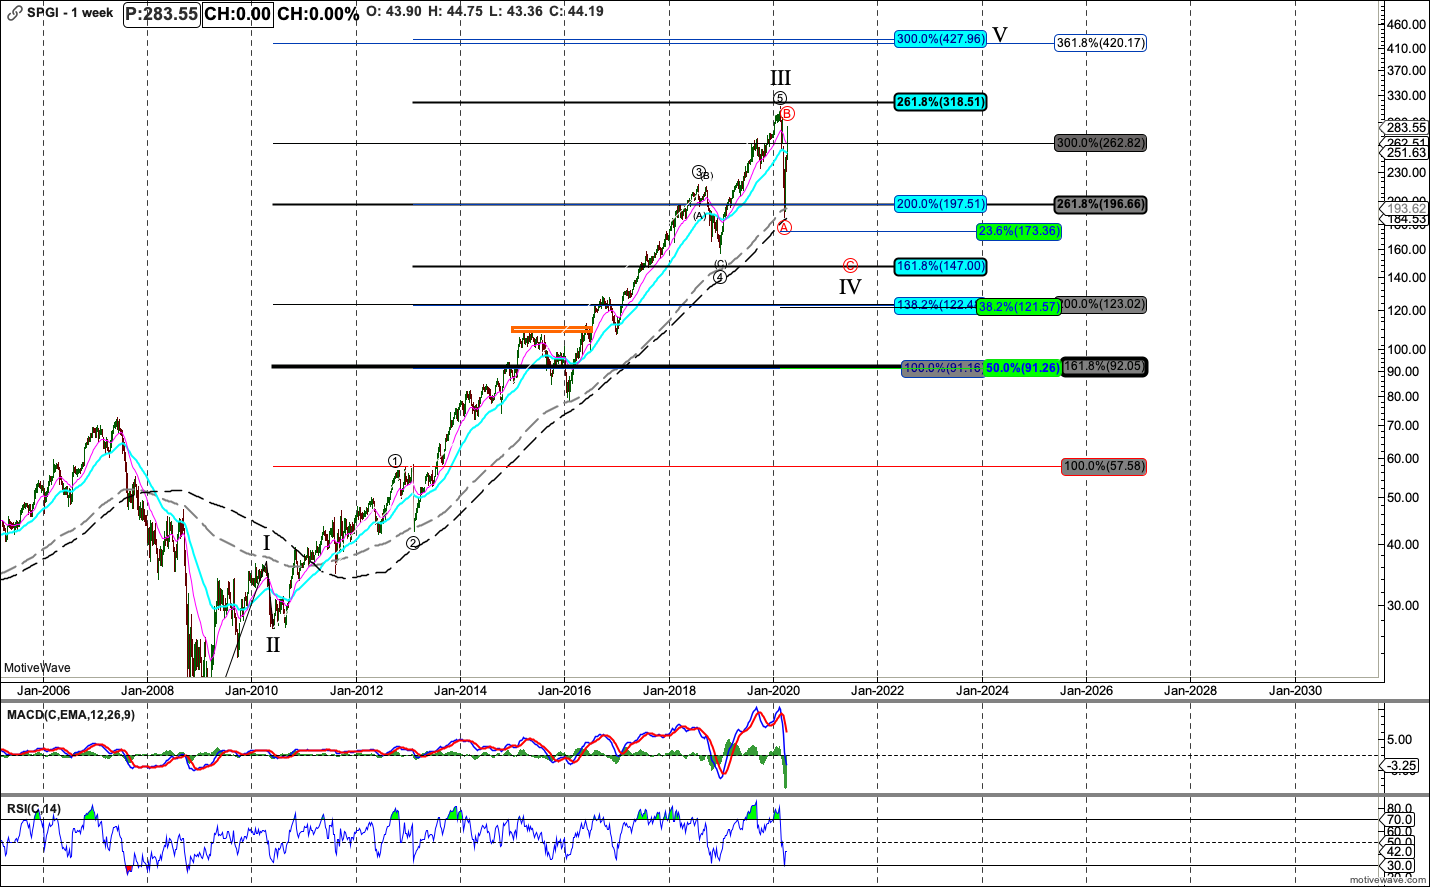
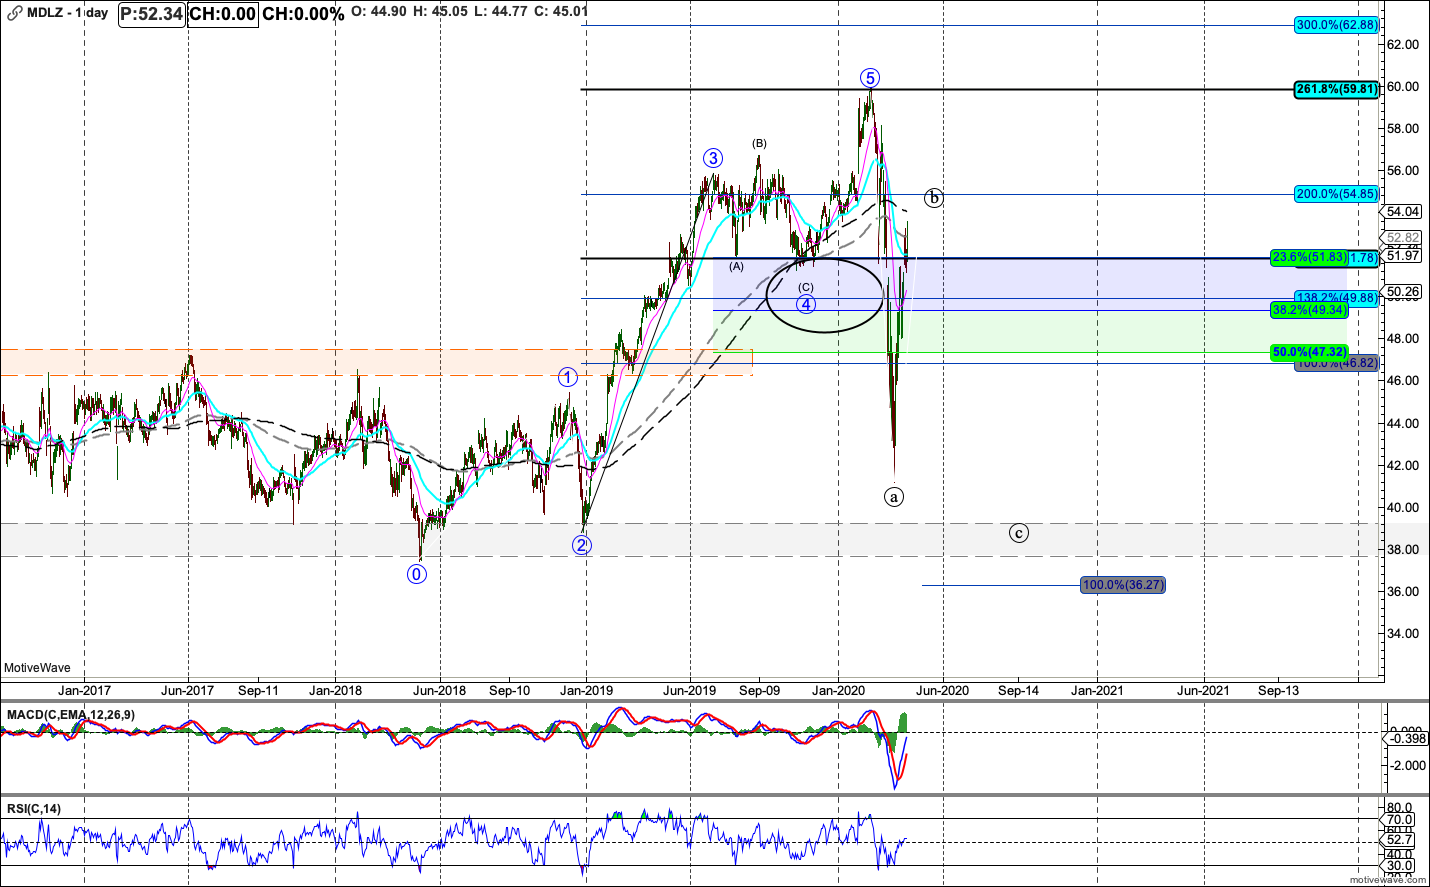
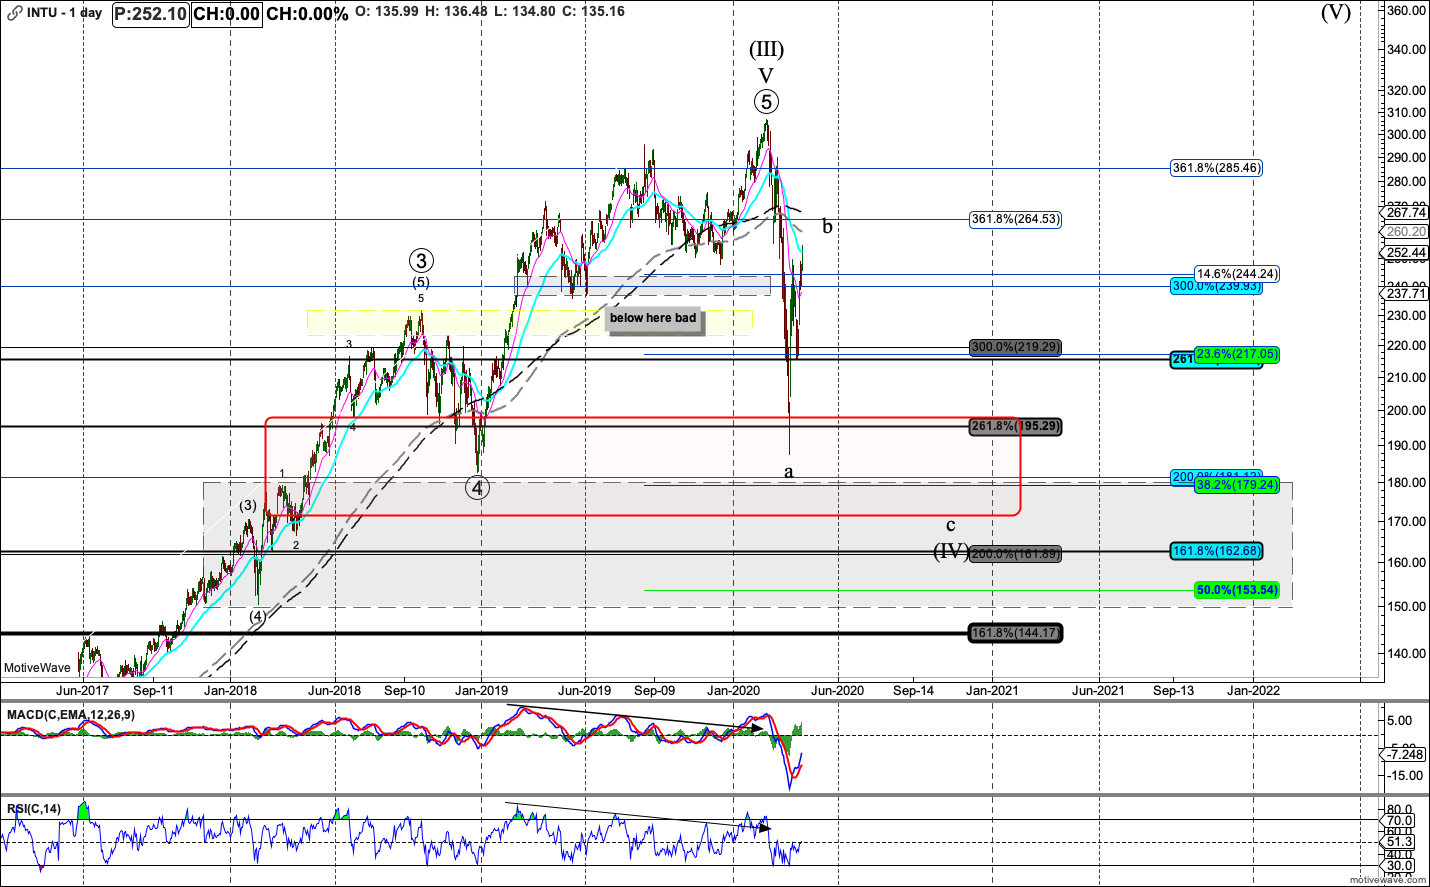
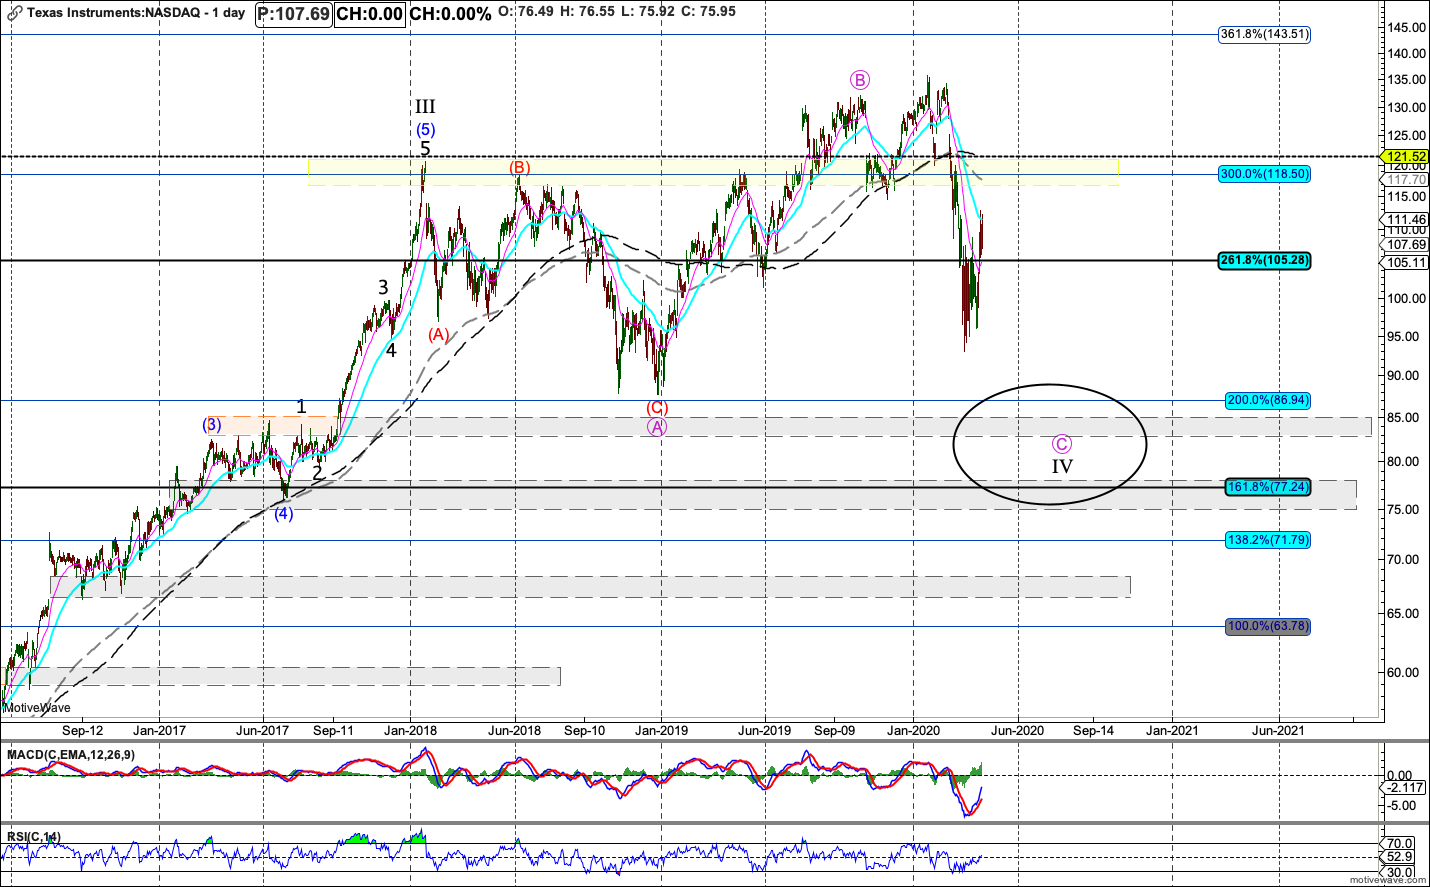
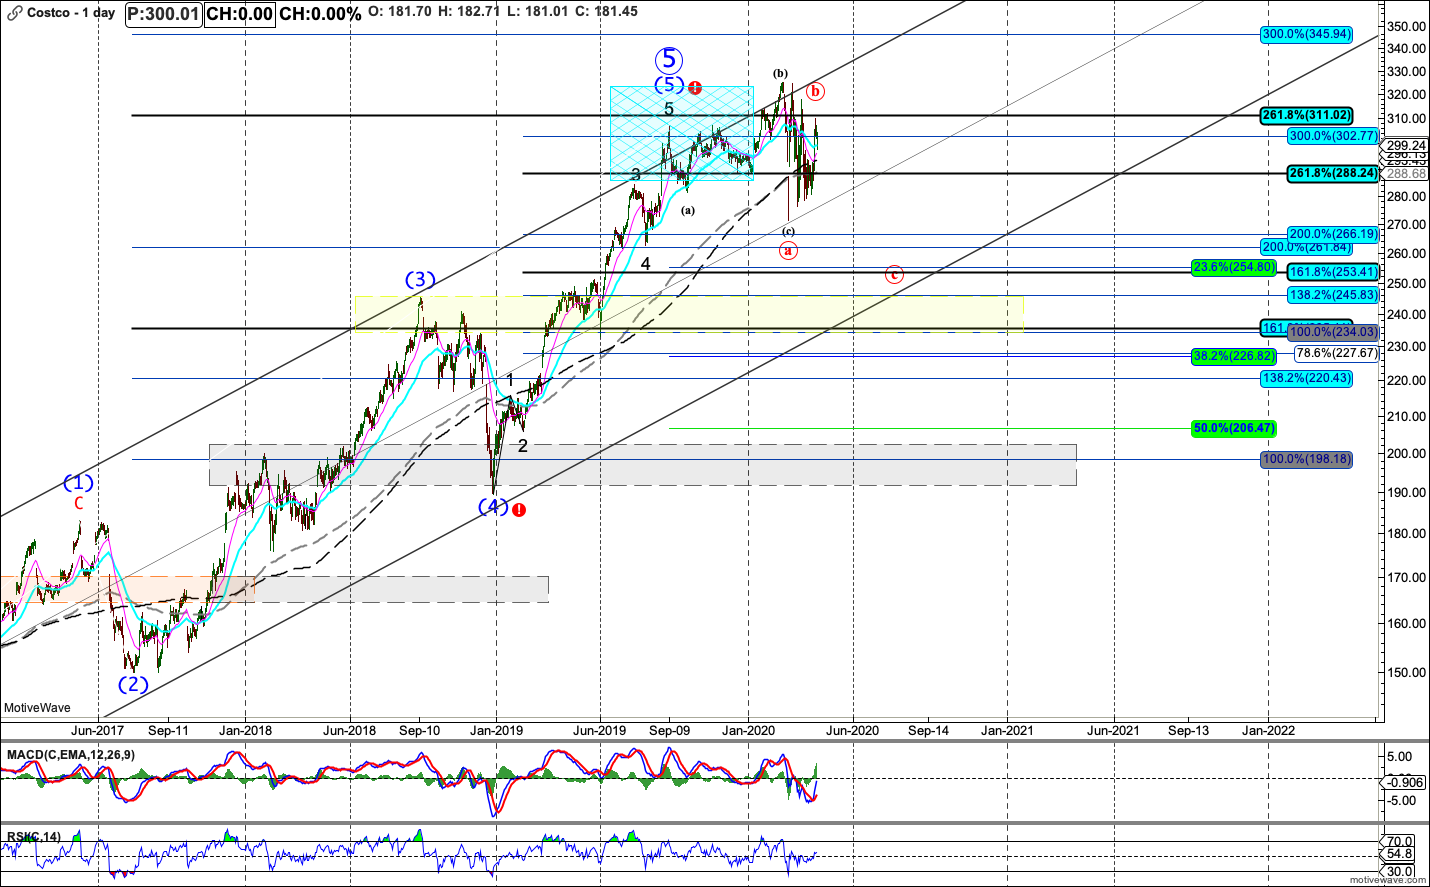
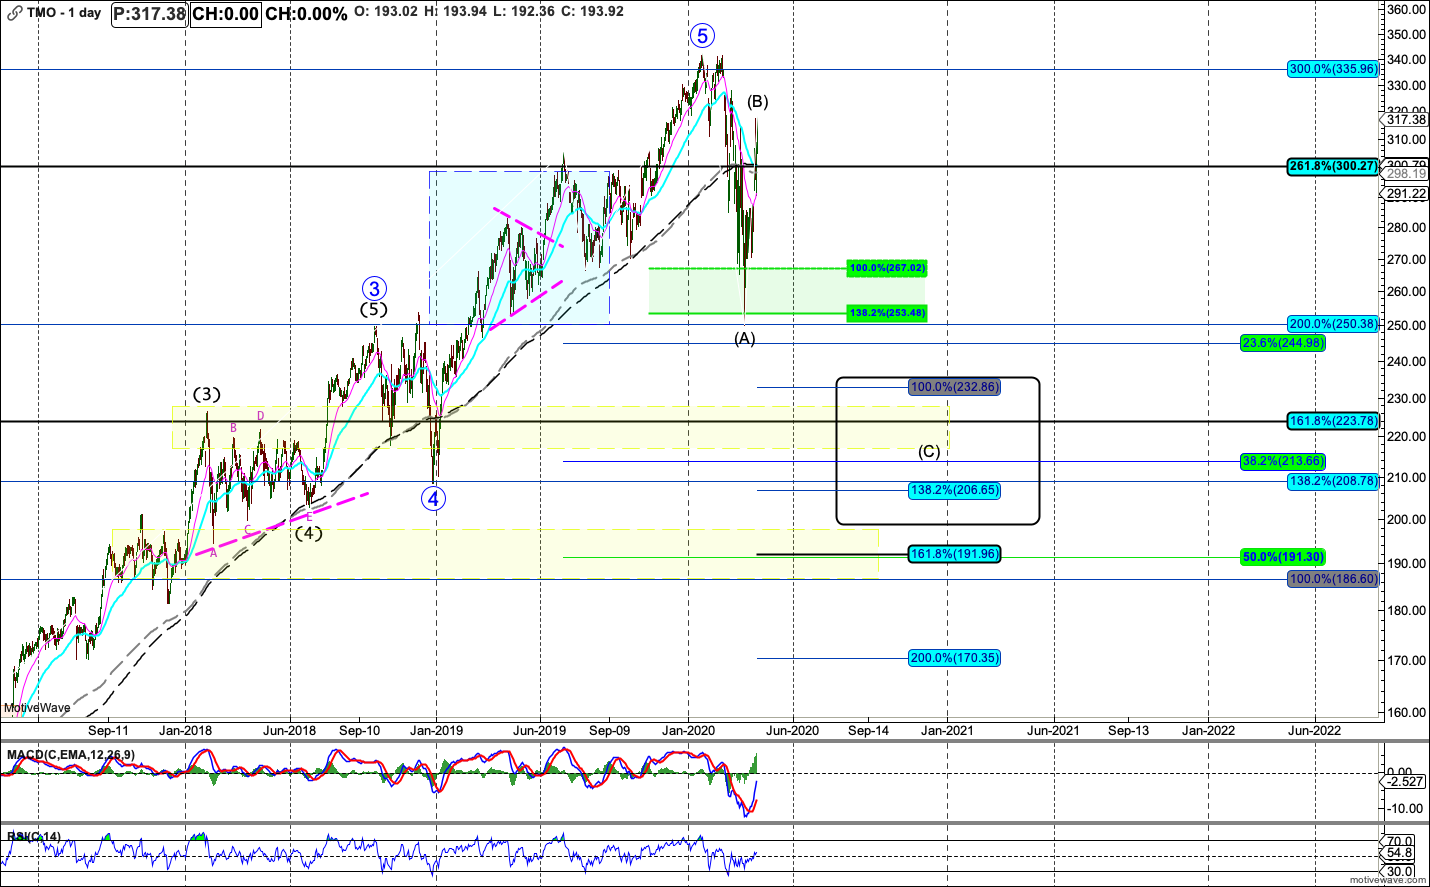
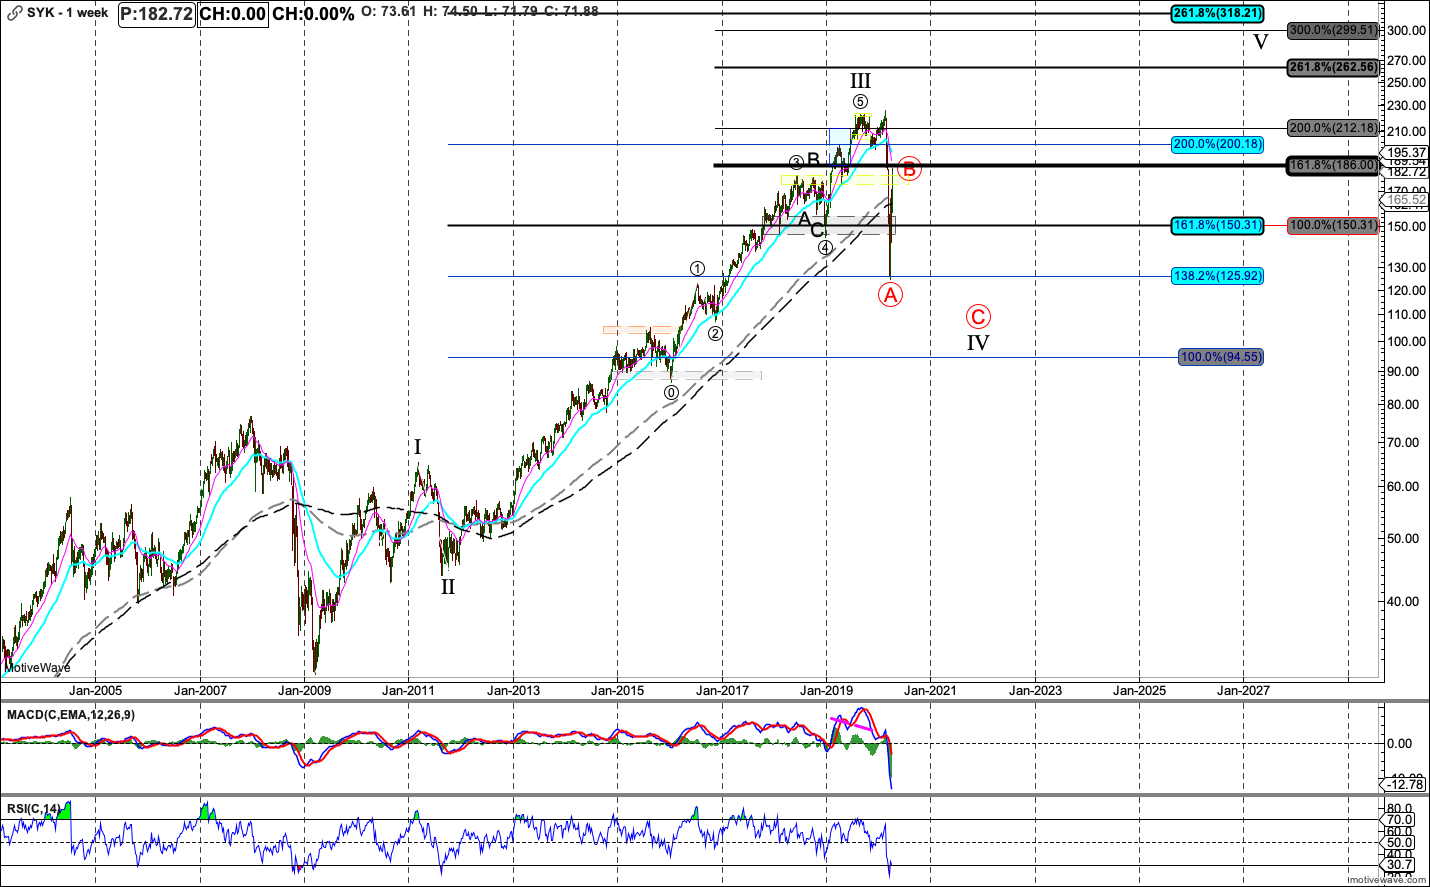
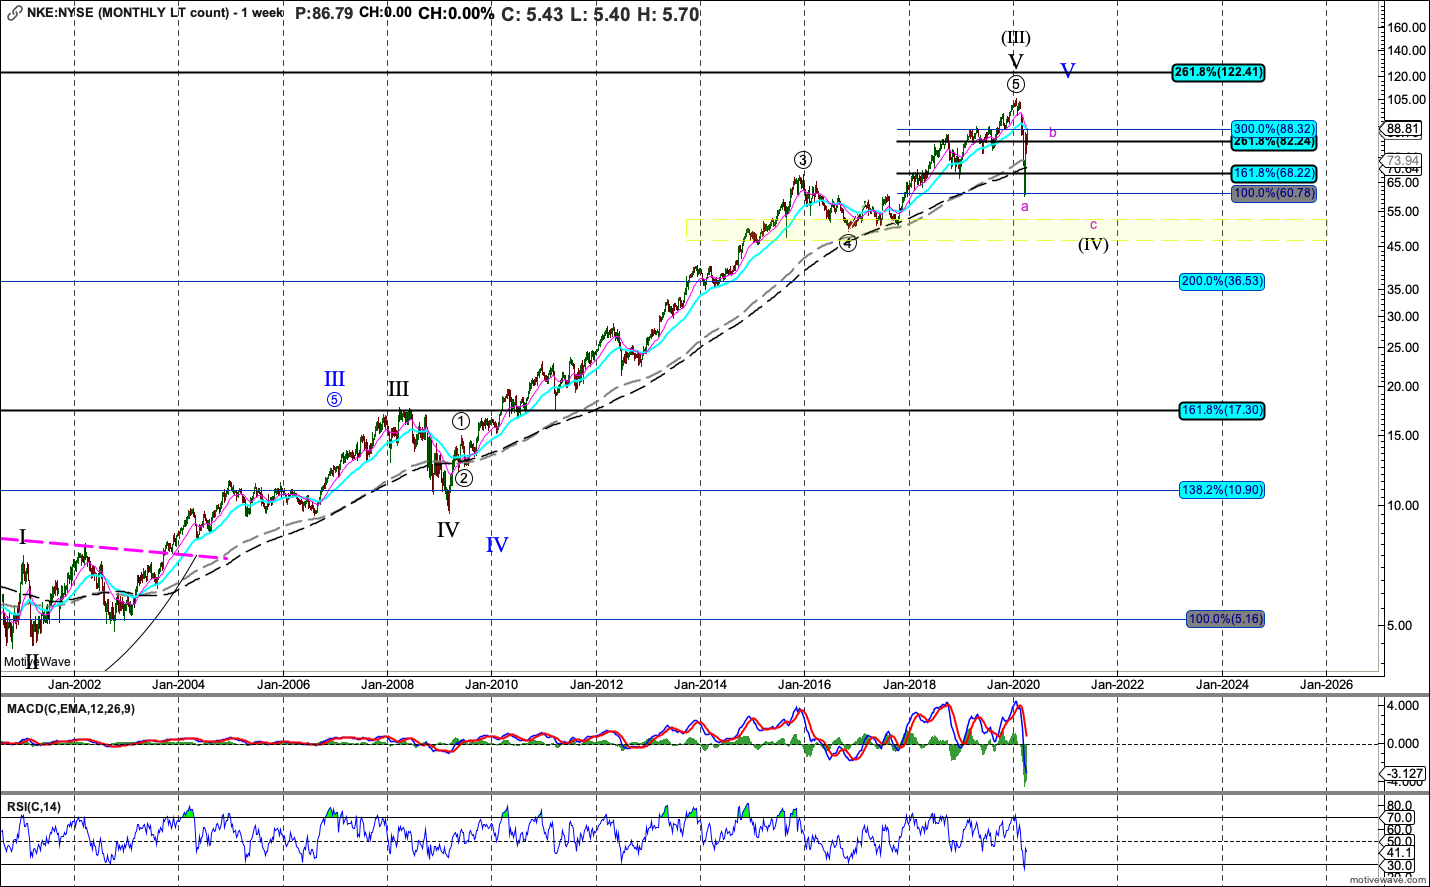
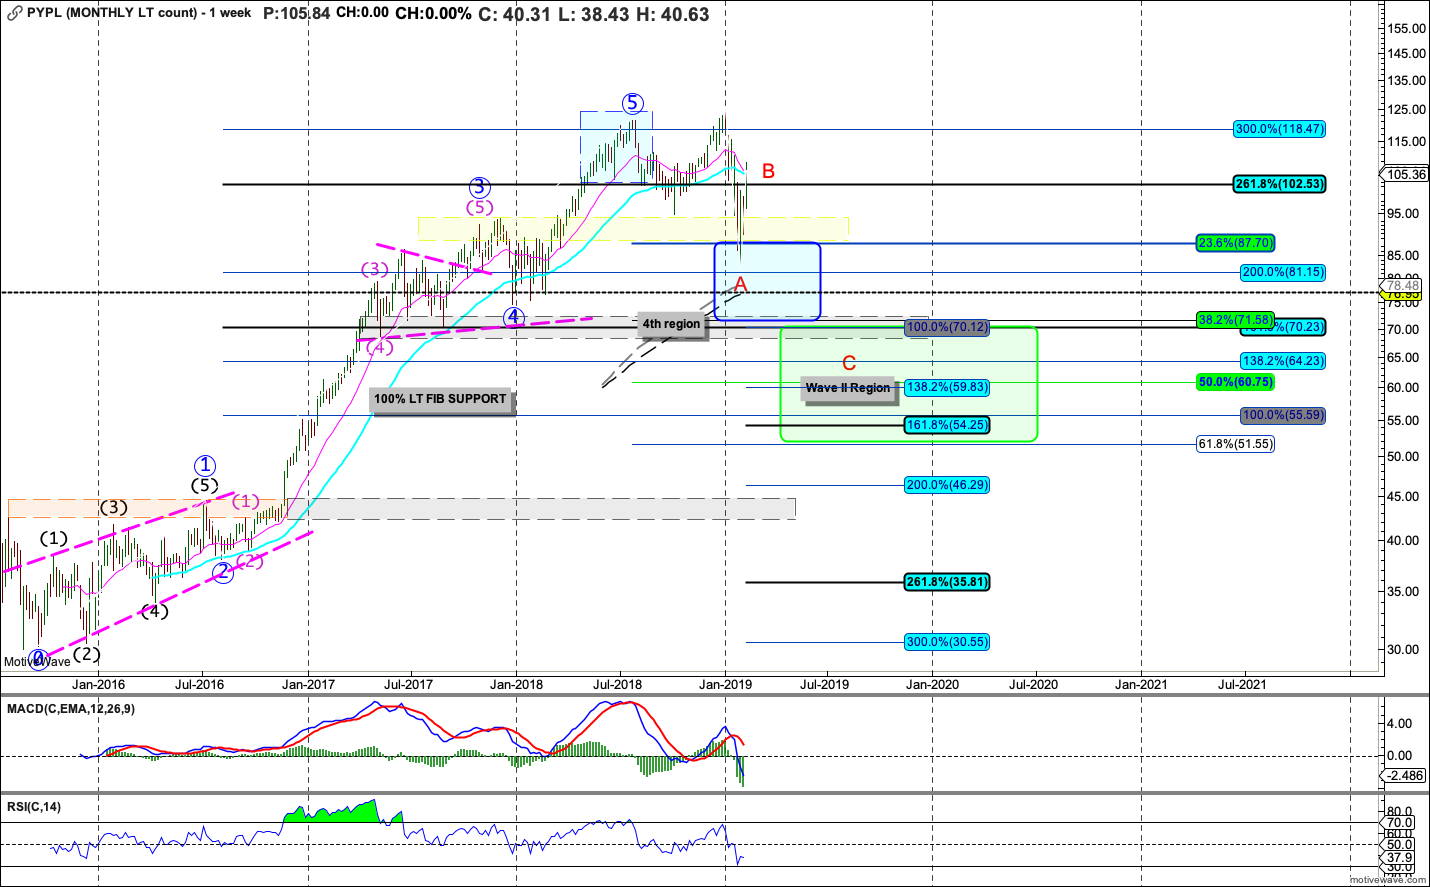
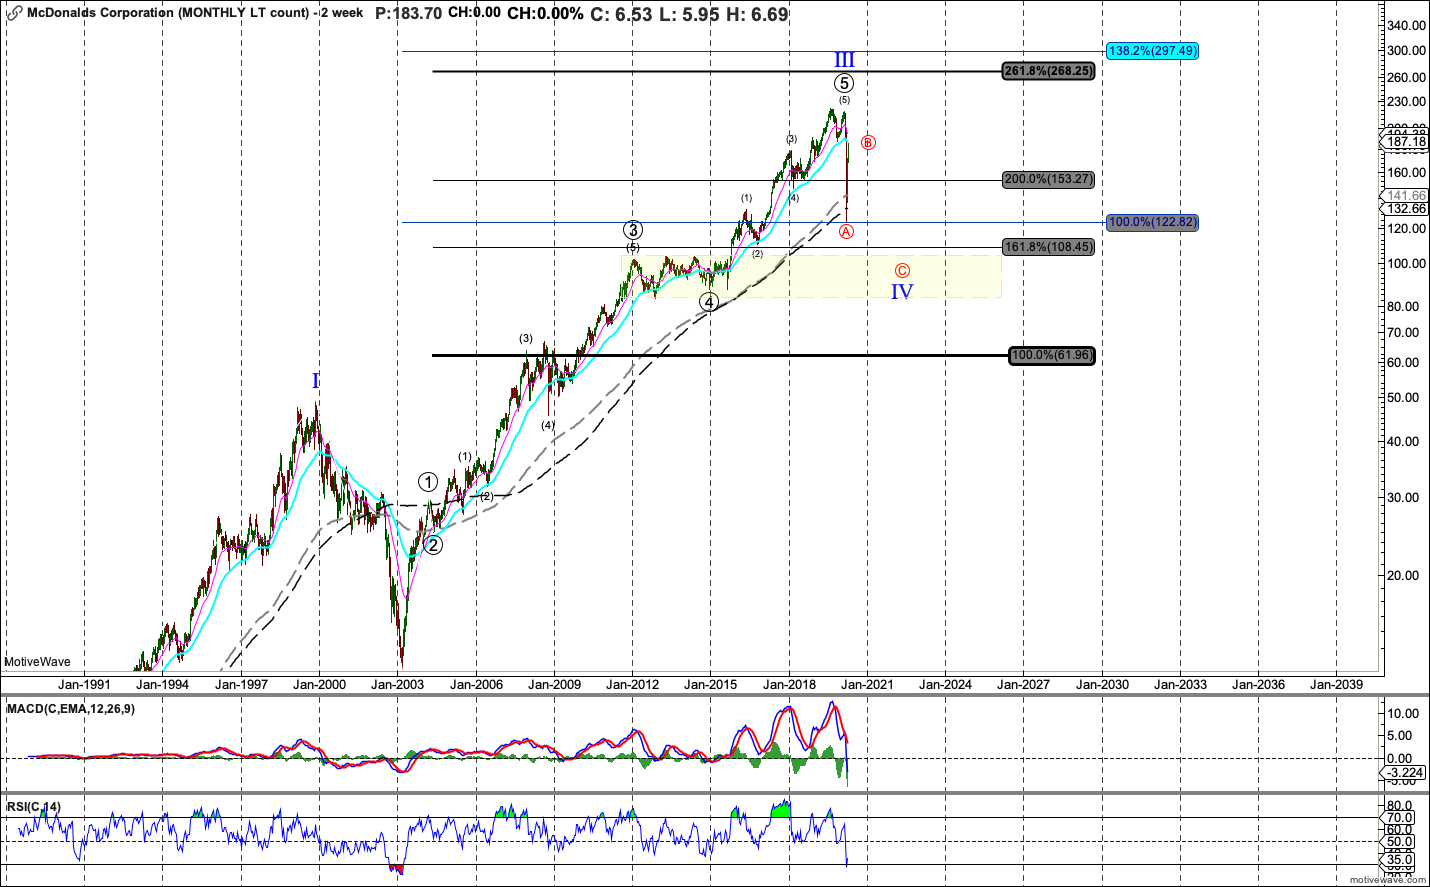
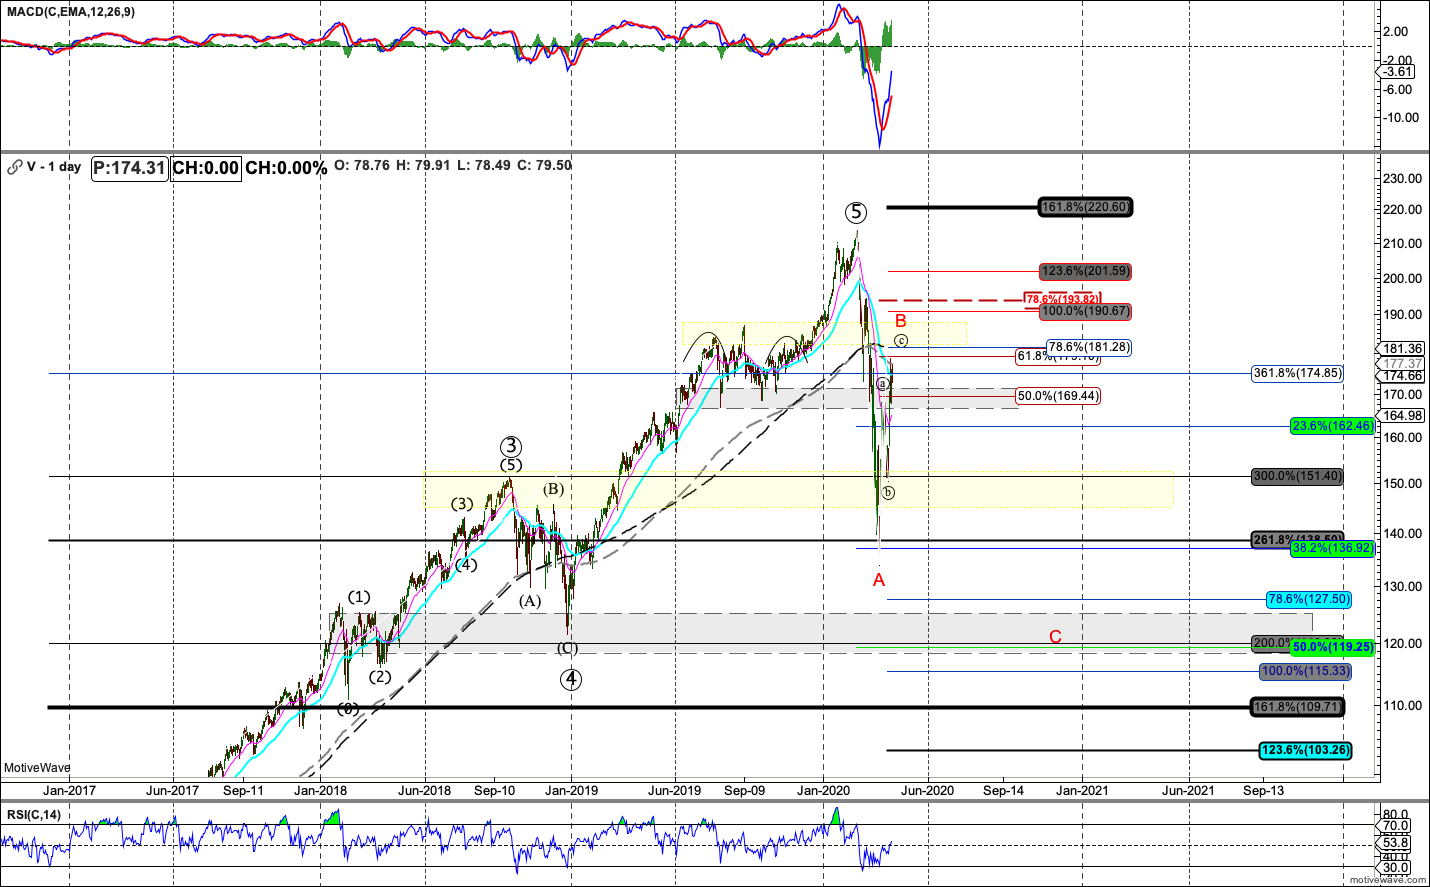
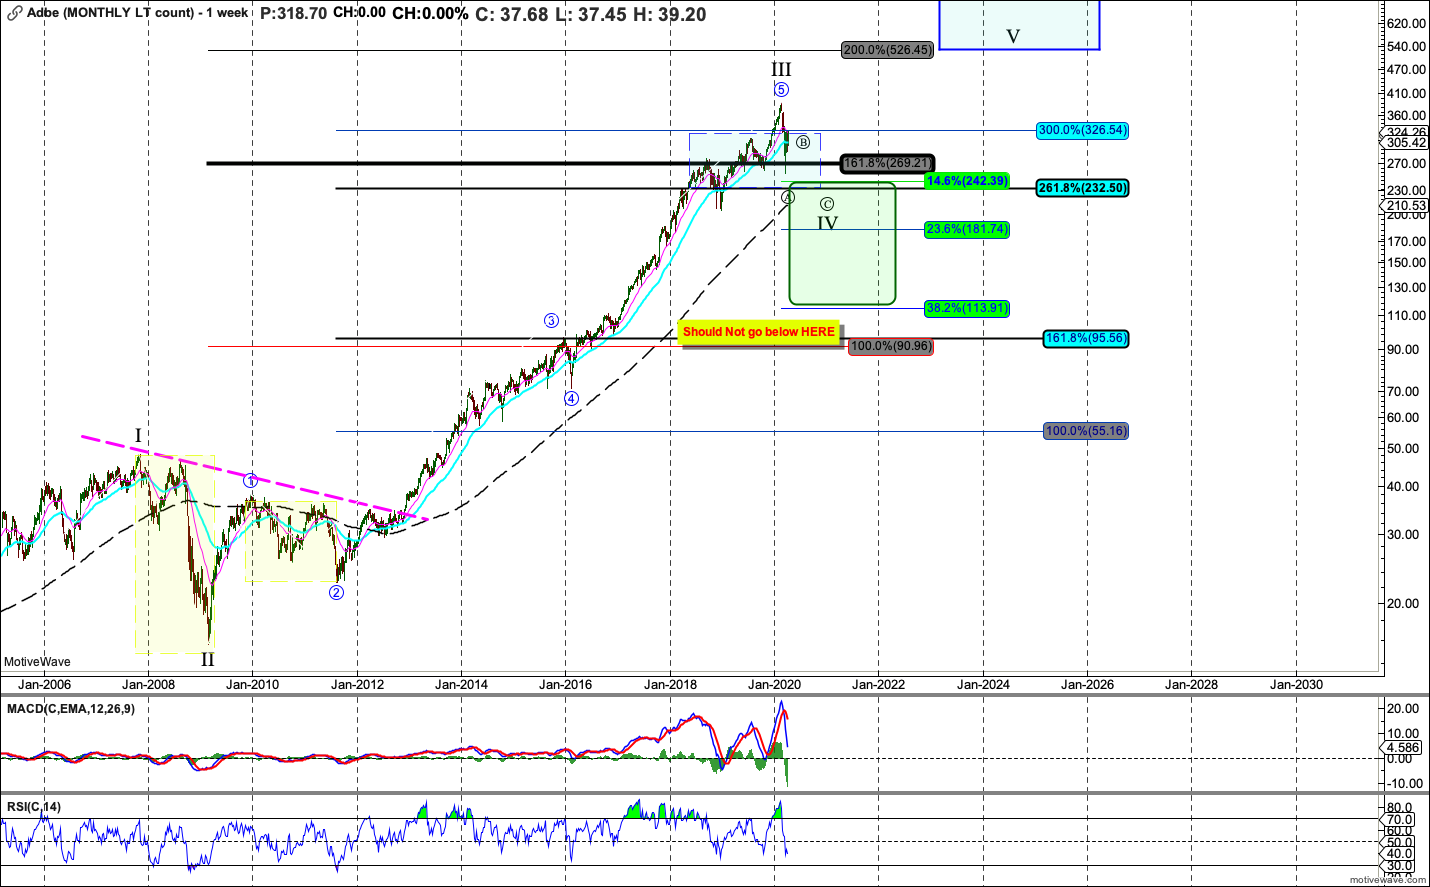
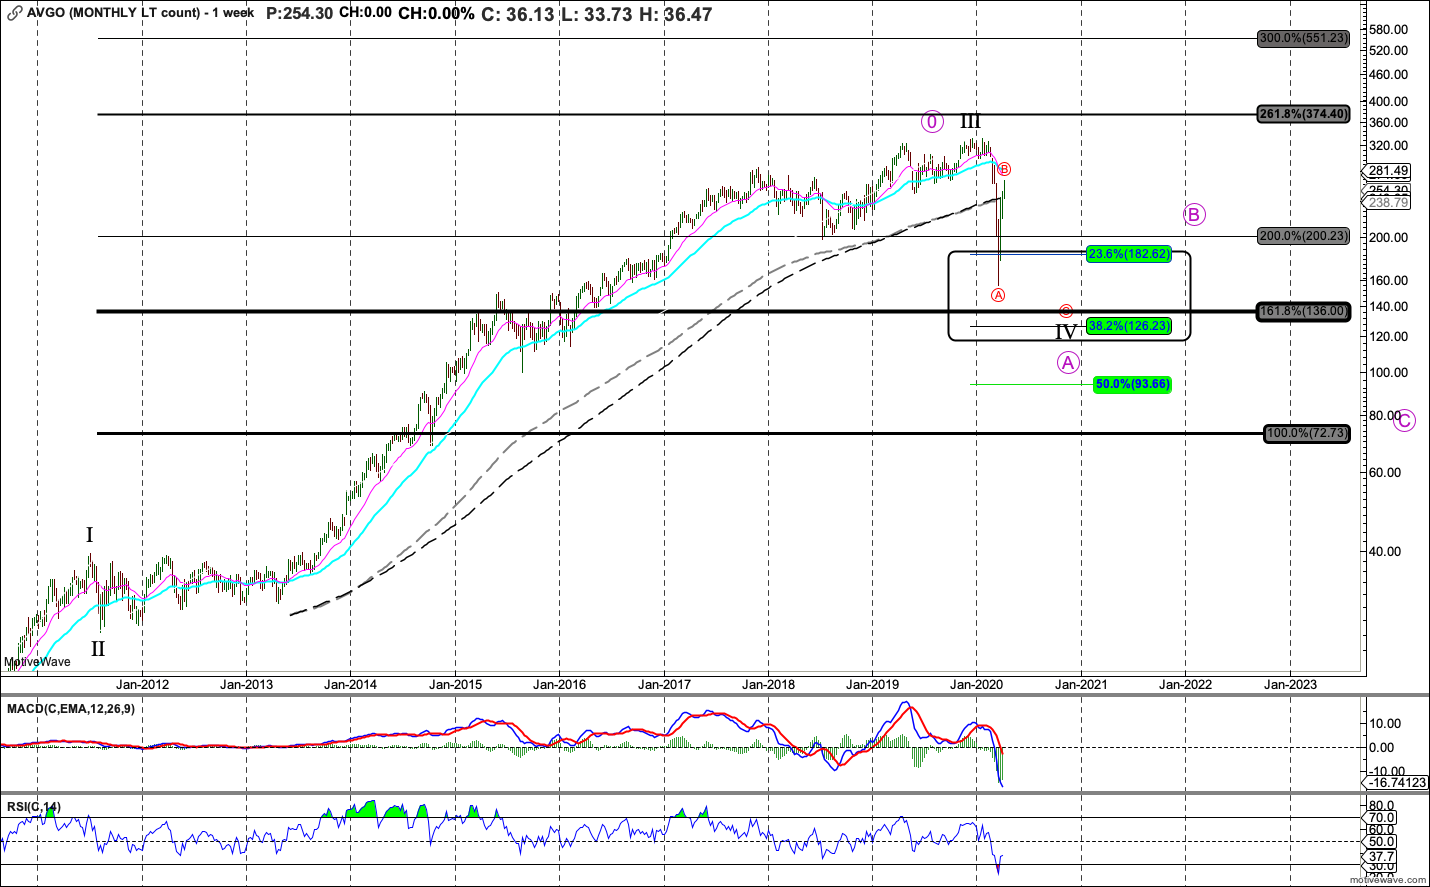
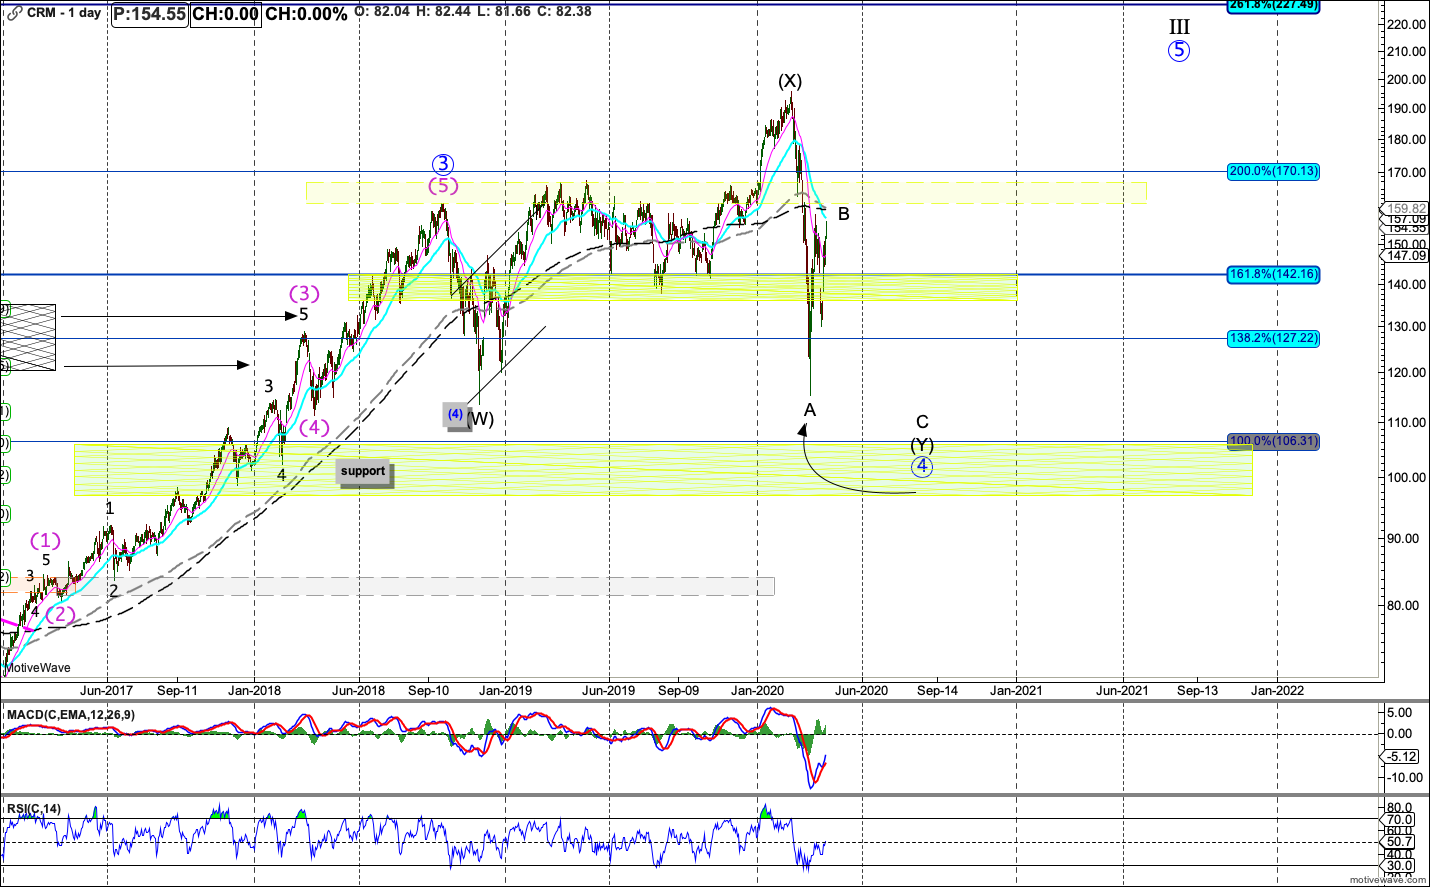
a lot of Individual Stocks (attached) look like very good A-B's ....or iv bounces with v's left....
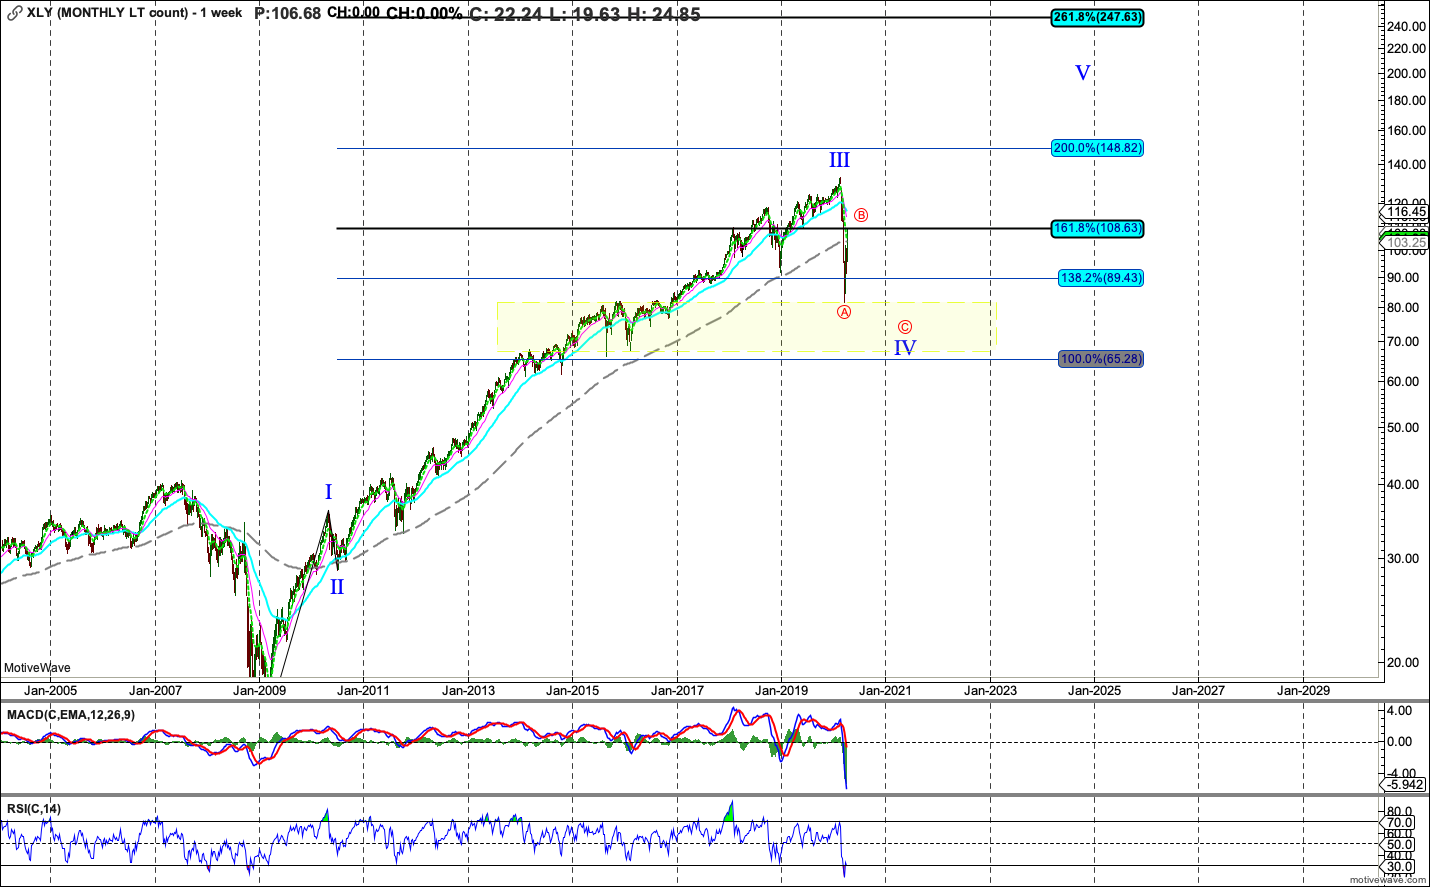
That puts me in these scenarios for SPX and QQQ's....on the weekly charts...
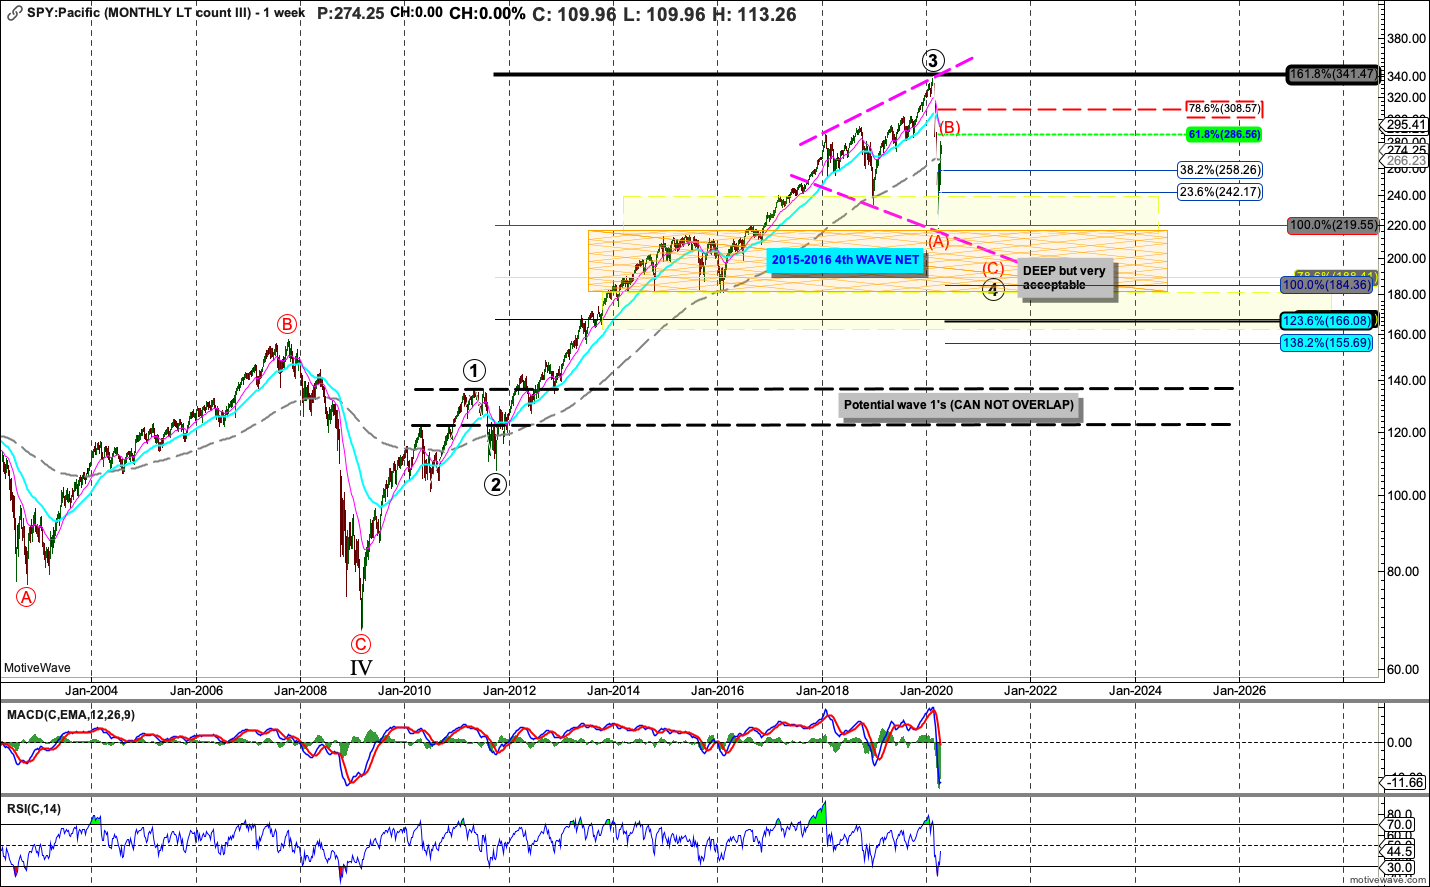
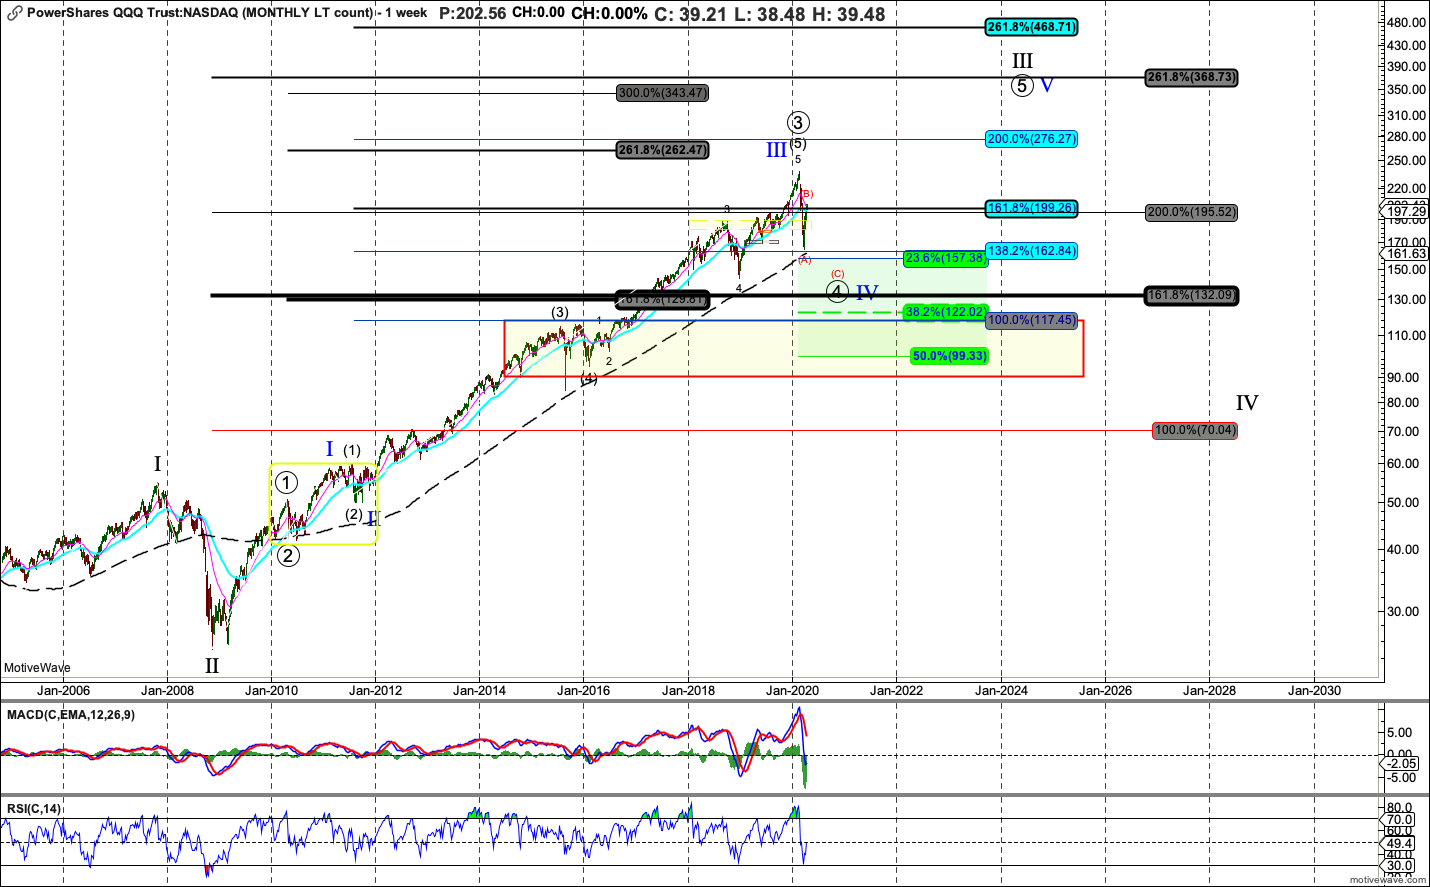
zoomed in there is still a number of ways it could play out...a few shown here...
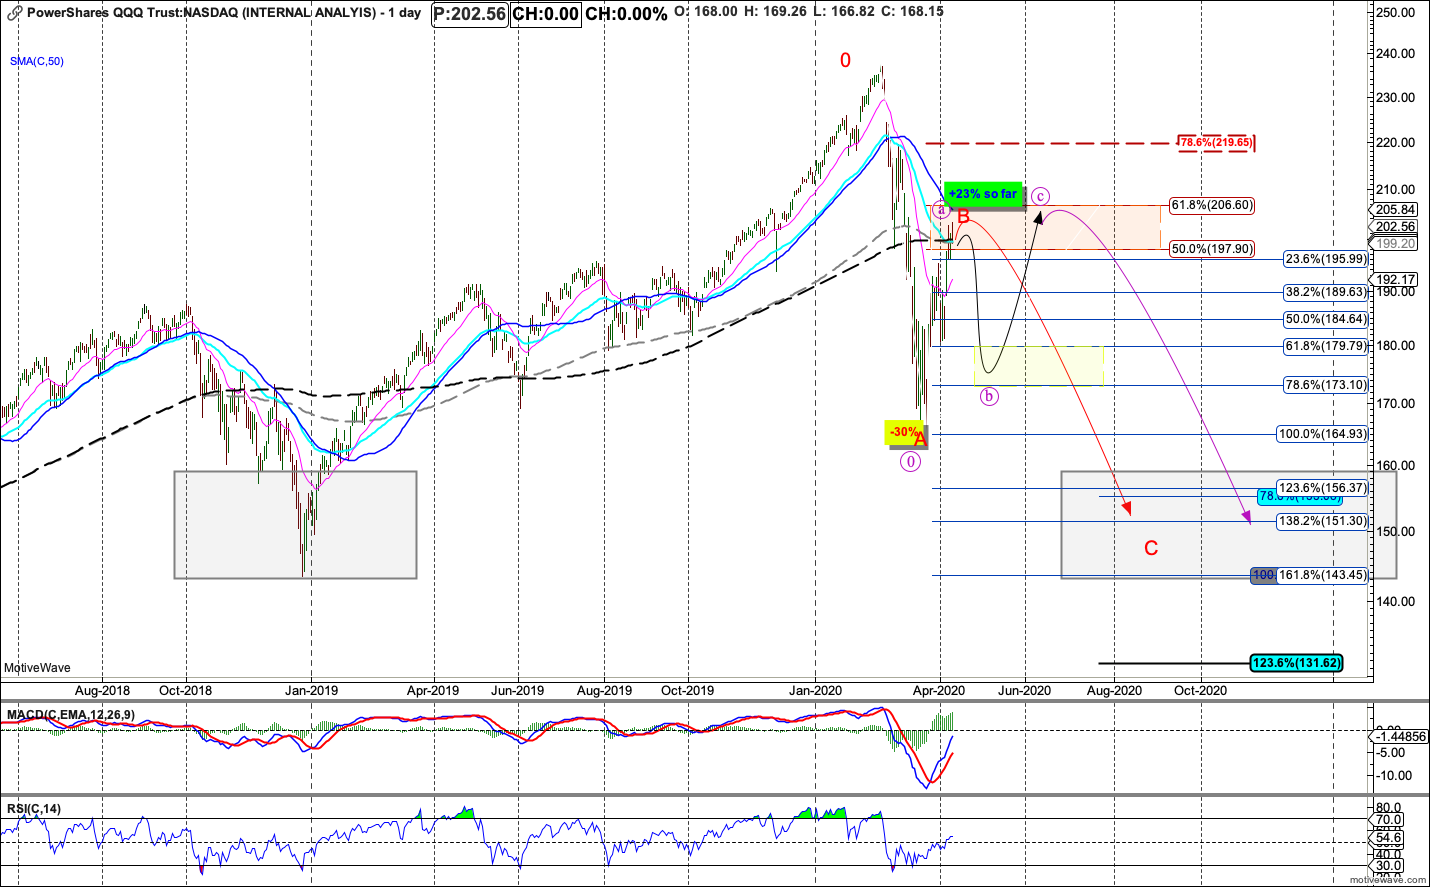
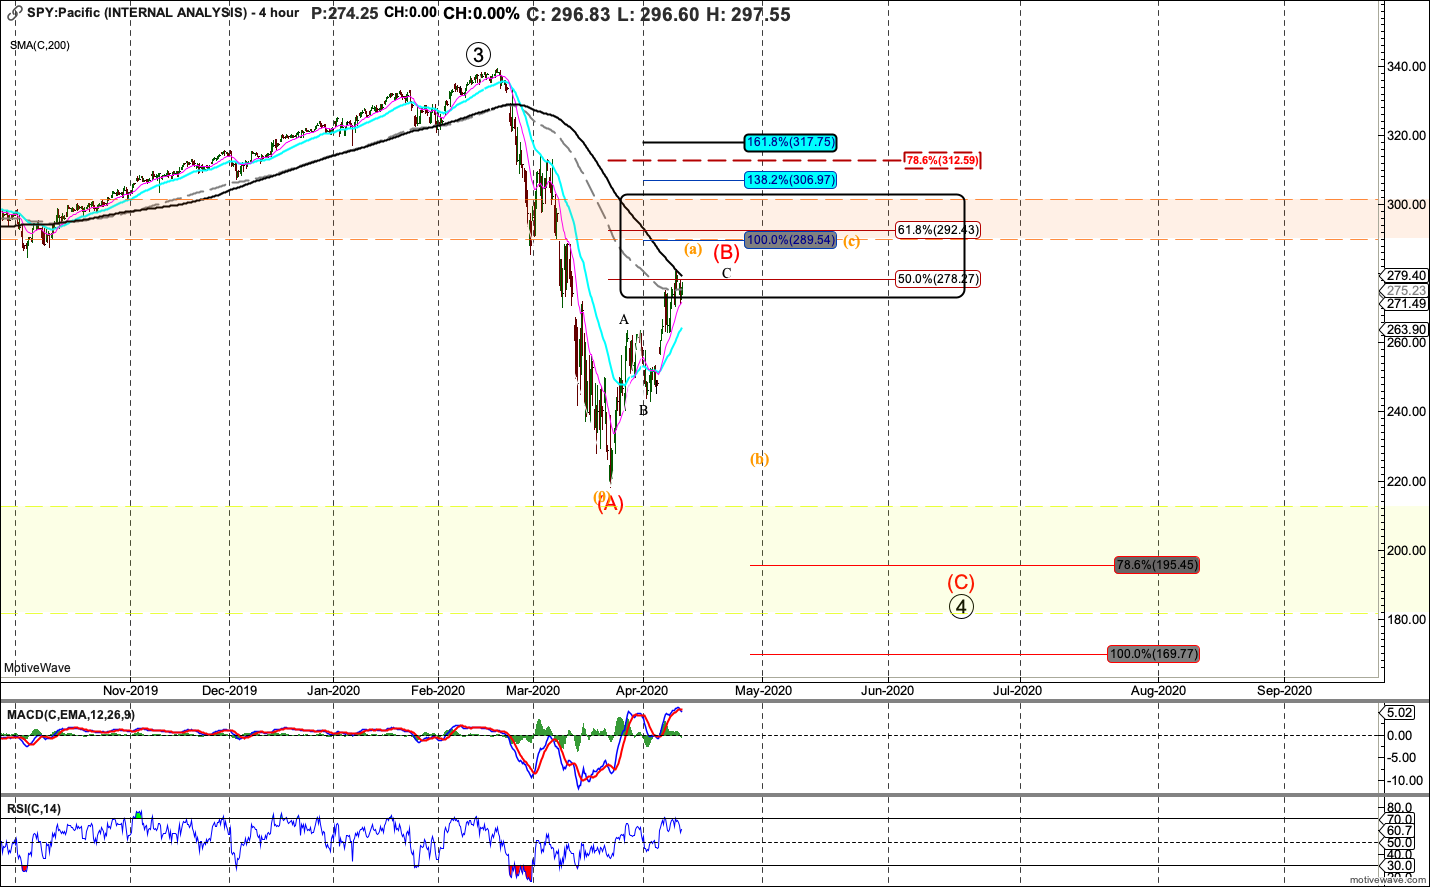
I actually prefer the more drawn out B-wave....where we circle back down for (b) of B....then another rip to (c) of a larger B-wave....this would chew up a lot more time....and put is in a big range for quite awhile. It would allow us time to work through the economic issues i pointed out...and allow for the charts/technicals to ultimately get in alignment with valuations/fundamentals etc...and bottom us later in the year say 1800/2000 something like that for this big wave 4.....
In Conclusion, my process, diligence, system, inputs do not allow me to get in alignment with any sort of V-shape Fomo bottom that is about to embark on new highs. I am just fine with that. It keeps me out of trouble and it catches big moves while Avoiding more importantly huge Draw Downs. (how many can say they made money in the up 2017 market, made money long and short in 2018...made money in 2019 (albeit less than tape for sure)....and made money in 2020!!! Not many.....so i trust my process, it catches the fat part of the bell-curve moves...and that is more than enough to profit from.
I will keep working hard and updating my inputs, and when they get back in alignment (bullishly) vs Bearishly current, I will flip to Bull Swing posture. I'm sorry many here have not seen me bullish. those that have been here for years and years can attest that I can be very bullish and trade that side aggressively. I think this will be a long sustained process given the data and economic back drop. The tape needs time to heal, time to base, time to work through this bad fundamental time.
I will finish with if the Fed Elixir does indeed V-shape this market.....I will watch patiently for the time my system comes into alignment with the next sustained bull market. That may be higher...that is again, fine with me. I dont try to catch THE LOW or THE HIGH, i try to sustainably catch the Meat of both moves (long and short)....that is what i call the safe part or highest odds moves...and those odds still say Bear Alignment...so Manage your RISK!!!
over and out