Where Fundamentals Meet Technicals: XLK and XLE
 By
Lyn Alden
By
Lyn Alden
This issue of “Where Fundamentals Meets Technicals” looks at two key sectors: technology and energy.
S&P 500 Technology Sector
The S&P 500 technology sector ETF (XLK) is very concentrated into Apple (AAPL) and Microsoft (MSFT), with each one of them holding more than a 20% weighting. Nvidia (NVDA) is the distant third place in the group.
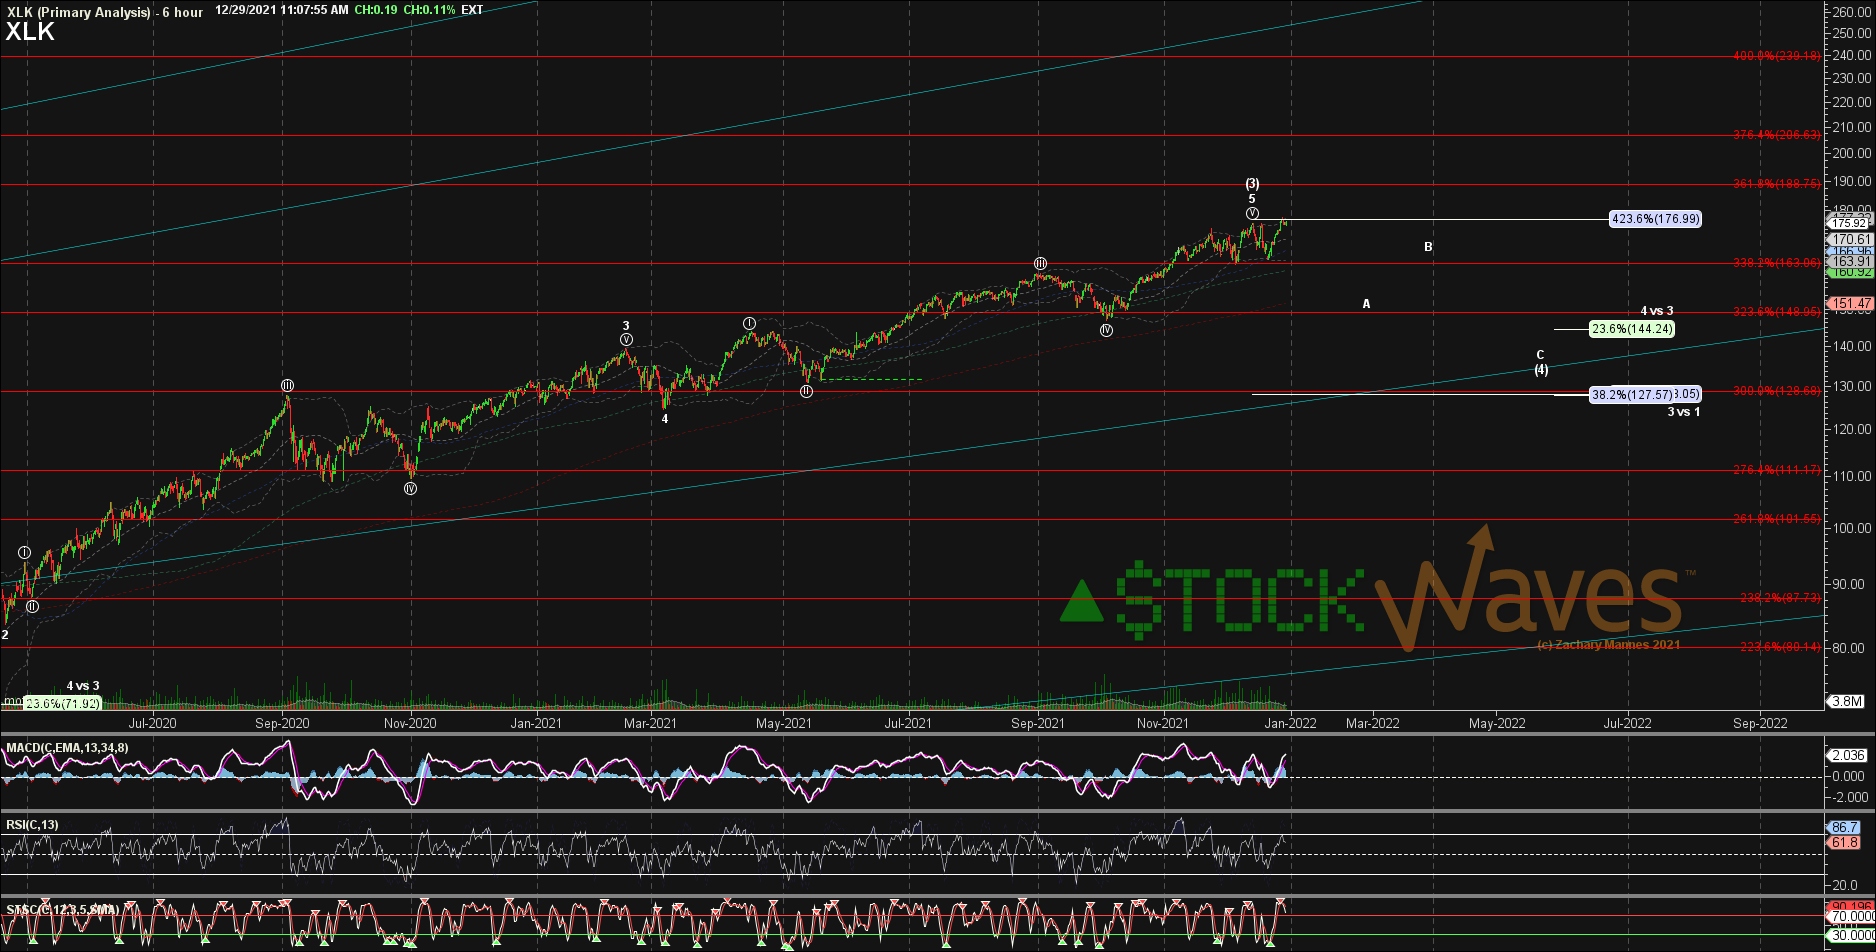
While a top in this sector has not yet been confirmed with a momentum shift, Zac is looking for a potential topping pattern around this level:
The valuations of the largest companies do support that view. Sentiment and valuations are very bullish on these companies, which can be a contrarian indicator.
Microsoft trades at quite a hefty valuation, and although I’ve been holding it for years, if it starts to show more of a topping pattern, it’s on my potential sell list:
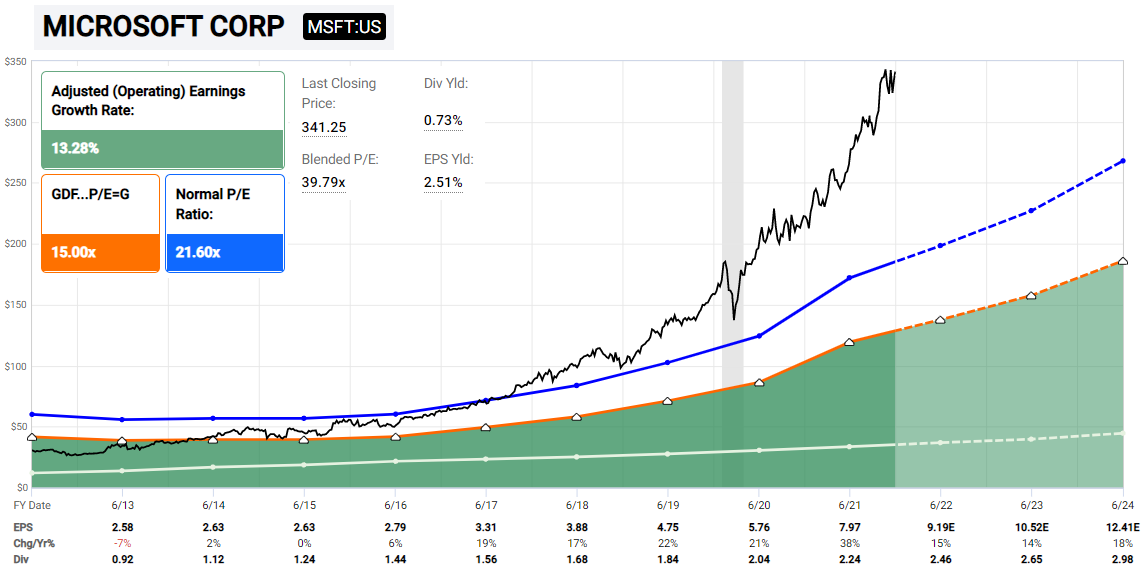
Chart Source: F.A.S.T. Graphs
Apple appears to be more of a problem. At this valuation level, Apple bulls better hope that the company notably outperforms consensus analyst expectations for growth over the next few years:
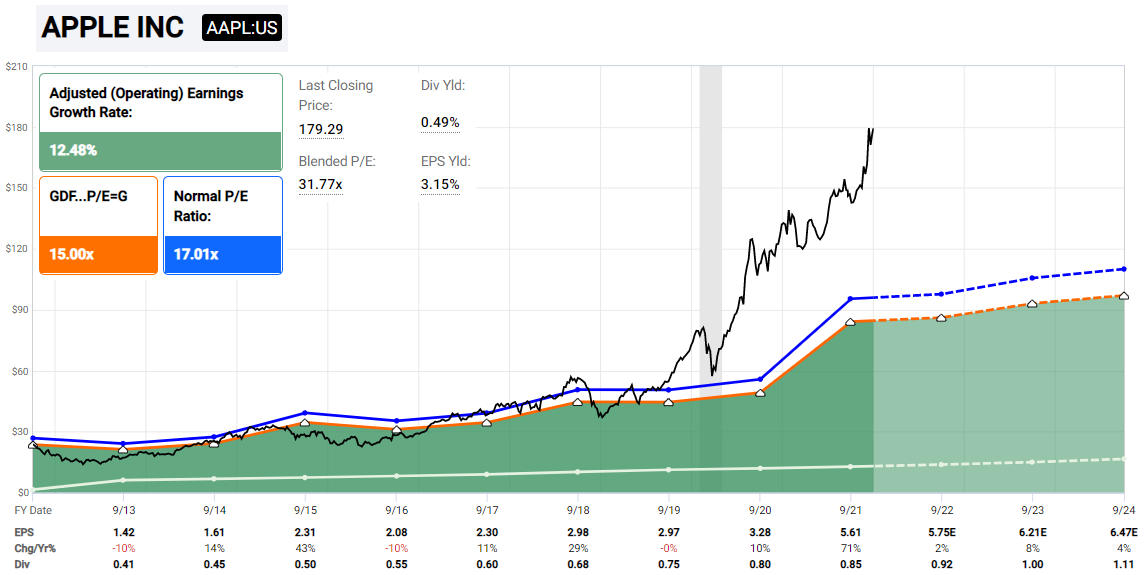
Chart Source: F.A.S.T. Graphs
Nvidia, as much as I like the company fundamentally, is at an extreme valuation:
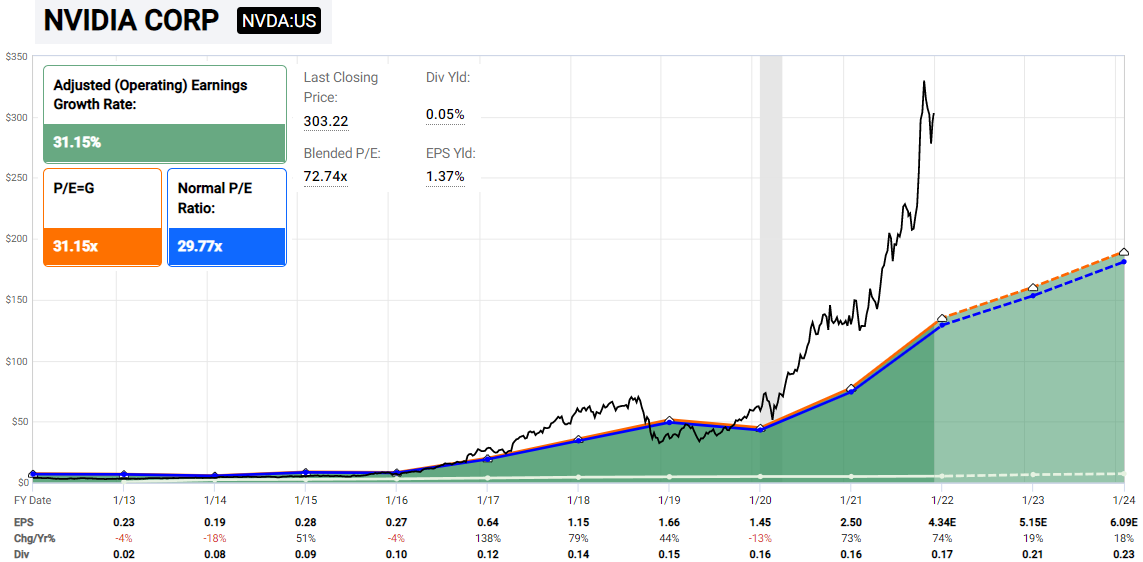
Chart Source: F.A.S.T. Graphs
If I run the price/sales multiples for the three companies, we can see it this way:
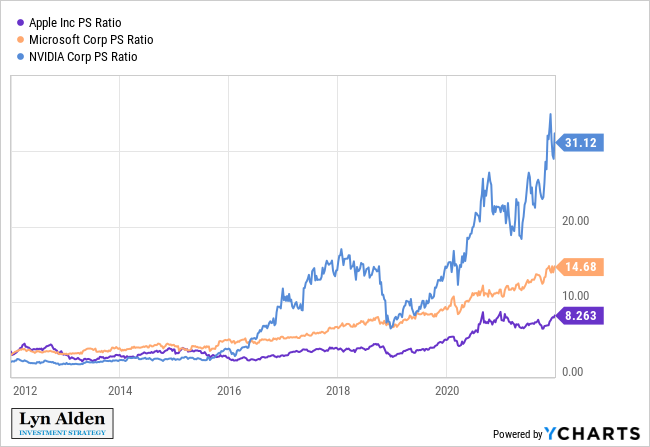
Apple has the lowest price/sales multiple because it’s mainly a hardware company with slow topline growth, but it’s rather expensive in absolute terms. Microsoft has a higher sales multiple because it’s primarily a software company and has faster topline growth. Nvidia is a hardware company but due to explosive growth, it has the highest current sales multiple.
All three of them went up dramatically in terms of valuation; their underlying sales growth has been good but investors have also been willing to pay higher and higher sales multiples, which ends up lowing future return potential. NVDA for example used to trade at 2.5x annual sales, but now trades at 31x annual sales…
S&P 500 Energy Sector
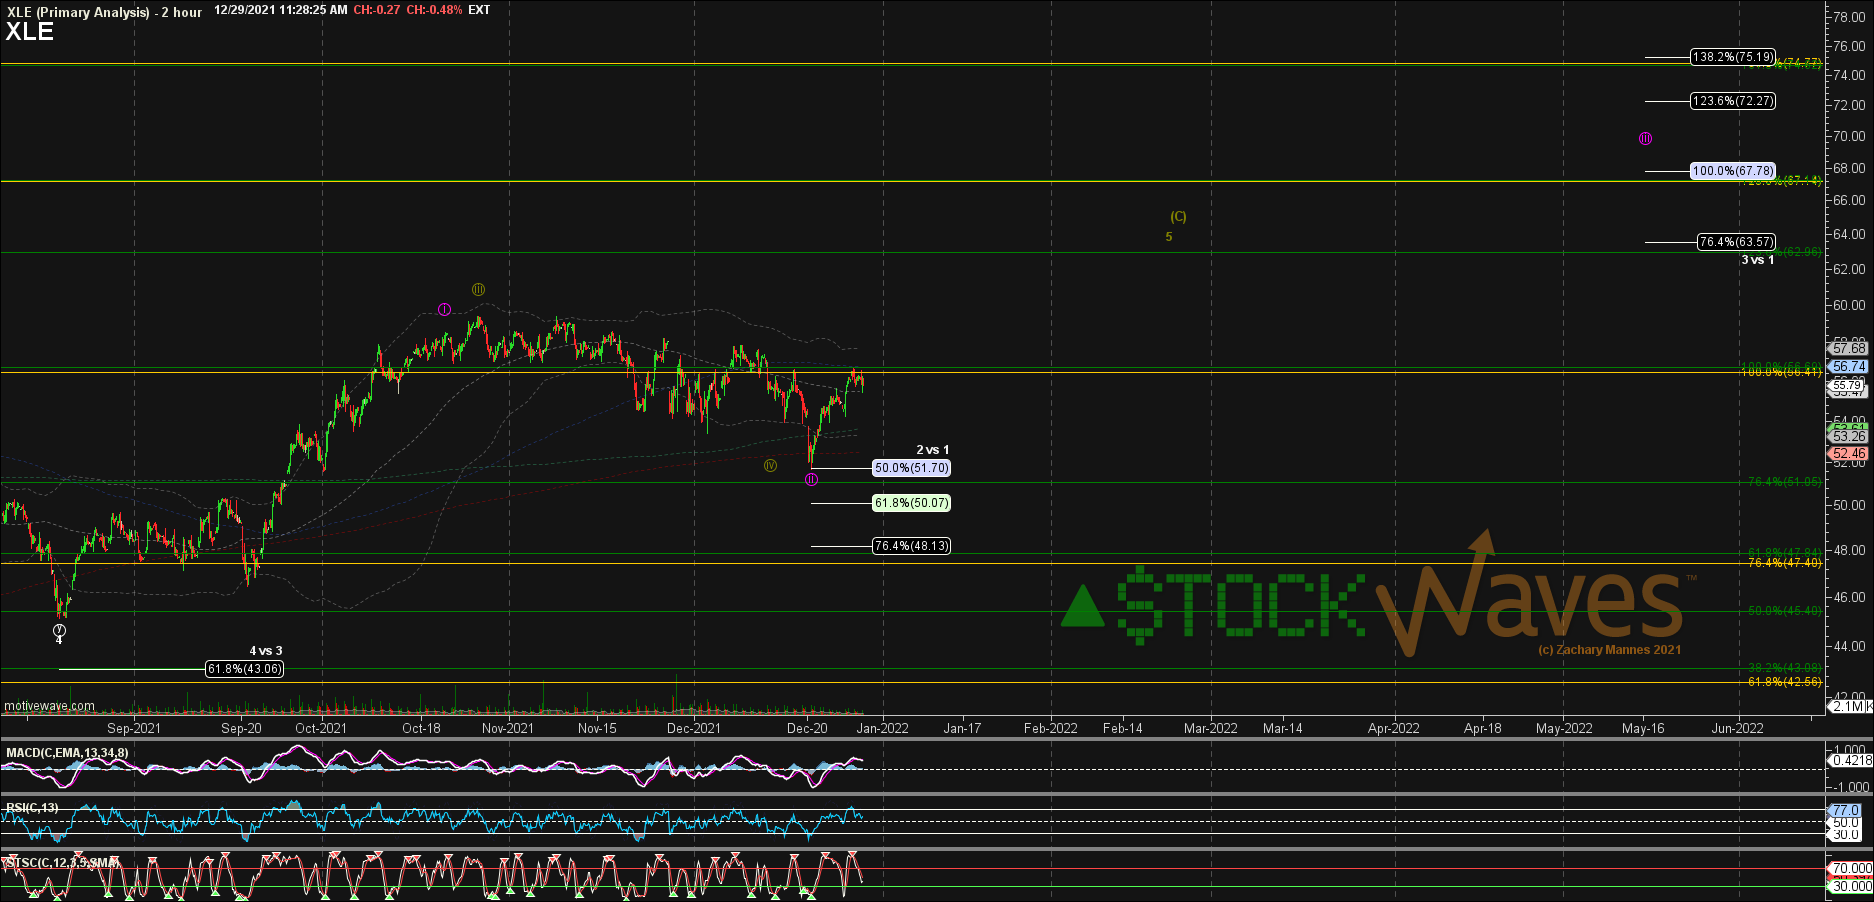
Meanwhile, the energy sector (XLE) remains historically cheap. Zac expects ongoing bullishness in the sector:
The two biggest holdings are ExxonMobil (XOM) and Chevron (CVX) which each represent over 20% of the fund.
Exxon remains rather cheap on a historical basis, and is paying a 5-6% dividend yield while it is held.
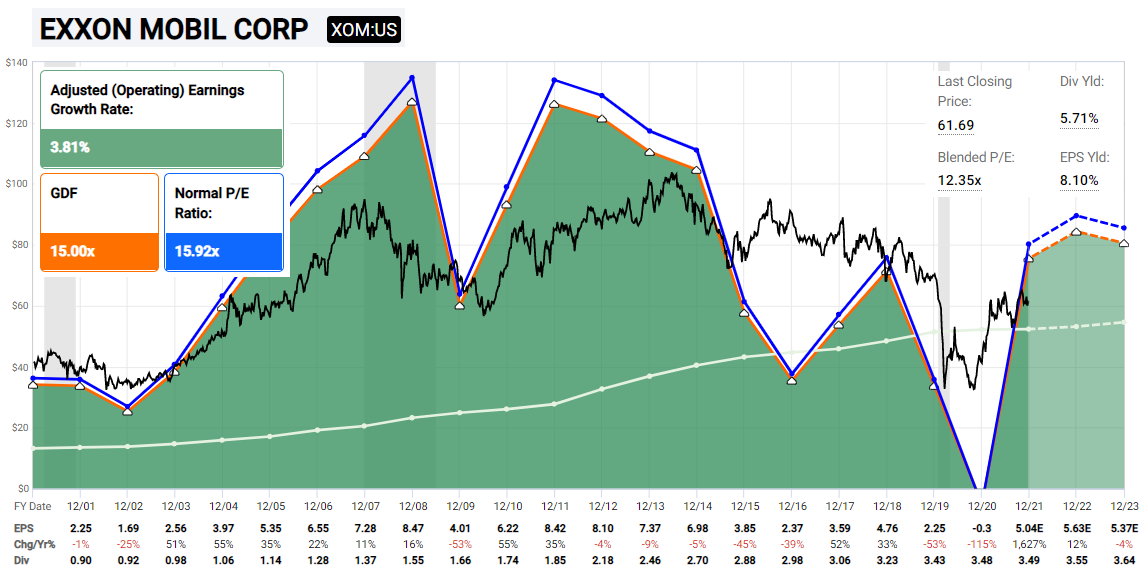
Chart Source: F.A.S.T. Graphs
Energy demand remains rather strong around the world, but there is not much investment in new exploration, which sets up a somewhat tight energy market with a lot of free cash flow for the producers.
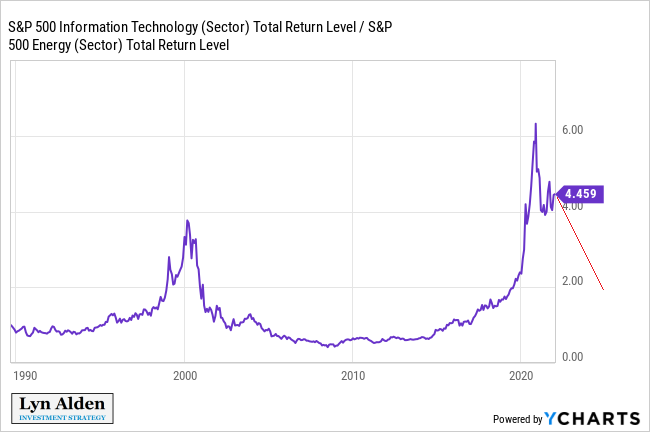
This chart shows the technology sector divided by the energy sector. When it’s going up, it means tech is outperforming and when it is going down it means energy is outperforming. After this blow-off top that looks similar to the dotcom bubble, I think the energy sector still has a lot of outperformance left in it before this cycle is finished: